marketable surplus and post harvest losses of ragi in ... - Agmarknet
marketable surplus and post harvest losses of ragi in ... - Agmarknet
marketable surplus and post harvest losses of ragi in ... - Agmarknet
- No tags were found...

You also want an ePaper? Increase the reach of your titles
YUMPU automatically turns print PDFs into web optimized ePapers that Google loves.
MARKETABLE SURPLUS AND POST HARVESTLOSSES OF RAGI IN INDIA(2002)GOVERNMENT OF INDIAMINISTRY OF AGRICULTURE(DEPARTMENT OF AGRICULTURE AND COOPERATION)DIRECTORATE OF MARKETING AND INSPECTIONBRANCH HEAD OFFICENAGPUR – 440 001
CONTENTSChapter No. Content Page No.Preface 10Summary 11I Introduction 13II Sampl<strong>in</strong>g Design <strong>and</strong> Coverage 14III Estimation Procedure 18IV Area <strong>and</strong> Production <strong>of</strong> Ragi 21V Retention <strong>of</strong> Ragi by Farm Household 27VI Post Harvest Losses <strong>of</strong> Ragi at Farm Level 38VII Marketed Surplus 42VIII Marketable Surplus 49Annexures – I to LXII 53-120Credits 121-122
LIST OF ANNEXURESAnnexure No.IIIIIIIVVVIVIIVIIIIXIX-AXXIXIIXIIIXIVXVXVIXVIIContentArea under Ragi – Irrigated/UnirrigatedArea under Ragi – High Yield<strong>in</strong>g <strong>and</strong>Traditional VarietiesProduction <strong>of</strong> Ragi – Irrigated/UnirrigatedProduction <strong>of</strong> Ragi – High Yield<strong>in</strong>gVarieties (HYV) <strong>and</strong> Traditional Varieties (TV)Retention <strong>of</strong> Ragi for Farm Family ConsumptionRetention <strong>of</strong> Ragi for Consumption <strong>of</strong>Permanent LabourRetention <strong>of</strong> Ragi for Consumption <strong>of</strong>Temporary LabourTotal Retention <strong>of</strong> Ragi for ConsumptionAt Farm LevelTotal Retention <strong>of</strong> Ragi for SeedTotal Retention <strong>of</strong> Ragi for Seed – Irrigated/UnirrigatedRetention <strong>of</strong> Ragi for Animal FeedUtilisation <strong>of</strong> Ragi for payment <strong>in</strong> Cash toTemporary Farm Labours <strong>and</strong> Other Purposes (current year crop)– Small Category CultivatorsUtilisation <strong>of</strong> Ragi for payment <strong>in</strong> Cash to TemporaryFarm Labours <strong>and</strong> Other Purposes (current year crop)– Medium Category CultivatorsUtilisation <strong>of</strong> Ragi for payment <strong>in</strong> Cash to TemporaryFarm Labours <strong>and</strong> Other Purposes (current year crop)– Large Category CultivatorsUtilisation <strong>of</strong> Ragi for payment <strong>in</strong> Cash to TemporaryFarm Labours <strong>and</strong> Other Purposes (current year crop)– All Categories <strong>of</strong> CultivatorsUtilisation <strong>of</strong> Ragi from Sale Proceeds (Previous YearCrop) for Cash Payment for Temporary Labour & OtherPurposes – Small Category CultivatorsUtilisation <strong>of</strong> Ragi from Sale Proceeds (Previous YearCrop) for Cash Payment for Temporary Labour & OtherPurposes – Medium Category CultivatorsUtilisation <strong>of</strong> Ragi from Sale Proceeds (Previous YearCrop) for Cash Payment for Temporary Labour & OtherPurposes – Large Category Cultivators
XVIIIXIXXXXXIXXIIXXIIIXXIVXXVUtilisation <strong>of</strong> Ragi from Sale Proceeds (Previous YearCrop) for Cash Payment for Temporary Labour & OtherPurposes – All Categories <strong>of</strong> CultivatorsUtilisation <strong>of</strong> Ragi for K<strong>in</strong>d Payment to TemporaryLabour & Other Purposes – Small Category CultivatorsUtilisation <strong>of</strong> Ragi for K<strong>in</strong>d Payment to TemporaryLabour & Other Purposes – Medium Category CultivatorsUtilisation <strong>of</strong> Ragi for K<strong>in</strong>d Payment to TemporaryLabour & Other Purposes – Large Category CultivatorsUtilisation <strong>of</strong> Ragi for K<strong>in</strong>d Payment to TemporaryLabour & Other Purposes – All Categories <strong>of</strong> CultivatorsLosses <strong>of</strong> Ragi dur<strong>in</strong>g Thresh<strong>in</strong>gLosses <strong>of</strong> Ragi dur<strong>in</strong>g Thresh<strong>in</strong>g – Source-wiseLosses <strong>of</strong> Ragi dur<strong>in</strong>g W<strong>in</strong>now<strong>in</strong>gXXVI Losses <strong>of</strong> Ragi dur<strong>in</strong>g W<strong>in</strong>now<strong>in</strong>g -Mechanical / ManualXXVIIXXVIIIXXIXXXXXXXIXXXIIXXXIIIXXXIVXXXVXXXVIXXXVIIXXXVIIIXXXIXLosses <strong>of</strong> Ragi <strong>in</strong> Transport from Field toThresh<strong>in</strong>g FloorLosses <strong>of</strong> Ragi <strong>in</strong> Transport from Field toThresh<strong>in</strong>g Floor – By Mode <strong>of</strong> Transport usedLosses <strong>of</strong> Ragi <strong>in</strong> Transport from Thresh<strong>in</strong>gFloor to StorageLosses <strong>of</strong> Ragi <strong>in</strong> Transport from Thresh<strong>in</strong>gFloor to Storage – By Mode <strong>of</strong> Transport usedTotal Losses <strong>of</strong> Ragi <strong>in</strong> Transport fromField to Storage – In Bulk / In BagsLosses <strong>of</strong> Ragi dur<strong>in</strong>g Storage at Farm LevelLosses <strong>of</strong> Ragi dur<strong>in</strong>g Storage at Farm Level– By Type <strong>and</strong> Mode <strong>of</strong> StorageLosses <strong>of</strong> Ragi dur<strong>in</strong>g Storage at Farm Level– By Causes <strong>of</strong> LossesTotal Post Harvest Losses <strong>of</strong> Ragi atProducer’s Level – Small Category CultivatorsTotal Post Harvest Losses <strong>of</strong> Ragi atProducer’s Level – Medium Category CultivatorsTotal Post Harvest Losses <strong>of</strong> Ragi atProducer’s Level – Large Category CultivatorsTotal Post Harvest Losses <strong>of</strong> Ragi atProducer’s Level – All Categories <strong>of</strong> CultivatorsTotal Sale <strong>of</strong> Ragi – Quarterwise – SmallCategory Cultivators
XXXXXXXXIXXXXIIXXXXIIIXXXXIVXXXXVXXXXVIXXXXVIIXXXXVIIIXXXXIXLLILIILIIILIVLVLVILVIILVIIILIXLXTotal Sale <strong>of</strong> Ragi – Quarterwise – MediumCategory CultivatorsTotal Sale <strong>of</strong> Ragi – Quarterwise – LargeCategory CultivatorsTotal Sale <strong>of</strong> Ragi – Quarterwise – AllCategories <strong>of</strong> CultivatorsSale <strong>of</strong> Ragi – Agencywise – SmallCategory CultivatorsSale <strong>of</strong> Ragi – Agencywise – MediumCategory CultivatorsSale <strong>of</strong> Ragi – Agencywise – LargeCategory CultivatorsSale <strong>of</strong> Ragi – Agencywise – AllCategories CultivatorsSale <strong>of</strong> Ragi – With<strong>in</strong> Village – SmallCategory CultivatorsSale <strong>of</strong> Ragi – With<strong>in</strong> Village – MediumCategory CultivatorsSale <strong>of</strong> Ragi – With<strong>in</strong> Village – LargeCategory CultivatorsSale <strong>of</strong> Ragi – With<strong>in</strong> Village – AllCategories CultivatorsSale <strong>of</strong> Ragi – Outside the Village – SmallCategory CultivatorsSale <strong>of</strong> Ragi – Outside the Village – MediumCategory CultivatorsSale <strong>of</strong> Ragi – Outside the Village – LargeCategory CultivatorsSale <strong>of</strong> Ragi – Outside the Village – AllCategories <strong>of</strong> CultivatorsMarketable Surplus – Small Category CultivatorsMarketable Surplus – Medium Category CultivatorsMarketable Surplus – Large Category CultivatorsMarketable Surplus – All Categories <strong>of</strong> CultivatorsMarketed Surplus Vis-à-vis Marketable Surplus – SmallCategory CultivatorsMarketed Surplus Vis-à-vis Marketable Surplus – MediumCategory Cultivators
LXILXIILXIIIMarketed Surplus Vis-à-vis Marketable Surplus – LargeCategory CultivatorsMarketed Surplus Vis-à-vis Marketable Surplus – AllCategories <strong>of</strong> CultivatorsSt<strong>and</strong>ard Errors for Estimates <strong>of</strong> Marketable Surplus,Marketed Surplus <strong>and</strong> Post-<strong>harvest</strong> Losses <strong>of</strong> Ragi
LIST OF TABLESTable No.Content1. Distribution <strong>of</strong> Sample Villages Grow<strong>in</strong>g Ragi2. Average Area Under Cultivation <strong>of</strong> Ragi <strong>and</strong> Percentagesthere<strong>of</strong> (Average : 1996-97, 1997-98 & 1998-99)3. Area Under Ragi Irrigated, Unirrigated <strong>and</strong> Total(Category-wise) (Average : 1996-97, 1997-98 & 1998-99)4. State-wise Area Under Ragi Irrigated /Unirrigated (Average : 1996-97, 1997-98 & 1998-99)5. Area Under Ragi : High Yield<strong>in</strong>g Varieties (HYV)<strong>and</strong> Traditional Varieties (TV)- (Average : 1996-97,1997-98 & 1998-99)6. State-wise distribution <strong>of</strong> Area under HighYield<strong>in</strong>g Varieties (HYV) <strong>and</strong> Traditional Varieties(Average : 1996-97, 1997-98 & 1998-99)7. Production <strong>of</strong> Ragi – Irrigated & Unirrigated8. State-wise break up <strong>of</strong> Production <strong>of</strong> Ragi :Irrigated / Unirrigated (Average : 1996-97, 1997-98 & 1998-99)9. Production <strong>of</strong> Ragi : High Yield<strong>in</strong>g Varieties &Traditional Varieties10. State-wise breakup <strong>of</strong> Production <strong>of</strong> Ragi: High Yield<strong>in</strong>g Varieties (HYV) <strong>and</strong> TraditionalVarieties (TV) (Average : 1996-97, 1997-98 & 1998-99)11. Retention <strong>of</strong> Ragi for Consumption by theFarm Family on All India Basis12. State-wise Retention <strong>of</strong> Ragi (All Categories)for Farm Family Consumption(Average : 1996-97, 1997-98 & 1998-99)13. Retention by the Farm Family for Consumptionby Permanent Labour <strong>and</strong> Temporary Labour engagedon the Farm (Average : 1996-97, 1997-98 & 1998-99)14. State-wise Retention by the Farm Family forConsumption by the Permanent Labour <strong>and</strong> TemporaryLabour employed on the Farm (All Categories)(Average: 1996-97, 1997-98 & 1998-99)
15. Total Retention <strong>of</strong> Ragi for Consumption atFarm Level16. Total Retention <strong>of</strong> Ragi for Consumption atFarm Level (Average: 1996-97, 1997-98 <strong>and</strong> 1998-99)17. Retention <strong>of</strong> Ragi for Seed Purpose(Average: 1996-97, 1997-98 <strong>and</strong> 1998-99)18. Retention <strong>of</strong> Ragi for Seed Purpose: State-wiseBreak-up (Average: 1996-97, 1997-98 <strong>and</strong> 1998-99)19. Retention <strong>of</strong> Ragi for Seed Purpose:Irrigated Crops <strong>and</strong> Unirrigated Crop(Average: 1996-97, 1997-98 <strong>and</strong> 1998-99)20. Retention <strong>of</strong> Ragi for Animal Feed(Average: 1996-97, 1997-98 <strong>and</strong> 1998-99)21. Retention <strong>of</strong> Ragi for Animal Feed: State-wiseBreak-up (Average: 1996-97, 1997-98 <strong>and</strong> 1998-99)22. Utilisation <strong>of</strong> Ragi towards Payments <strong>in</strong>Cash from Sale Proceeds <strong>of</strong> Current Year’s Crop(Average: 1996-97, 1997-98 <strong>and</strong> 1998-99)23. Utilisation <strong>of</strong> Ragi towards Payment <strong>in</strong> Cash fromSale Proceeds <strong>of</strong> Previous Years Crop(Average: 1996-97, 1997-98 <strong>and</strong> 1998-99)24. Utilisation <strong>of</strong> Ragi for Payment <strong>in</strong> K<strong>in</strong>d for DifferentPurposes (Average: 1996-97, 1997-98 <strong>and</strong> 1998-99)25. State-wise Break-up <strong>of</strong> Utilisation <strong>of</strong>Ragi towards Payments <strong>in</strong> K<strong>in</strong>d(Average: 1996-97, 1997-98 <strong>and</strong> 1998-99)26. Losses <strong>of</strong> Ragi at Producers Level(Average: 1996-97, 1997-98 <strong>and</strong> 1998-99)27. Sales <strong>of</strong> Ragi(Average: 1996-97, 1997-98 <strong>and</strong> 1998-99)28. Sales <strong>of</strong> Various Agencies(Average: 1996-97, 1997-98 <strong>and</strong> 1998-99)29. Sales <strong>of</strong> Ragi With<strong>in</strong> Villages(Average: 1996-97, 1997-98 <strong>and</strong> 1998-99)30. Sales <strong>of</strong> Ragi Outside the Village(Average: 1996-97, 1997-98 <strong>and</strong> 1998-99)31. State-wise breakup <strong>of</strong> Total Sales <strong>of</strong> Ragi(Average: 1996-97, 1997-98 <strong>and</strong> 1998-99)
32. Contribution to the Marketed Surplus <strong>of</strong> Ragi byDifferent States (Average: 1996-97, 1997-98 <strong>and</strong> 1998-99)33. Total Farm Family Requirement <strong>and</strong>Marketable Surplus34. Marketable Surplus <strong>of</strong> Ragi35. State-wise breakup <strong>of</strong> Estimates <strong>of</strong> Production FarmFamily Requirement, Marketable Surplus <strong>and</strong>Marketed Surplus <strong>of</strong> Ragi
PREFACEThe Directorate <strong>of</strong> Market<strong>in</strong>g & Inspection (DMI), ever s<strong>in</strong>ce it’s <strong>in</strong>ception <strong>in</strong> the year 1935, hasbeen engaged <strong>in</strong> conduct<strong>in</strong>g surveys on the market<strong>in</strong>g <strong>of</strong> agricultural commodities. The available data <strong>of</strong><strong>marketable</strong> <strong>surplus</strong> based on the surveys conducted dur<strong>in</strong>g earlier decades had become obsolete.Therefore, a nation wide survey was <strong>in</strong>itiated by the DMI for Estimation <strong>of</strong> Marketable Surplus &Post Harvest Losses <strong>of</strong> important cereals <strong>in</strong> the year 1972. The survey <strong>in</strong>cluded important cereals,namely, Paddy, Wheat, Jowar, Bajra <strong>and</strong> Maize. However, this data also became obsolete over a period <strong>of</strong>time <strong>and</strong> persistent dem<strong>and</strong> from user organisations cont<strong>in</strong>ued. Hence, a fresh nation wide survey was<strong>in</strong>itiated for Estimation <strong>of</strong> Marketable Surplus & Post Harvest Losses <strong>of</strong> selected foodgra<strong>in</strong>s viz.,Paddy, Wheat, Jowar, Bajra, Maize, Ragi <strong>and</strong> Barley amongst cereals <strong>and</strong> Arhar, Green Gram,Black Gram, Gram <strong>and</strong> Lentil amongst pulses. The survey was conducted over a period <strong>of</strong> three years,i.e; 1996-97, 1997-98 <strong>and</strong> 1998-99. The sampl<strong>in</strong>g frame <strong>in</strong>cluded 25 States, 100 selected districts <strong>and</strong>15,000-cultivator households, selected from these districts. The selection <strong>of</strong> States, districts <strong>and</strong> cultivatorhouseholds were done <strong>in</strong> accordance with the stratified multi stage r<strong>and</strong>om sampl<strong>in</strong>g design,recommended by the Technical Committee <strong>in</strong> consultation with the Indian Agriculture Statistical ResearchInstitute (IASRI), New Delhi.The data generated dur<strong>in</strong>g the survey provided valuable <strong>in</strong>formation on various aspects <strong>of</strong> villagepr<strong>of</strong>ile <strong>and</strong> cultivator households, crops grown, retention for different purposes, marketed <strong>surplus</strong> <strong>and</strong><strong>marketable</strong> <strong>surplus</strong>, <strong>post</strong> <strong>harvest</strong> <strong>losses</strong> at producer’s level etc.The data generated is volum<strong>in</strong>ous. The facility <strong>of</strong> computer data entry helped <strong>in</strong> consolidat<strong>in</strong>gdata from 7.23 lakhs schedules <strong>in</strong> a short span <strong>of</strong> time. This volume provides estimates based on the samplesurvey <strong>in</strong> respect <strong>of</strong> production <strong>of</strong> Ragi, retention by the farm-family household for various purposes, <strong>post</strong><strong>harvest</strong> <strong>losses</strong> at producer’s level, marketed <strong>surplus</strong> <strong>and</strong> <strong>marketable</strong> <strong>surplus</strong> etc.I place on record my s<strong>in</strong>cere thanks to the members <strong>of</strong> the Technical Committee, particularly Dr.A.K. Srivastava, Jt. Director <strong>and</strong> Dr. H.V.L. Bathla, Pr<strong>in</strong>cipal Scientist & Head, Division <strong>of</strong> SampleSurvey, C, New Delhi, for render<strong>in</strong>g valuable guidance from time to time. I also thank Dr. P.Kumar,Pr<strong>of</strong>essor & Head, Division <strong>of</strong> Agricultural Economics, Indian Agricultural Research Institute, New Delhifor his guidance.I thank the National Informatics Centre (NIC), Western Region, Department <strong>of</strong> InformationTechnology (M<strong>in</strong>istry <strong>of</strong> Communication & Information Technology), Government <strong>of</strong> India, <strong>and</strong> especiallythe <strong>of</strong>fice <strong>of</strong> NIC at Nagpur, which provided valuable s<strong>of</strong>tware support <strong>in</strong> data entry <strong>and</strong> analysis. I alsothank the Regional Computer Centre, Calcutta for provid<strong>in</strong>g computer data entry service.The field survey <strong>of</strong> such a volum<strong>in</strong>ous nature required s<strong>in</strong>cere <strong>and</strong> dedicated efforts by the <strong>of</strong>ficers<strong>and</strong> staff <strong>of</strong> the D.M.I. <strong>and</strong> <strong>of</strong>ficers <strong>and</strong> staff <strong>of</strong> the Designated State Agencies. I place on record my deepappreciation <strong>of</strong> their efforts made <strong>in</strong> this survey.I, also place on record deep appreciation <strong>of</strong> s<strong>in</strong>cere efforts <strong>of</strong> the Chief Project Coord<strong>in</strong>ators <strong>and</strong>their team <strong>of</strong> <strong>of</strong>ficers at Branch Head Office <strong>in</strong> manag<strong>in</strong>g the task <strong>of</strong> such gigantic nature.Last but not the least, I place on record my deep appreciation <strong>of</strong> the help <strong>and</strong> cooperation renderedby the selected cultivator households without whose enthusiasm, support <strong>and</strong> responses dur<strong>in</strong>g the course<strong>of</strong> survey, the project would have not been possible.The Government <strong>of</strong> India should not be regarded as assum<strong>in</strong>g responsibility for any <strong>of</strong> thestatements, conta<strong>in</strong>ed <strong>in</strong> the reportFaridabadDated, the:(P.K. Agarwal)Agricultural Market<strong>in</strong>g Adviserto the Government <strong>of</strong> India.
SUMMARY1. In view <strong>of</strong> the persistent dem<strong>and</strong> from the user organisations <strong>and</strong> after <strong>in</strong>ter-departmentalconsultations, 47 agricultural commodities were identified for undertak<strong>in</strong>g the national surveys forestimation <strong>of</strong> <strong>marketable</strong> <strong>surplus</strong> <strong>and</strong> <strong>post</strong> <strong>harvest</strong> <strong>losses</strong>.2. To start with, 12 commodities namely Paddy, Jowar, Wheat, Bajra, Maize, Barley, Ragi, Red Gram,Green Gram, Black Gram, Gram <strong>and</strong> Lentil (Masoor) were covered3 The study aims at provid<strong>in</strong>g reliable estimates <strong>of</strong> <strong>marketable</strong> <strong>surplus</strong> <strong>and</strong> <strong>post</strong>-<strong>harvest</strong> <strong>losses</strong> atproducer’s level both at National level <strong>and</strong> State level.4 The survey covered 100 districts, selected from 25 states, <strong>in</strong> accordance with the methodologyapproved by the Technical Committee, <strong>in</strong> consultation with the Indian Agriculture Statistical ResearchInstitute (IASRI), New Delhi. From 100 selected districts, 1500 villages were selected. Out <strong>of</strong> 1500villages selected, 279 villages were grow<strong>in</strong>g Ragi. In other words, 18.60 % <strong>of</strong> the villages selectedwere Ragi-grow<strong>in</strong>g villages.5 The total area under Ragi was estimated at 1587.15 thous<strong>and</strong> hectares. Out <strong>of</strong> this, an average <strong>of</strong>211.10 thous<strong>and</strong> hectares i.e., nearly 13.30 % was grown as irrigated. The State-wise distribution <strong>of</strong>area under Ragi, shows that <strong>in</strong> states like Tamil Nadu <strong>and</strong> Gujarat, Ragi was grown ma<strong>in</strong>ly as irrigatedcrop.(Para-4.1.1)6 The coverage <strong>of</strong> the High Yield<strong>in</strong>g Varieties was <strong>of</strong> the order <strong>of</strong> 883.11 thous<strong>and</strong> hectares i.e., 55.64%. This is a reflection <strong>of</strong> the successful efforts made by the M<strong>in</strong>istry <strong>of</strong> Agriculture forpromotion <strong>of</strong> High Yield<strong>in</strong>g Varieties.(Para-4.2.1)7 The production <strong>of</strong> Ragi was estimated at 2282.84 thous<strong>and</strong> tonnes, out <strong>of</strong> which the contribution <strong>of</strong>irrigated Ragi was 469.81 thous<strong>and</strong> tonnes i.e., 20.58 %. The contribution <strong>of</strong> High Yield<strong>in</strong>g Varieties<strong>in</strong> production was estimated at 1614.53 thous<strong>and</strong> tonnes or 70.73 %. This further signifies the need forpromotion <strong>of</strong> HYV to meet the competitive global market<strong>in</strong>g environment through competitiveefficiency.(Para-4.3, 4.4)8 The total requirement <strong>of</strong> Ragi for farm-family consumption i.e., retention for consumption at farmerlevel, was estimated at 1384.57 thous<strong>and</strong> tonnes, which was 60.65 % <strong>of</strong> the estimated production.(Para-5.4.1)9 The estimates <strong>of</strong> retention for various purposes <strong>and</strong> purchases <strong>of</strong> Ragi to meet the total requirement <strong>of</strong>farm family were as under :i) For farm-family consumption - 57.04 % (Para-5.2.1)ii) For consumption by permanent - 3.61 % (Para-5.3.2)labour <strong>and</strong> temporary labour.iii) Estimated purchases for - 0.00 % (Para-5.5)Consumption.iv) For seed purpose - 2.49 % (Para-5.7.3)v) For animal feed - 0.06 % (Para-5.8.1)vi) For payment <strong>in</strong> k<strong>in</strong>d - 3.64 % (Para-5.11.3)10 The total <strong>post</strong>-<strong>harvest</strong> <strong>losses</strong> <strong>of</strong> Ragi at producers’ level (<strong>in</strong> transport from field to thresh<strong>in</strong>g floor,thresh<strong>in</strong>g <strong>and</strong> w<strong>in</strong>now<strong>in</strong>g, transportation <strong>and</strong> farm storage) were estimated at 3.81 percent <strong>of</strong> the totalproduction
(Para-6.1.1)11 The total marketed <strong>surplus</strong> was estimated to be 28.62 percent. The share <strong>of</strong> direct sales by theproducers to consumers was 5.39 percent, to co-operatives, it was 3.46 percent, <strong>and</strong> to FCI, it was nil.It is a matter <strong>of</strong> <strong>in</strong>trospection for the co-operative sector <strong>and</strong> FCI to evaluate their role <strong>in</strong> market<strong>in</strong>g <strong>of</strong>Ragi for the benefit <strong>of</strong> the farm<strong>in</strong>g community. It is also imperative to open up avenues throughmarket<strong>in</strong>g reforms for promot<strong>in</strong>g direct sales by the producer to the target group <strong>and</strong> have improvedshare <strong>in</strong> consumers rupee.(Para-7.3)(Para-8.3)12 Out <strong>of</strong> the total sales, 57.97 percent sales were with<strong>in</strong> villages. This clearly established the need fordevelopment <strong>of</strong> <strong>in</strong>frastructure <strong>and</strong> facilities at the village level to serve the <strong>in</strong>terests <strong>of</strong> the farmhouseholds. It is also necessary to shift the focus <strong>of</strong> development from the urban market centres(largely developed) to the rural market centres.(Para-7.5)13 The present survey revealed that the <strong>marketable</strong> <strong>surplus</strong> stood at 653.34 thous<strong>and</strong> tonnes i.e., 28.62 percent<strong>and</strong> the total farm family requirement <strong>in</strong>clud<strong>in</strong>g the <strong>losses</strong> at farm level was 1612.70 thous<strong>and</strong> tonnes i.e.,70.64 percent <strong>of</strong> the total production.(Para-8.3)14 The earlier surveys showed that the average number <strong>of</strong> family members per household was 6.26,whereas the present survey showed that the average number <strong>of</strong> family members per household was6.45.(Para-8.6)
CHAPTER – IINTRODUCTION1.1 The Directorate <strong>of</strong> Market<strong>in</strong>g & Inspection (DMI), has been conduct<strong>in</strong>g surveys on the market<strong>in</strong>g <strong>of</strong>agricultural commodities s<strong>in</strong>ce its <strong>in</strong>ception <strong>in</strong> the year 1935. The methodology, adopted for thesesurveys was based on personnel <strong>in</strong>quiries from the most knowledgeable functionaries engaged <strong>in</strong>different aspects <strong>of</strong> market<strong>in</strong>g <strong>in</strong> different markets. It was also supplemented with questionnaires,where it was feasible to obta<strong>in</strong> statistical <strong>in</strong>formation. Dur<strong>in</strong>g that period <strong>of</strong> time, much <strong>of</strong> statisticalexpertise had not been developed <strong>in</strong> the country nor detailed factual <strong>in</strong>formation was available on theprocedures adopted <strong>in</strong> different parts <strong>of</strong> the country for market<strong>in</strong>g <strong>of</strong> different agriculturalcommodities.1.2 These surveys provided the basic <strong>in</strong>formation on market<strong>in</strong>g systems <strong>and</strong> practices for differentagricultural commodities. However, it was felt necessary to have precise estimates <strong>of</strong> <strong>marketable</strong><strong>surplus</strong> & <strong>post</strong>-<strong>harvest</strong> <strong>losses</strong> <strong>of</strong> foodgra<strong>in</strong>s <strong>in</strong> the context <strong>of</strong> plann<strong>in</strong>g for agriculturaldevelopment, distribution programmes <strong>and</strong> pric<strong>in</strong>g policies. S<strong>in</strong>ce the available data based onsurveys conducted by the DMI had become obsolete, a series <strong>of</strong> national surveys on “MarketableSurplus & Post-Harvest Losses” <strong>of</strong> selected agricultural commodities was taken up. The surveystarted with one commodity (Paddy) <strong>in</strong> the year 1972-73, followed by the surveys on Wheat, Jowar,Bajra <strong>and</strong> Maize dur<strong>in</strong>g subsequent years. These surveys adopted the improved modern statisticaltechniques then available. With time, these data also became obsolete. In view <strong>of</strong> the persistentdem<strong>and</strong> from the user organisations, <strong>and</strong> after <strong>in</strong>ter-departmental consultations, 47 agriculturecommodities were selected for undertak<strong>in</strong>g surveys for <strong>marketable</strong> <strong>surplus</strong> & <strong>post</strong>-<strong>harvest</strong> <strong>losses</strong>. Tostart with, the follow<strong>in</strong>g12 foodgra<strong>in</strong>s were selected for these surveys.CEREALSPULSESPaddyJowarWheatBajraMaizeBarleyRagiRed GramGreen GramBlack GramBengal GramLentil (Masoor)1.3 OBJECTIVES OF THE STUDYThe ma<strong>in</strong> objectives <strong>of</strong> the studies are:➔➔➔To revise <strong>and</strong> up-date the estimates <strong>of</strong> <strong>marketable</strong> <strong>surplus</strong> <strong>of</strong> foodgra<strong>in</strong>s;To compile the latest data on farm retention for consumption, seed, feed, wages <strong>and</strong> otherpayments <strong>in</strong> k<strong>in</strong>d, etc., <strong>and</strong>To estimate the <strong>post</strong>-<strong>harvest</strong> <strong>losses</strong> at the producer’s level.The study aims at provid<strong>in</strong>g reliable estimates <strong>of</strong> <strong>marketable</strong> <strong>surplus</strong>, farm retention <strong>and</strong> <strong>post</strong>-<strong>harvest</strong><strong>losses</strong> at producers’ level, state-wise as well as for the country as a whole.
CHAPTER-IISAMPLING DESIGN AND COVERAGE2.1 SAMPLING DESIGN :The Technical Committee recommended stratified multi-stage r<strong>and</strong>om sampl<strong>in</strong>g design for this survey.The selection <strong>of</strong> districts was done on aggregate method <strong>of</strong> production for all crops <strong>of</strong> foodgra<strong>in</strong>s.Accord<strong>in</strong>gly, selection <strong>of</strong> districts was done @ 20% <strong>of</strong> total number <strong>of</strong> districts <strong>of</strong> each state, <strong>in</strong>stead <strong>of</strong>tak<strong>in</strong>g 20% at the National level <strong>and</strong> allocat<strong>in</strong>g them among the states on the basis <strong>of</strong> their size <strong>and</strong>production, as followed earlier by the DMI, for ensur<strong>in</strong>g reliable estimates <strong>of</strong> <strong>marketable</strong> <strong>surplus</strong>, bothat the State <strong>and</strong> National level. The sampl<strong>in</strong>g design consisted <strong>of</strong>:i) In each state, 20% <strong>of</strong> the total number <strong>of</strong> districts were selected for the survey.ii) In each selected district, 15 (Fifteen) villages were selected after group<strong>in</strong>g <strong>in</strong>to threestratums, based on total area cultivated under foodgra<strong>in</strong>s.iii) In each selected village, 10 (Ten) cultivator households were selected afterclassify<strong>in</strong>g them <strong>in</strong>to three categories viz., Small, Medium <strong>and</strong> Large.Accord<strong>in</strong>gly, the total number <strong>of</strong> districts selected on all India basis worked out to 100 (One hundred),the total number <strong>of</strong> villages to be surveyed worked out to 1500 (100 districts X 15 villages) <strong>and</strong> 15000cultivator households (1500 villages X 10 cultivator households), from whom the data were collected <strong>in</strong>prescribed schedules on quarterly basis over a period <strong>of</strong> three years <strong>of</strong> survey.2.1.1 METHOD OF SAMPLINGSELECTION OF SAMPLE DISTRICTS:As stated earlier, <strong>in</strong> accordance with the procedure <strong>of</strong> sampl<strong>in</strong>g approved by the Technical Committee,<strong>in</strong> consultation with the Director, IASRI, New Delhi, Selection <strong>of</strong> districts was done on the basis <strong>of</strong>aggregate method <strong>of</strong> production for all crops <strong>of</strong> foodgra<strong>in</strong>s. The selection <strong>of</strong> districts was done @20% <strong>of</strong> the total number <strong>of</strong> districts <strong>of</strong> each state, <strong>in</strong>stead <strong>of</strong> tak<strong>in</strong>g 20% at the National level <strong>and</strong>allocat<strong>in</strong>g them among the States on the basis <strong>of</strong> their size <strong>of</strong> production, as was followed by the D.M.I.earlier. This was done to ensure reliable estimates <strong>of</strong> <strong>marketable</strong> <strong>surplus</strong> etc., both at the State <strong>and</strong>National level. All the districts, <strong>in</strong> each state were classified <strong>in</strong>to three categories, namely ‘High’,‘Medium’ <strong>and</strong> ‘Low’ production, based on annual production <strong>of</strong> foodgra<strong>in</strong> crops for three years (1991-92, 1992-93 & 1993-94). The data on annual production <strong>of</strong> foodgra<strong>in</strong>s was obta<strong>in</strong>ed from the StateDepartments. About 20% <strong>of</strong> the total districts <strong>in</strong> each state were selected, after clubb<strong>in</strong>g some States<strong>and</strong> Union Territories, so as to ensure selection <strong>of</strong> two districts from each category <strong>and</strong> atleast sixdistricts from each state. S<strong>in</strong>ce the number <strong>of</strong> districts <strong>in</strong> <strong>in</strong>dividual States ranged between 2 <strong>in</strong> Goa <strong>and</strong>63 <strong>in</strong> U.P., it posed a problem <strong>in</strong> respect <strong>of</strong> states hav<strong>in</strong>g less than 30 districts.i) States hav<strong>in</strong>g 30 or more districts:Bihar (42), Uttar Pradesh (63), Maharashtra (31) <strong>and</strong> Madhya Pradesh (45).ii) States hav<strong>in</strong>g more than 6 but less than 30 districts:Andhra Pradesh (23), Arunachal Pradesh (11), Assam (23), Gujarat (14), Haryana (16),Himachal Pradesh (12), J & K (14), Karnataka (20), Kerala (14), Manipur (8), Nagal<strong>and</strong> (7),Orissa (13), Punjab (12), Rajasthan (27), Tamil Nadu (22) <strong>and</strong> West Bengal (17).iii) States/Union Territories (U.Ts.) hav<strong>in</strong>g 6 or less than 6 districts:Goa (2), Meghalaya (5), Mizoram (3), Sikkim (4), Tripura (3), Andaman & Nicobar (2),Pondicherry (4), Daman & Diu (2), Delhi (1), Ch<strong>and</strong>igarh (1), Lakshdweep (1) <strong>and</strong> DadraNagar Haveli (1).Therefore, clubb<strong>in</strong>g <strong>of</strong> some states <strong>and</strong> Union Territories was done to ensure selection <strong>of</strong> atleast twodistricts from each category. Accord<strong>in</strong>gly, 100 districts were selected for the survey on All Indiabasis.It may further be added here that while select<strong>in</strong>g the districts, it was ensured that these selecteddistricts contributed to nearly 20% <strong>of</strong> aggregate production <strong>of</strong> foodgra<strong>in</strong>s.
2.1.2 SELECTION OF SAMPLE VILLAGES:The Technical Committee <strong>in</strong> the 1 st meet<strong>in</strong>g had also suggested that while select<strong>in</strong>g the districts,different regions/agro-climatic zones <strong>in</strong> the states be taken <strong>in</strong>to consideration to the extentpossible. Incidentally, the list <strong>of</strong> 100 selected districts covered most <strong>of</strong> the agro-climatic zonesexcept ‘Western Dry Zone’ <strong>and</strong> ‘Isl<strong>and</strong> zone’.In each selected district, 15 (Fifteen) villages were selected after classify<strong>in</strong>g villages <strong>in</strong>to threestrata, viz., ‘High’, ‘Medium’, <strong>and</strong> ‘Low’, production. Keep<strong>in</strong>g <strong>in</strong> view the practical difficulties<strong>in</strong> obta<strong>in</strong><strong>in</strong>g foodgra<strong>in</strong> production data from <strong>in</strong>dividual villages, the Technical Committeerecommended that “Total area cultivated under foodgra<strong>in</strong>s” may be taken as basis for classify<strong>in</strong>gthe villages. Accord<strong>in</strong>gly, all the villages <strong>in</strong> the selected districts were arranged <strong>in</strong> descend<strong>in</strong>gorder <strong>of</strong> total gross or net area under foodgra<strong>in</strong>s <strong>and</strong> then divided <strong>in</strong>to three segments, eachaccount<strong>in</strong>g for one third <strong>of</strong> the total cultivated area under foodgra<strong>in</strong>s <strong>in</strong> the district. The villages<strong>in</strong> top segment <strong>of</strong> the list were placed <strong>in</strong> ‘High’ production stratum, those <strong>in</strong> the middle segment<strong>in</strong> ‘Medium’ production stratum, <strong>and</strong> the rema<strong>in</strong><strong>in</strong>g <strong>in</strong> ‘Low’ production stratum. Five villagesfrom each stratum were selected for survey by simple r<strong>and</strong>om sampl<strong>in</strong>g.2.1.3 SELECTION OF CULTIVATOR HOUSEHOLDS :2.2 COVERAGE:In each selected village, ten cultivator households were selected. All the cultivator households <strong>in</strong>the village were listed from the revenue records <strong>of</strong> the village. The cultivator households werearranged <strong>in</strong> descend<strong>in</strong>g order <strong>of</strong> area cultivated under foodgra<strong>in</strong>s <strong>and</strong> the list was divided<strong>in</strong>to three segments, each account<strong>in</strong>g for one third <strong>of</strong> the total area cultivated underfoodgra<strong>in</strong>s <strong>in</strong> the village. The cultivator households <strong>in</strong> the top segment <strong>of</strong> the list were placed <strong>in</strong>‘Large’ category, those <strong>in</strong> the middle segment ‘Medium’ category, <strong>and</strong> the rema<strong>in</strong><strong>in</strong>g <strong>in</strong> ‘Small’category. Four cultivator households from small category <strong>and</strong> three cultivator households eachfrom medium <strong>and</strong> large category were selected for survey by simple r<strong>and</strong>om sampl<strong>in</strong>g.2.2.1 The survey covered 100 districts selected from 25 states <strong>in</strong> accordance with the methodologyapproved by the Technical Committee. The distribution <strong>of</strong> sample villages, state-wise, categorywisereported grow<strong>in</strong>g Ragi dur<strong>in</strong>g the period <strong>of</strong> survey is presented <strong>in</strong> the follow<strong>in</strong>g table:S.No.TALBE NO. 1DISTRIBUTION OF SAMPLE VILLAGES GROWING RAGI(BASED ON DATA FOR 1993-94 <strong>and</strong> 1994-95)StateNo. <strong>of</strong>samplevillagesNo. <strong>of</strong>villagesgrow<strong>in</strong>gNo. <strong>of</strong> cultivator households grow<strong>in</strong>g RagiCategoryRagi Small Medium Large Total1 Andhra Pradesh 75 18 21 20 32 732 Arunachal Pradesh 30 0 0 0 0 03 Assam 75 0 0 0 0 04 Bihar 165 55 61 65 109 2355 Goa 15 0 0 0 0 06 Gujarat 60 14 17 17 31 657 Haryana 45 0 0 0 0 08 H.P. 45 16 21 21 28 709 Jammu & Kashmir 45 0 0 0 0 010 Karnataka 60 28 31 31 51 11311 Kerala 45 0 0 0 0 012 Madhya Pradesh 135 32 42 45 61 14813 Maharashtra 90 21 22 26 33 8114 Manipur 15 0 0 0 0 015 Meghalaya 15 0 0 0 0 016 Mizoram 15 0 0 0 0 017 Nagal<strong>and</strong> 15 0 0 0 0 018 Orissa 90 39 46 46 64 156
19 Punjab 45 0 0 0 0 020 Rajasthan 90 0 0 0 0 021 Sikkim 15 0 0 0 0 022 Tamil Nadu 75 21 0 0 0 023 Tripura 15 0 0 0 0 024 Uttar Pradesh 180 35 48 51 54 15325 West Bengal 45 0 0 0 0 0All India 1500 279 309 322 463 10942.2.2 It has been observed that out <strong>of</strong> 1500 villages selected, 279 villages were grow<strong>in</strong>g Ragi. In otherwords, 18.60% were Ragi-grow<strong>in</strong>g villages, selected <strong>in</strong> the sample.2.2.3 Average area under cultivation, average area under Ragi <strong>and</strong> percentages there<strong>of</strong> are furnished <strong>in</strong>Table No. 2TABLE NO. 2AVERAGE AREA UNDER CULTIVATION OF RAGIAND PERCENTAGES THEREOF IN SAMPLE VILLAGES(AVERAGE: 1996-97,1997-98 <strong>and</strong> 1998-99)S.No. State No. <strong>of</strong> samplevillagesAverage areaunder cultivation(<strong>in</strong> hectares)Average area under RagiArea Col. 5 as % <strong>of</strong>Col 41 2 3 4 5 61 Andhra Pradesh 75 544.79 1.62 0.302 Arunachal Pradesh 30 198.80 0.00 0.003 Assam 75 145.86 0.00 0.004 Bihar 165 270.22 3.69 1.375 Goa 15 163.42 0.00 0.006 Gujarat 60 471.74 0.35 0.077 Haryana 45 841.15 0.00 0.008 H.P. 45 106.15 1.22 1.159 Jammu & Kashmir 45 337.52 0.00 0.0010 Karnataka 60 492.72 45.74 9.2811 Kerala 45 998.56 0.00 0.0012 Madhya Pradesh 135 357.42 0.25 0.0713 Maharashtra 90 474.03 0.42 0.0914 Manipur 15 282.67 0.00 0.0015 Meghalaya 15 69.80 0.00 0.0016 Mizoram 15 141.09 0.00 0.0017 Nagal<strong>and</strong> 15 318.20 0.00 0.0018 Orissa 90 190.49 8.47 4.4519 Punjab 45 1065.79 0.00 0.0020 Rajasthan 90 483.29 0.00 0.0021 Sikkim 15 116.51 0.00 0.0022 Tamil Nadu 75 323.54 6.87 2.1223 Tripura 15 339.51 0.00 0.0024 Uttar Pradesh 180 215.97 1.34 0.6225 West Bengal 45 495.86 0.00 0.0026 All India 1500 379.60 3.43 0.90It has been observed that on an average, the area under Ragi <strong>in</strong> selected villages was 3.43 hectares. Inmajor Ragi grow<strong>in</strong>g states, the average area under Ragi <strong>in</strong> selected villages observed was 45.74 hectares<strong>in</strong> Karnataka <strong>and</strong> 8.47 hectares <strong>in</strong> Orissa.
CHAPTER – IIIESTIMATION PROCEDURELethdenote the h th stratum <strong>of</strong> district groups i.e. ‘High’, ‘Medium’ <strong>and</strong> ‘Low’ based on averageannual production <strong>of</strong> foodgra<strong>in</strong>s for the last three years,i denote the i th district selected from the h th district group,h′ denote the h′ th stratum <strong>of</strong> village groups i.e. ‘High’, ‘Medium’ <strong>and</strong> ‘Low’ on the basis <strong>of</strong>total area cultivated under foodgra<strong>in</strong>s,j denote the j th village selected from h’ th village group <strong>of</strong> i th selected district from h th district group,kdenote the k th category <strong>of</strong> cultivator i.e ‘Large’, ‘Medium’, or ‘Small’ on the basis <strong>of</strong> area underfoodgra<strong>in</strong>s <strong>in</strong> the village <strong>and</strong>l denote the l th cultivator selected from k th category <strong>of</strong> the j th selected village from h’ th village group <strong>of</strong> i thselected district from h th district group.Y hih’j k l = Value <strong>of</strong> character under study Y <strong>of</strong> (hih’jkl)-th cultivator.X hih’j k l = Area under the crop <strong>of</strong> the (hih’jkl)-th cultivator.m hih’j k = Number <strong>of</strong> cultivators selected <strong>in</strong> (hih’jk)-th category <strong>of</strong> cultivator.M hih’jk =Total number <strong>of</strong> cultivators <strong>in</strong> (hih’jk)-th category <strong>of</strong> cultivators.v hih’ = Number <strong>of</strong> selected villages from (hih’)-th village group.V hih ’ = Total number <strong>of</strong> villages <strong>in</strong> (hih’)-th village group.n hN hX h= Number <strong>of</strong> districts selected from the h-th district group.= Total number <strong>of</strong> districts <strong>in</strong> the h-th district group.= Total area under the crop <strong>in</strong> the h-th district group.The estimate <strong>of</strong> total for the k-th category <strong>of</strong> the cultivator can be obta<strong>in</strong>ed asHŶ hkYˆ k = ∑ ----h=lX hkXˆ hkWhere,N h n h H’ V hih’ v hih’ M hih’j k m hih’jkYˆ hk = ---- ∑ ∑ ---- ∑ ------ ∑ y hih’jklnh i=l h’=l v hih’ j=l m hih’j k l=lN h n h H’ V hih’ v hi h’ M hih’j k m hih’jkXˆ hk = --- ∑ ∑ --- ∑ ------- ∑ xhih’jkln h i=l h’=l v hih’ j=l m hih’j k l=lXˆ hkX hk = ------------- X h
H’∑k = lXˆ hkThe estimate <strong>of</strong> variance <strong>of</strong> Yˆ k isH N 2 h N h n h H′ V 2 hih′Vˆ (Yˆ k) = ∑ [ ----- (l-f nh ) A hk + ---- ∑ ∑ ----- (l – f vhih′ ) B hih′k +h=l n h n h i=l h′=l v hi h′N h n h H′ V hih′ v hih′ M 2 hi h′j k--- ∑ ∑ ----- ∑ -------- (l –f mhih′jk ) C hi h′j k ]n h i=l h′=l v hih′ j=i m hih′j kwhere,ln hA hk = ---- ∑ (Ŷ hik – Rˆ hk Xˆ hi k ) 2n h -l i=llv hih′B hih′ k = ------ ∑ [( Yˆ hi h′ j k – Rˆ h k Xˆ hi h′j k) – (Yˆ hi h′k – Rˆ hk Xˆ hi h′ k)] 2V hih′ -l j=l1 m hih′jkC hih′ jk = ----------- Σ [ ( y hih′j kl -- Rˆ hk x hi h′j k l ) – (Yˆ hi h′ j k – Rˆ hk Xˆ hi h′ j k ) ] 2m hih′jk –1 1=1Rˆ hk =Ŷ hkXˆ hkM hih′ j km hih′ j kYˆ hi h′ j k = ----------- Σ y hih′jk1m hih′ j k 1=1Yˆ hi h′j k = --------1 m hih′jkΣ y hih′ j k1m hih′ j k 1=1M hih′ j km hih′ j kXˆ hi h′j k = -------- Σ x hih′jk1m hih′ j k 1=11 m hih′j kXˆ hi h′j k = --------- Σ x hih′j k1m hih′jk 1=1m hih′j kf mhih′ j k = ------------------------M hih′ j k
V hih′ v hi h′Yˆ hi h’′k = -------- Σ Yˆ hi h′j kv hi h′ j=11 v hih′Yˆ hi h ′ k = -------v hi h′ j=1Σ Yˆ hi h′ j kV hih′ v hih′Xˆ hi h′ k = ---------v hi h′ j=1Σ Xˆ hi h′ j k1 v hih′Xˆ hi h′ k = ------- Σ Xˆ hi h′ j kv hih′ j=1v hih′f vhi h′ = -------V hih′H′Yˆ hi k = Σ Yˆ hi h′ kh′=1H′Xˆ hi k = Σ Xˆ hi h′ kh′=1The estimates <strong>of</strong> total <strong>of</strong> Y pooled over all the categories <strong>of</strong> farmers isKYˆ = Σ Yˆ kk=1<strong>and</strong> estimate <strong>of</strong> variance <strong>of</strong> Ŷ isKVˆ (Yˆ ) = Σ Vˆ (Yˆ k)k=1
CHAPTER - IVAREA AND PRODUCTION OF RAGI4.1 AREA UNDER RAGI: IRRIGATED & UNIRRIGATED.4.1.1 The state-wise estimated annual average area under Ragi for the year1996-97 to 1998-99 with break-up <strong>of</strong>irrigated <strong>and</strong> unirrigated <strong>and</strong> category <strong>of</strong> cultivators are given <strong>in</strong> Annexure I. The overall summary <strong>of</strong> thesame is presented <strong>in</strong> the follow<strong>in</strong>g table.TABLE NO. 3AREA UNDER RAGI IRRIGATED, UNIRRIGATED AND TOTAL RAGI(CATEGORYWISE), (AVERAGE 1996-97,1997-98 <strong>and</strong> 1998-99)(‘000 hectares)CategoryArea SownIrrigated Unirrigated Total(1) (2) (3) (4)Small 87.01(14.39)(41.22)517.60(85.61)(37.61)604.61(100.00)(38.09)Medium 56.56(11.89)(26.79)419.11(88.11)(30.46)475.67(100.00)(29.97)Large 67.53 (13.32)439.34(86.68) 506.87(100.00)(31.99)Total 211.10(13.30)(100.00)(31.93)1376.05(86.70)(100.00)(The figures <strong>in</strong> parenthesis are <strong>of</strong> the percentage to the total <strong>of</strong> the column/row)(31.94)1587.15(100.00)(100.00)4.1.2 It has been observed that out <strong>of</strong> total estimated area <strong>of</strong> 1587.15 thous<strong>and</strong> hectares, under Ragi <strong>in</strong> thecountry, small category <strong>of</strong> cultivators contributed 604.61 thous<strong>and</strong> hectares i.e., 38.09 percent,medium category cultivators contributed 475.67 thous<strong>and</strong> hectares i.e., 29.97 percent <strong>and</strong> largecategory <strong>of</strong> cultivators contributed 506.87 thous<strong>and</strong> hectares i.e., 31.94 percent.4.1.3 Category-wise analysis showed that <strong>in</strong> small category, the share <strong>of</strong> irrigated area was 41.22 percent,<strong>in</strong> medium category, it was 26.79 percent, <strong>and</strong> <strong>in</strong> large category, it was 31.99 percent.4.1.4 The statewise distribution <strong>of</strong> area under ‘Irrigation <strong>and</strong> Unirrigated’, is given <strong>in</strong> table No. 4:TABLE NO. 4STATE-WISE AREA UNDER RAGI (IRRIGATED/UNIRRIGATED)(AVERAGE 1996-97, 97-98 <strong>and</strong> 98-99).(‘000 hectares)S No Name <strong>of</strong> stateAll categoriesIrrigated Unirrigated Totalarea1 23 4 5Area % Area % Area %1 Andhra Pradesh 0.00 0.00 133.66 9.71 133.66 8.422 Arunachal Pradesh 0.00 0.00 0.00 0.00 0.00 0.003 Assam 0.00 0.00 0.00 0.00 0.00 0.004 Bihar 7.08 3.35 62.74 4.56 69.82 4.405 Goa 0.00 0.00 0.00 0.00 0.00 0.006 Gujarat 19.67 9.32 0.00 0.00 19.67 1.247 Haryana 0.00 0.00 0.00 0.00 0.00 0.008 Himachal Pradesh 0.00 0.00 5.83 0.42 5.83 0.379 Jammu <strong>and</strong> Kashmir 0.00 0.00 0.00 0.00 0.00 0.0010 Karnataka 81.10 38.42 741.38 53.88 822.48 51.82
11 Kerala 0.00 0.00 0.00 0.00 0.00 0.0012 Madhya Pradesh 0.00 0.00 12.14 0.88 12.14 0.7613 Maharashtra 0.00 0.00 154.30 11.21 154.30 9.7214 Manipur 0.00 0.00 0.00 0.00 0.00 0.0015 Meghalaya 0.00 0.00 0.00 0.00 0.00 0.0016 Mizoram 0.00 0.00 0.00 0.00 0.00 0.0017 Nagal<strong>and</strong> 0.00 0.00 0.00 0.00 0.00 0.0018 Orissa 0.00 0.00 82.40 5.99 82.40 5.1919 Punjab 0.00 0.00 0.00 0.00 0.00 0.0020 Rajasthan 0.00 0.00 0.00 0.00 0.00 0.0021 Sikkim 0.00 0.00 0.00 0.00 0.00 0.0022 Tamil Nadu 88.68 42.01 55.72 4.06 144.40 9.1023 Tripura 0.00 0.00 0.00 0.00 0.00 0.0024 Uttar Pradesh 14.57 6.90 127.88 9.29 142.45 8.9825 West Bengal 0.00 0.00 0.00 0.00 0.00 0.0026 ALL INDIA 211.10 100.00 1376.05 100.00 1587.15 100.004.1.5 Karnataka occupied maximum area under Ragi (51.82%) followed by Maharashtra (9.72), Tamil Nadu(9.10%), Uttar Pradesh (8.98%) <strong>and</strong> Andhra Pradesh (8.42%) etc. In states like Gujarat <strong>and</strong> Tamil Nadu,Ragi was grown ma<strong>in</strong>ly as irrigated crop.4.2 AREA UNDER RAGI: HIGH YIELDING VARIETIES AND TRADITIONAL VARIETIES.4.2.1 The estimate <strong>of</strong> area, under High Yield<strong>in</strong>g Varieties <strong>and</strong> Traditional Varieties, are furnished <strong>in</strong> Annexure II<strong>and</strong> summarised <strong>in</strong> Table No. 5.TABLE NO. 5AREA UNDER RAGI: HIGH YIELDING VARIETIES (HYV)AND TRADITIONAL VARIETIES (TV)(AVERAGE 1996-97,1997-98 <strong>and</strong> 1998-99).(‘000 hectares)CategoryArea sownHYV TV Total(1) (2) (3) (4)Small 371.24(61.40)(42.04)233.37(38.60)(33.15)604.61(100.00)(38.09)Medium 263.95(55.49)(29.89)211.72(44.51)(30.07)475.67(100.00)(29.97)Large 247.92(48.91)258.95(51.09)506.87(100.00)(28.07)Total 883.11(55.64)(100.00)(36.78)704.04(44.36)(100.00)(The figures <strong>in</strong> parenthes are percentage to the total <strong>of</strong> the column/row)(31.94)1587.15(100.00)(100.00)4.2.2 It has been observed that the coverage <strong>of</strong> high yield<strong>in</strong>g varieties <strong>of</strong> Ragi was <strong>of</strong> the order <strong>of</strong> 883.11thous<strong>and</strong> hectares or 55.64 percent <strong>of</strong> the total area under Ragi. The coverage <strong>of</strong> traditional varieties was704.04 thous<strong>and</strong> hectares or 44.36 percent. This is a reflection <strong>of</strong> the efforts for promotion <strong>of</strong> highyield<strong>in</strong>g varieties by the M<strong>in</strong>istry <strong>of</strong> Agriculture.4.2.3 The State-wise distribution <strong>of</strong> area under ‘High Yield<strong>in</strong>g Varieties’ <strong>and</strong> ‘Traditional Varieties’ is given <strong>in</strong>Table No. 6.
TABLE NO. 6STATE-WISE DISTRIBUTION OF AREA UNDER HIGH YIELDING VARIETIES (HYV)AND TRADITIONAL VARIETIES (T.V.).(AVERAGE 1996-97, 97-98 <strong>and</strong> 98-99).(‘000 hectares)S No Name <strong>of</strong> stateArea underHYV TV Total1 23 4 5Area % Area % Area %1 Andhra Pradesh 0.00 0.00 133.66 18.98 133.66 8.422 Arunachal Pradesh 0.00 0.00 0.00 0.00 0.00 0.003 Assam 0.00 0.00 0.00 0.00 0.00 0.004 Bihar 8.12 0.92 61.70 8.76 69.82 4.405 Goa 0.00 0.00 0.00 0.00 0.00 0.006 Gujarat 19.67 2.23 0.00 0.00 19.67 1.247 Haryana 0.00 0.00 0.00 0.00 0.00 0.008 Himachal Pradesh 0.00 0.00 5.83 0.83 5.83 0.379 Jammu <strong>and</strong> Kashmir 0.00 0.00 0.00 0.00 0.00 0.0010 Karnataka 647.67 73.34 174.81 24.83 822.48 51.8211 Kerala 0.00 0.00 0.00 0.00 0.00 0.0012 Madhya Pradesh 0.00 0.00 12.14 1.72 12.14 0.7613 Maharashtra 0.00 0.00 154.30 21.92 154.30 9.7214 Manipur 0.00 0.00 0.00 0.00 0.00 0.0015 Meghalaya 0.00 0.00 0.00 0.00 0.00 0.0016 Mizoram 0.00 0.00 0.00 0.00 0.00 0.0017 Nagal<strong>and</strong> 0.00 0.00 0.00 0.00 0.00 0.0018 Orissa 28.99 3.28 53.41 7.59 82.40 5.1919 Punjab 0.00 0.00 0.00 0.00 0.00 0.0020 Rajasthan 0.00 0.00 0.00 0.00 0.00 0.0021 Sikkim 0.00 0.00 0.00 0.00 0.00 0.0022 Tamil Nadu 131.75 14.92 12.65 1.80 144.40 9.1023 Tripura 0.00 0.00 0.00 0.00 0.00 0.0024 Uttar Pradesh 46.91 5.31 95.54 13.57 142.45 8.9825 West Bengal 0.00 0.00 0.00 0.00 0.00 0.0026 ALL INDIA 883.11 100.00 704.04 100.00 1587.15 100.004.2.4 On All India basis, the area coverage under ‘High Yield<strong>in</strong>g Varieties’ was around 55.64 % <strong>and</strong> rest wasunder traditional varieties. In states like Karnataka <strong>and</strong> Tamil Nadu, the coverage under HYV was morethan 88%, when taken together.4.3 PRODUCTION OF RAGI - IRRIGATED/UNIRRIGATED4.3.1 The estimated production <strong>of</strong> Ragi ‘irrigated <strong>and</strong> unirrigated’ is furnished <strong>in</strong> Annexure – III <strong>and</strong> issummarised <strong>in</strong> table No. 7TABLE NO. 7PRODUCTION OF RAGI -IRRIGATED AND UNIRRIGATED(AVERAGE 1996-97, 97-98 <strong>and</strong> 98-99).(‘000 tonnes)S.No. CategoryProductionIrrigated Unirrigated Total1. Small 179.80(21.30)(38.27)664.21(78.70)(36.64)844.01 (100.00)(36.97)2. Medium 125.42(18.69) 545.72(81.31) 671.14 (100.00)
(26.70) (30.10) (29.40)3. Large 164.59(21.44)(35.03)603.10(78.56)(33.26)767.69 (100.00)(33.63)All India 469.81(20.58)(100.00)1813.03(79.42)(100.00)2282.84 (100.00)(100.00)(The figures <strong>in</strong> parenthesis are percentages to the total <strong>of</strong> the column/row)4.3.2 The contents <strong>of</strong> the Table No. 9 show that out <strong>of</strong> total estimated production <strong>of</strong> 2282.84 thous<strong>and</strong> tonnes,the small category cultivators contributed 844.01 thous<strong>and</strong> tonnes, i.e., 36.97 %. Similarly, mediumcategory <strong>and</strong> large category cultivators shared 29.40 % <strong>and</strong> 33.63 % <strong>of</strong> production, respectively.4.3.3 The state-wise break up <strong>of</strong> estimated production is furnished <strong>in</strong> Table No. 8.TABLE NO. 8STATE-WISE BREAK UP OF PRODUCTION OF RAGI: IRRIGATED/UNIRRIGATED.(AVERAGE 1996-97, 1997-98 <strong>and</strong> 1998-99)(‘000 tonnes)S No Name <strong>of</strong> stateProductionIrrigated Unirrigated Total1 23 4 5Production. % Production. % Production. %1 Andhra Pradesh 0.00 0.00 134.64 7.43 134.64 5.902 Arunachal Pradesh 0.00 0.00 0.00 0.00 0.00 0.003 Assam 0.00 0.00 0.00 0.00 0.00 0.004 Bihar 8.39 1.79 61.49 3.39 69.88 3.065 Goa 0.00 0.00 0.00 0.00 0.00 0.006 Gujarat 20.79 4.43 0.00 0.00 20.79 0.917 Haryana 0.00 0.00 0.00 0.00 0.00 0.008 Himachal Pradesh 0.00 0.00 6.46 0.36 6.46 0.289 Jammu <strong>and</strong> Kashmir 0.00 0.00 0.00 0.00 0.00 0.0010 Karnataka 178.42 37.98 1137.55 62.74 1315.97 57.6511 Kerala 0.00 0.00 0.00 0.00 0.00 0.0012 Madhya Pradesh 0.00 0.00 3.69 0.20 3.69 0.1613 Maharashtra 0.00 0.00 158.82 8.76 158.82 6.9614 Manipur 0.00 0.00 0.00 0.00 0.00 0.0015 Meghalaya 0.00 0.00 0.00 0.00 0.00 0.0016 Mizoram 0.00 0.00 0.00 0.00 0.00 0.0017 Nagal<strong>and</strong> 0.00 0.00 0.00 0.00 0.00 0.0018 Orissa 0.00 0.00 60.44 3.33 60.44 2.6519 Punjab 0.00 0.00 0.00 0.00 0.00 0.0020 Rajasthan 0.00 0.00 0.00 0.00 0.00 0.0021 Sikkim 0.00 0.00 0.00 0.00 0.00 0.0022 Tamil Nadu 232.84 49.56 66.49 3.67 299.33 13.1123 Tripura 0.00 0.00 0.00 0.00 0.00 0.0024 Uttar Pradesh 29.37 6.24 183.45 10.12 212.82 9.3225 West Bengal 0.00 0.00 0.00 0.00 0.00 0.0026 ALL INDIA 469.81 100.00 1813.03 100.00 2282.84 100.004.3.4 The major Ragi produc<strong>in</strong>g states were Karnataka (57.65 %) <strong>and</strong> Tamil Nadu (13.11 %),4.4 PRODUCTION OF RAGI: HIGH YIELDING VARIETIES AND TRADITIONAL VARIETIES.4.4.1 The estimated production <strong>of</strong> Ragi – High Yield<strong>in</strong>g Varieties (HYV) <strong>and</strong> Traditional Varieties (TV) isfurnished <strong>in</strong> Annexure IV <strong>and</strong> summarised <strong>in</strong> Table No.9.
Table No. 9PRODUCTION OF RAGI: HIGH YIELDING VARIETY AND TRADIONAL VARIETY(AVERAGE 1996-97, 97-98 <strong>and</strong> 98-99).(‘000 tonnes)S.No. CategoryProductionHYV TV Total1. Small 644.13(76.32)(39.90)199.88(23.68)(29.91)844.01(100.00)(36.97)2. Medium 462.03(68.85)(28.62)209.11(31.15)(31.29)671.14(100.00)(29.40)3. Large 508.37(66.22)(31.48)259.32(33.78)(38.80)767.69(100.00)(33.63)All category 1614.53(70.73)(100.00)668.31(29.27)(100.00)2282.84(100.00)(100.00)(The figures <strong>in</strong> parenthesis are percentages to the totals <strong>of</strong> the column/row)4.4.2 As stated earlier, the share <strong>of</strong> small category cultivators was 36.97 percent <strong>and</strong> other categories sharedthe balance <strong>of</strong> production. It is also noticed that <strong>in</strong> small category, the percentage <strong>of</strong> HYV was nearly76.32 percent, <strong>in</strong> medium category, it was was 68.85 percent <strong>and</strong> <strong>in</strong> large category, it was 66.22percent. It is an <strong>in</strong>dicator <strong>of</strong> the fact that the small category cultivators were not lagg<strong>in</strong>g beh<strong>in</strong>d <strong>in</strong>adopt<strong>in</strong>g modern techniques like use <strong>of</strong> high yield<strong>in</strong>g varieties.4.4.3 the state-wise break-up <strong>of</strong> estimated production <strong>of</strong> Ragi <strong>of</strong> high yield<strong>in</strong>g varieties <strong>and</strong> traditionalvarieties is given <strong>in</strong> Table No. 10.TABLE NO. 10STATE-WISE BREAK-UP OF PRODUCTION OF RAGI: HIGH YIELDING VARIETIES (HYV) ANDTRADITIONAL VARIETIES (TV)(AVERAGE 1996-97, 1997-98 <strong>and</strong> 1998-99)(‘000 tonnes)S No Name <strong>of</strong> stateProductionHYV TV Total1 23 4 5Prod. % Prod. % Prod. %1 Andhra Pradesh 0.00 0.00 134.64 20.15 134.64 5.902 Arunachal Pradesh 0.00 0.00 0.00 0.00 0.00 0.003 Assam 0.00 0.00 0.00 0.00 0.00 0.004 Bihar 14.43 0.89 55.45 8.30 69.88 3.065 Goa 0.00 0.00 0.00 0.00 0.00 0.006 Gujarat 20.79 1.29 0.00 0.00 20.79 0.917 Haryana 0.00 0.00 0.00 0.00 0.00 0.008 Himachal Pradesh 0.00 0.00 6.46 0.97 6.46 0.289 Jammu <strong>and</strong> Kashmir 0.00 0.00 0.00 0.00 0.00 0.0010 Karnataka 1165.80 72.21 150.17 22.47 1315.97 57.6511 Kerala 0.00 0.00 0.00 0.00 0.00 0.0012 Madhya Pradesh 0.00 0.00 3.69 0.55 3.69 0.1613 Maharashtra 0.00 0.00 158.82 23.76 158.82 6.9614 Manipur 0.00 0.00 0.00 0.00 0.00 0.0015 Meghalaya 0.00 0.00 0.00 0.00 0.00 0.0016 Mizoram 0.00 0.00 0.00 0.00 0.00 0.0017 Nagal<strong>and</strong> 0.00 0.00 0.00 0.00 0.00 0.0018 Orissa 31.49 1.95 28.95 4.33 60.44 2.65
19 Punjab 0.00 0.00 0.00 0.00 0.00 0.0020 Rajasthan 0.00 0.00 0.00 0.00 0.00 0.0021 Sikkim 0.00 0.00 0.00 0.00 0.00 0.0022 Tamil Nadu 290.48 17.99 8.85 1.32 299.33 13.1123 Tripura 0.00 0.00 0.00 0.00 0.00 0.0024 Uttar Pradesh 91.54 5.67 121.28 18.15 212.82 9.3225 West Bengal 0.00 0.00 0.00 0.00 0.00 0.0026 ALL INDIA 1614.53 100.00 668.31 100.00 2282.84 100.004.4.4 Out <strong>of</strong> the total production <strong>of</strong> 2282.84 thous<strong>and</strong> tonnes, the share <strong>of</strong> states like Karnataka <strong>and</strong> TamilNadu, taken together, was more than 70 percent.
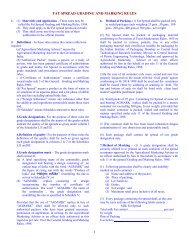
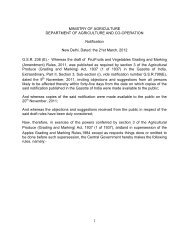
CHAPTER – VRETENTION OF RAGI BY FARM HOUSEHOLD5.1 Ragi is reta<strong>in</strong>ed fori) farm-family consumption,ii) consumption by permanent labour <strong>and</strong> temporary labour engaged on the farm,iii) seed purpose,iv) animal feed,v) barter (now nearly disappeared) <strong>and</strong>vi) Payments <strong>in</strong> k<strong>in</strong>d <strong>and</strong> cash for different purposes.5.2 RETENTION FOR FARM FAMILY COSUMPTION5.2.1 The total quantity <strong>of</strong> Ragi reta<strong>in</strong>ed for farm-family consumption was estimated at 1302.23 thous<strong>and</strong>tonnes. It worked out to 57.04 percent <strong>of</strong> total production. The State-wise, Category-wise estimates <strong>of</strong>Ragi reta<strong>in</strong>ed for farm-family consumption as averages for the years 1996-97 to 98-99 are presented <strong>in</strong>Annexure – V. The overall summary <strong>of</strong> the Annexure – V is given <strong>in</strong> Table No. 11 below :TABLE NO. 11RETENTION OF RAGI FOR CONSUMPTION BY THE FARM-FAMILY ON ALL INDIA BASIS.(AVERAGE 1996-97, 97-98 <strong>and</strong> 98-99).(‘000 tonnes)S.No. Category Total production Quantityreta<strong>in</strong>edPercent <strong>of</strong>production1. Small 844.01 548.70 65.012. Medium 671.14 348.32 51.903. Large 767.69 405.21 52.78All categories 2282.84 1302.23 57.045.2.2 State-wise break-up <strong>of</strong> the total retention <strong>of</strong> Ragi for consumption by the farm-family is furnished <strong>in</strong>Table No. 12.TABLE NO. 12STATE-WISE RETENTION OF RAGI (ALL CATEGORIES)FOR FARM-FAMILY CONSUMPTION.(AVERAGE 1996-97, 1997-98 <strong>and</strong> 1998-99)(‘000 tonnes)S.No. State TotalproductionQuantityreta<strong>in</strong>edPercent tototalproduction1 Andhra Pradesh 134.64 40.57 30.132 Arunachal Pradesh 0.00 0.00 0.003 Assam 0.00 0.00 0.004 Bihar 69.88 57.34 82.055 Goa 0.00 0.00 0.006 Gujarat 20.79 15.89 76.437 Haryana 0.00 0.00 0.008 Himachal Pradesh 6.46 5.65 87.469 Jammu <strong>and</strong> Kashmir 0.00 0.00 0.0010 Karnataka 1315.97 690.39 52.4611 Kerala 0.00 0.00 0.0012 Madhya Pradesh 3.69 2.62 71.0013 Maharashtra 158.82 124.18 78.1914 Manipur 0.00 0.00 0.0015 Meghalaya 0.00 0.00 0.0016 Mizoram 0.00 0.00 0.0017 Nagal<strong>and</strong> 0.00 0.00 0.00
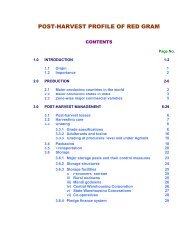
Retention <strong>of</strong> Ragi by Farm Family For Consumption at Farm Level(Qantity <strong>in</strong> '000 tonnes <strong>and</strong> percentage <strong>of</strong> total production)81.89(3.59%)0.45(0.02%)1302.23((57.04%)FamilyPermanent LabourTemporary Labour
18 Orissa 60.44 35.89 59.3819 Punjab 0.00 0.00 0.0020 Rajasthan 0.00 0.00 0.0021 Sikkim 0.00 0.00 0.0022 Tamil Nadu 299.33 191.23 63.8923 Tripura 0.00 0.00 0.0024 Uttar Pradesh 212.82 138.47 65.0625 West Bengal 0.00 0.00 0.0026 ALL INDIA 2282.84 1302.23 57.04It is observed that retention for farm-family consumption was highest <strong>in</strong> Himachal Pradesh (87.46%), followedby Bihar (82.05%) <strong>and</strong> Maharashtra (78.19%), etc.5.3 RETENTION OF RAGI FOR CONSUMPTION OF PERMANENT LABOUR ANDTEMPORARY LABOUR.5.3.1 The state-wise <strong>and</strong> category-wise details <strong>of</strong> estimated retention for consumption by permanent labour<strong>and</strong> temporary labour engaged on the farm by the farm household is furnished <strong>in</strong> Annexures VI <strong>and</strong>VII respectively. The overall summary with category-wise break-up is presented <strong>in</strong> Table No. 13:TABLE NO. 13RETENTION BY THE FARM-FAMILY FOR CONSUMPTION BYPERMANENT LABOUR AND TEMPORARY LABOUR ENGAGED ON THE FARM.(AVERAGE 1996-97, 1997-98 <strong>and</strong> 1998-99)(‘000 tonnes)S. No. Category TotalQuantity reta<strong>in</strong>ed for consumptionproduction Permanent Percent Temporary Percentlabourlabour1. Small 844.01 0.00 0.00 23.15 2.742. Medium 671.14 0.00 0.00 26.03 3.883. Large 767.69 0.45 0.06 32.71 4.26All India 2282.84 0.45 0.02 81.89 3.59The estimated quantity <strong>of</strong> Ragi reta<strong>in</strong>ed for consumption by permanent labours <strong>and</strong> temporary labourworked out to 0.02 percent <strong>and</strong> 3.59 percent respectively <strong>of</strong> production.5.3.2 The State-wise retention <strong>of</strong> Ragi for consumption by all categories <strong>of</strong> cultivators taken together forpermanent labour <strong>and</strong> temporary labour employed on the farm are furnished <strong>in</strong> Annexures VI <strong>and</strong>VII <strong>and</strong> summary there<strong>of</strong> is furnished <strong>in</strong> Table No. 14.TABLE NO. 14STATE-WISE RETENTION BY THE FARM FAMILY FOR CONSUMPTION BY THE PERMANENTLABOUR AND TEMPORARY LABOUR EMPLOYED ON THE FARM (ALL CATEGORIES).(AVERAGE 1996-97, 1997-98 <strong>and</strong> 1998-99)(‘000 tonnes)S.No.Total Quantity reta<strong>in</strong>ed for consumptionTotalState production Permanent labour Temporary labourQuantity Percent Quantity Percent Quantity Percent1 2 3 4 5 6 7 8 91 Andhra Pradesh 134.64 0.00 0.00 0.00 0.00 0.00 0.002 Arunachal Pradesh 0.00 0.00 0.00 0.00 0.00 0.00 0.003 Assam 0.00 0.00 0.00 0.00 0.00 0.00 0.004 Bihar 69.88 0.00 0.00 3.40 4.87 3.40 4.875 Goa 0.00 0.00 0.00 0.00 0.00 0.00 0.006 Gujarat 20.79 0.00 0.00 0.26 1.25 0.26 1.257 Haryana 0.00 0.00 0.00 0.00 0.00 0.00 0.008 Himachal Pradesh 6.46 0.00 0.00 0.17 2.63 0.17 2.63
9 Jammu & Kashmir 0.00 0.00 0.00 0.00 0.00 0.00 0.0010 Karnataka 1315.97 0.45 0.03 72.33 5.50 72.78 5.5311 Kerala 0.00 0.00 0.00 0.00 0.00 0.00 0.0012 Madhya Pradesh 3.69 0.00 0.00 0.01 0.27 0.01 0.2713 Maharashtra 158.82 0.00 0.00 0.00 0.00 0.00 0.0014 Manipur 0.00 0.00 0.00 0.00 0.00 0.00 0.0015 Meghalaya 0.00 0.00 0.00 0.00 0.00 0.00 0.0016 Mizoram 0.00 0.00 0.00 0.00 0.00 0.00 0.0017 Nagal<strong>and</strong> 0.00 0.00 0.00 0.00 0.00 0.00 0.0018 Orissa 60.44 0.00 0.00 0.60 0.99 0.60 0.9919 Punjab 0.00 0.00 0.00 0.00 0.00 0.00 0.0020 Rajasthan 0.00 0.00 0.00 0.00 0.00 0.00 0.0021 Sikkim 0.00 0.00 0.00 0.00 0.00 0.00 0.0022 Tamil Nadu 299.33 0.00 0.00 0.00 0.00 0.00 0.0023 Tripura 0.00 0.00 0.00 0.00 0.00 0.00 0.0024 Uttar Pradesh 212.82 0.00 0.00 5.12 2.41 5.12 2.4125 West Bengal 0.00 0.00 0.00 0.00 0.00 0.00 0.0026 ALL INDIA 2282.84 0.45 0.02 81.89 3.59 82.34 3.61It has been observed that the quantity reta<strong>in</strong>ed for consumption <strong>of</strong> permanent labour <strong>and</strong> temporarylabour was maximum <strong>in</strong> Karnataka (5.53 %).5.4 TOTAL RETENTION FOR CONSUMPTION AT FARM LEVEL (FARM FAMILYCONSUMPTION AND CONSUMPTION BY PERMANENT LABOUR AND TEMPORARYLABOUR ENGAGED AT FARM).5.4.1 The state-wise <strong>and</strong> category-wise details <strong>of</strong> estimated total retention <strong>of</strong> Ragi, for consumption atfarm level, are furnished <strong>in</strong> Annexure – VIII. The overall summary, with category-wise break-up, ispresented <strong>in</strong> Table No. 15.TABLE NO. 15TOTAL RETENTION OF RAGI FOR CONSUMPTION AT FARM LEVEL(AVERAGE 1996-97, 1997-98 <strong>and</strong> 1998-99)(‘000 tonnes)Sl.No. Category TotalProductionRetention forconsumption at farm levelPercent to totalProduction1. Small 844.01 571.85 67.752. Medium 671.14 374.35 55.783. Large 767.69 438.37 57.10All India 2282.84 1384.57 60.65Thus, the total retention <strong>of</strong> Ragi, for consumption at farm level, was estimated at 60.65 percent <strong>of</strong>production.5.4.2 The state-wise break up <strong>of</strong> total retention <strong>of</strong> Ragi by all categories <strong>of</strong> cultivators, taken together forconsumption at farm level, is furnished <strong>in</strong> Table No. 16.TABLE NO. 16STATE-WISE RETENTION OF RAGI FOR CONSUMPTION AT FARM LEVEL(AVERAGE 1996-97, 1997-98 <strong>and</strong> 1998-99)(‘000 tonnes)S.No. State TotalproductionRetention forconsumption at farmlevelPercent to totalproduction1 Andhra Pradesh 134.64 40.57 30.132 Arunachal Pradesh 0.00 0.00 0.003 Assam 0.00 0.00 0.00
4 Bihar 69.88 60.74 86.925 Goa 0.00 0.00 0.006 Gujarat 20.79 16.15 77.687 Haryana 0.00 0.00 0.008 Himachal Pradesh 6.46 5.82 90.099 Jammu & Kashmir 0.00 0.00 0.0010 Karnataka 1315.97 763.17 57.9911 Kerala 0.00 0.00 0.0012 Madhya Pradesh 3.69 2.63 71.2713 Maharashtra 158.82 124.18 78.1914 Manipur 0.00 0.00 0.0015 Meghalaya 0.00 0.00 0.0016 Mizoram 0.00 0.00 0.0017 Nagal<strong>and</strong> 0.00 0.00 0.0018 Orissa 60.44 36.49 60.3719 Punjab 0.00 0.00 0.0020 Rajasthan 0.00 0.00 0.0021 Sikkim 0.00 0.00 0.0022 Tamil Nadu 299.33 191.23 63.8923 Tripura 0.00 0.00 0.0024 Uttar Pradesh 212.82 143.59 67.4725 West Bengal 0.00 0.00 0.0026 ALL INDIA 2282.84 1384.57 60.65In Himachal Pradesh, the retention <strong>of</strong> Ragi for consumption at farm level was 90.09 percent, thehighest <strong>in</strong> the country. The lowest retention on this account was reported to be 30.13 percent <strong>in</strong>Andhra Pradesh. The state-wise analysis is presented below:Upto 50 percent 50 percent to 75 percent More than 75 percentAndhra Pradesh (30.13) Karnataka (57.99)Orissa (60.37)Tamil Nadu (63.89)Uttar Pradesh (67.47)M.P. (71.27)Gujarat (77.68)Maharashtra (78.19)Bihar (86.92)Himachal Pradesh (90.09)5.5 PURCHASES OF RAGI FOR CONSUMPTION5.5.1 The purchases <strong>of</strong> Ragi by the farm household was not found dur<strong>in</strong>g the survey5.7 RETENTION OF RAGI FOR SEED PURPOSE5.7.1 The details <strong>of</strong> estimated retention <strong>of</strong> Ragi for seed purpose, ‘state-wise <strong>and</strong> category-wise’, arefurnished <strong>in</strong> Annexures IX. The categorywise details are further summarised on all India basis, <strong>in</strong>Table No. 17.TABLE NO. 17RETENTION OF RAGI FOR SEED PURSPOSE(AVERAGE 1996-97, 1997-98 <strong>and</strong> 1998-99)(‘000 tonnes)Sl.No.Category Total production Quantity reta<strong>in</strong>ed forseed purposePercent to totalproduction1. Small 844.01 18.39 2.182. Medium 671.14 14.34 2.143. Large 767.69 24.04 3.13All India 2282.84 56.77 2.49It is seen that retention <strong>of</strong> Ragi for seed purpose, on an average was 2.49 percent.
5.7.2 The state-wise break-up <strong>of</strong> total retention <strong>of</strong> Ragi for seed purpose by all categories <strong>of</strong> cultivators, takentogether, is given <strong>in</strong> Table No. 18.TABLE NO. 18RETENTION OF RAGI FOR SEED PURPOSE: STATE-WISE BREAK-UP(AVERAGE 1996-97, 1997-98 <strong>and</strong> 1998-99)(‘000 tonnes)S. No. State Total production Quantity reta<strong>in</strong>edfor seed purposePercent to totalproduction1 Andhra Pradesh 134.64 0.20 0.152 Arunachal Pradesh 0.00 0.00 0.003 Assam 0.00 0.00 0.004 Bihar 69.88 2.35 3.365 Goa 0.00 0.00 0.006 Gujarat 20.79 0.05 0.247 Haryana 0.00 0.00 0.008 Himachal Pradesh 6.46 0.05 0.779 Jammu & Kashmir 0.00 0.00 0.0010 Karnataka 1315.97 36.16 2.7511 Kerala 0.00 0.00 0.0012 Madhya Pradesh 3.69 0.21 5.6913 Maharashtra 158.82 0.94 0.5914 Manipur 0.00 0.00 0.0015 Meghalaya 0.00 0.00 0.0016 Mizoram 0.00 0.00 0.0017 Nagal<strong>and</strong> 0.00 0.00 0.0018 Orissa 60.44 3.04 5.0319 Punjab 0.00 0.00 0.0020 Rajasthan 0.00 0.00 0.0021 Sikkim 0.00 0.00 0.0022 Tamil Nadu 299.33 6.78 2.2723 Tripura 0.00 0.00 0.0024 Uttar Pradesh 212.82 6.99 3.2825 West Bengal 0.00 0.00 0.0026 ALL INDIA 2282.84 56.77 2.495.7.3 The state-wise <strong>and</strong> category-wise details <strong>of</strong> estimated retention <strong>of</strong> Ragi for seed purpose – forirrigated crop <strong>and</strong> unirrigated crop are presented <strong>in</strong> Annexure IX-A. A summary <strong>of</strong> this Annexure ispresented <strong>in</strong> Table No. 19.TABLE NO. 19RETENTION OF RAGI FOR SEED PURPOSE: IRRIGATED CROP AND UNIRRIGATED CROP.(AVERAGE 1996-97, 1997-98 <strong>and</strong> 1998-99)(‘000 tonnes)Sl.No. Crop TotalproductionRetention forseedPercent to totalproduction1. Irrigated 469.81 4.38 0.932. Unirrigated 1813.03 52.39 2.89Total 2282.84 56.77 2.49On an average, the retention for seed purpose was 2.49 percent <strong>of</strong> the total production. The percentage<strong>of</strong> retention under unirrigated crops was reported more than that <strong>of</strong> under irrigated crop
5.8 RETENTION OF RAGI FOR ANIMAL FEED.5.8.1 Ragi as animal feed was not very common. However, <strong>in</strong> some states, it was fed to milch animals, beef<strong>and</strong> pork stock, poultry etc. The state-wise <strong>and</strong> category-wise details <strong>of</strong> the estimated retention <strong>of</strong> Ragifor animal feed are furnished <strong>in</strong> Annexure –X. Table No. 20 shows all India retention <strong>of</strong> Ragi foranimal feed with category-wise break up.TABLE NO. 20RETENTION OF RAGI FOR ANIMAL FEED(AVERAGE 1996-97, 1997-98 <strong>and</strong> 1998-99)(‘000 tonnes)Percent to totalproductionS.No. Category TotalproductionRetention foranimal feed1. Small 844.01 0.13 0.022. Medium 671.14 0.42 0.063. Large 767.69 0.77 0.10All India 2282.84 1.32 0.065.8.2 The state-wise break up <strong>of</strong> the total retention <strong>of</strong> Ragi for use as animal feed is furnished <strong>in</strong> Table No.21.TABLE NO. 21RETENTION OF RAGI FOR ANIMAL FEED: STATE-WISE BREAK-UP(AVERAGE 1996-97, 1997-98 <strong>and</strong> 1998-99)(‘000 tonnes)S. No. State TotalproductionRetention foranimal feedPercent to totalproduction1 Andhra Pradesh 134.64 0.00 0.002 Arunachal Pradesh 0.00 0.00 0.003 Assam 0.00 0.00 0.004 Bihar 69.88 0.00 0.005 Goa 0.00 0.00 0.006 Gujarat 20.79 0.00 0.007 Haryana 0.00 0.00 0.008 Himachal Pradesh 6.46 0.00 0.009 Jammu & Kashmir 0.00 0.00 0.0010 Karnataka 1315.97 0.80 0.0611 Kerala 0.00 0.00 0.0012 Madhya Pradesh 3.69 0.00 0.0013 Maharashtra 158.82 0.00 0.0014 Manipur 0.00 0.00 0.0015 Meghalaya 0.00 0.00 0.0016 Mizoram 0.00 0.00 0.0017 Nagal<strong>and</strong> 0.00 0.00 0.0018 Orissa 60.44 0.20 0.0319 Punjab 0.00 0.00 0.0020 Rajasthan 0.00 0.00 0.0021 Sikkim 0.00 0.00 0.0022 Tamil Nadu 299.33 0.00 0.0023 Tripura 0.00 0.00 0.0024 Uttar Pradesh 212.82 0.32 0.1525 West Bengal 0.00 0.00 0.0026 ALL INDIA 2282.84 1.32 0.06Retention <strong>of</strong> Ragi for animal feed was ma<strong>in</strong>ly reported from Karnataka, Orissa <strong>and</strong> Uttar Pradesh. Onall India basis, only 0.06 percent <strong>of</strong> the total production <strong>of</strong> Ragi was reta<strong>in</strong>ed for animal feed.
5.9 UTILISATION OF RAGI FOR BARTER.5.9.1 In the past, ‘barter’ was very common. However, over a period <strong>of</strong> time, due <strong>of</strong> modernisation, thepractice <strong>of</strong> ‘barter’ has almost disappeared.5.10 UTILISATION OF RAGI FOR PAYMENT TO PERMANENT LABOUR – IN CASH ANDKIND.5.10.1 The permanent labour is employed on the farm for various operations <strong>and</strong> is paid both <strong>in</strong> k<strong>in</strong>d <strong>and</strong>cash. Dur<strong>in</strong>g the survey, the estimated utilisation <strong>of</strong> Ragi for this purpose was found nil.5.11 UTILISATION OF RAGI FOR PAYMENTS IN CASH FOR VARIOUS PURPOSES FROMCURRENT YEAR’S CROP AND PREVIOUS YEAR’S CROP.The farm households are required to make payments <strong>in</strong> cash towards:- Temporary farm labour;- Farm mach<strong>in</strong>ery <strong>and</strong> equipments (on hire);- Customary payments to village artisans;- To l<strong>and</strong> owner as share <strong>of</strong> produce;- Repayment <strong>of</strong> loans;- L<strong>and</strong> revenue;- Irrigation <strong>and</strong> other causes applicable;- Other miscellaneous payments.5.11.1 The category-wise break up for utilisation <strong>of</strong> Ragi towards cash payment on these items from currentyears crop is furnished <strong>in</strong> Annexures XI, XII, XIII <strong>and</strong> total for all categories is furnished <strong>in</strong>Annexure XIV. A summary <strong>of</strong> these Annexures is presented <strong>in</strong> Table No. 22.TABLE NO. 22UTILISATION OF RAGI TOWARDS PAYMENT IN CASH FROM SALE PROCEEDS OF CURRENTYEARS CROP.(AVERAGE 1996-97, 1997-98 <strong>and</strong> 1998-99).(‘000 tonnes)S. No. Item(Category)TotalSmall Medium Large quantityQuantity sol Quantity Quantity soldsold sold1. Temp. farm labour 3.42(10.53(84.86)2.78(8.56)(60.70)26.28(80.91(85.55)32.48(100.0(82.59)2. Farm mach<strong>in</strong>e 0.00(0.00) 0.00(0.00) 0.00(0.00) 0.00(0.0equipements(0.00) (0.00) (0.00) (0.00)3. Customary paymentsartisans0.00(0.00)(0.00)0.00(0.00)(0.00)0.00(0.00)(0.00)0.00(0.0(0.00)4. As rent l<strong>and</strong> owner 0.00(0.00)(0.00)0.00(0.00)(0.00)0.00(0.00)(0.00)0.00(0.0(0.00)5. As share <strong>of</strong> producel<strong>and</strong> owner0.00(0.00)(0.00)0.00(0.00)(0.00)0.00(0.00)(0.00)0.00(0.0(0.00)6. Repayment <strong>of</strong> loan 0.00(0.00)(0.00)0.00(0.00)(0.00)0.00(0.00)(0.00)0.00(0.0(0.00)7. L<strong>and</strong> revenue 0.00(0.00)(0.00)0.01(0.37)(0.22)2.67(99.63)(8.69)2.68(100.0(6.81)8. Irrigation <strong>and</strong> other ca 0.02(20.00(0.50)0.04(40.00(0.87)0.04(40.00)(0.13)0.10(100.0(0.25)9. Others 0.59(14.50 1.75(43.00 1.73(42.50) 4.07(100.0(14.64)Total 4.03(10.25(100.00)(Figures <strong>in</strong> parenthesis are percentage to total)(38.21)4.58(11.64(100.00)(5.63)30.72(78.11(100.00)(10.35)39.33(100.0(100.00)
It has been observed that small category farmers utilised 10.25 percent, medium category utilised 11.64percent <strong>and</strong> large category utilised 78.11 percent <strong>of</strong> the total quantity <strong>of</strong> 39.33 thous<strong>and</strong> tonnes utilisedfor the purposes <strong>in</strong>dicated <strong>in</strong> the table 24. This quantity was nearly 1.72 percent <strong>of</strong> total production. Itmay be noted here that this cash payment had been accounted for <strong>in</strong> total sales. The data shownhere is for academic <strong>in</strong>terest.5.11.2 The category-wise use <strong>of</strong> Ragi for payment <strong>in</strong> cash from sale proceeds <strong>of</strong> produce <strong>of</strong> previous years’crop is furnished <strong>in</strong> Annexures XV, XVI, XVII <strong>and</strong> total <strong>of</strong> all categories, taken together, isfurnished <strong>in</strong> Annexure XVIII. All India brief <strong>of</strong> the same is furnished <strong>in</strong> Table No. 23.TABLE NO. 23UTILISATION OF RAGI TOWARDS PAYMENTS IN CASH FROM SALE PROCEEDS OF PREVIOUSYEARS CROP(AVERAGE 1996-97, 1997-98 <strong>and</strong> 1998-99).S. No. ItemCategorySmall Medium Large1. Temp. farm labour 4.12(10.22 21.67(53.76 14.52(36.02(86.37) (83.28) (77.65)2. Farm mach<strong>in</strong>e 0.00(0.00) 0.00(0.00) 0.17(100.00Equipments(0.00) (0.00) (0.91)3. Customary payment 0.00(0.00) 0.00(0.00) 0.00(0.00)village artisans(0.00) (0.00) (0.00)4. Rent to l<strong>and</strong> owner 0.00(0.00) 0.00(0.00) 0.00(0.00)(0.00) (0.00) (0.00)5. Share to the l<strong>and</strong> owne 0.00(0.00) 0.00(0.00) 0.00(0.00)(0.00) (0.00) (0.00)6. Loans 0.00(0.00) 0.66(100.00 0.00(0.00)(0.00) (2.54) (0.00)7. L<strong>and</strong> revenue 0.00(0.00) 0.01(0.75) 1.33(99.25)(0.00) (0.04) (7.11)8. Irrigation <strong>and</strong> other ce 0.03(14.29 0.17(80.95) 0.01(4.76)(0.63) (0.65) (0.05)9. Others 0.62(9.12) 3.51(51.62) 2.67(39.26)(13.00) (13.49) (14.28)Total 4.77(9.63) 26.02(52.58 18.70(37.79(100.00) (100.00) (100.00)(‘000 tonnes)Totalpayment40.31(100.0(81.45)0.17(100.0(0.34)0.00(0.0(0.00)0.00(0.0(0.00)0.00(0.0(0.00)0.66(100.0(1.33)1.34(100.0(2.72)0.21(100.0(0.42)6.80(100.0(13.74)49.49(100.0(100.00)(Figures <strong>in</strong> parenthesis are percentage to total)It has been observed that 49.49 thous<strong>and</strong> tonnes <strong>of</strong> Ragi was utilised towards payments <strong>in</strong> cash fromthe proceeds <strong>of</strong> previous crop year, the <strong>of</strong> medium category farmers utilised 26.02 thous<strong>and</strong> tonnesfollowed by 18.70 thous<strong>and</strong> tonnes by large category farmers <strong>and</strong> 4.77 thous<strong>and</strong> tonnes by smallcategory farmers.5.11.3 As stated earlier, one <strong>of</strong> the obligations <strong>of</strong> the farmer is towards payment <strong>in</strong> k<strong>in</strong>d. The state-wise break up<strong>of</strong> retention <strong>and</strong> utilisation <strong>of</strong> Ragi for payments <strong>in</strong> k<strong>in</strong>d by small, medium <strong>and</strong> large is furnished <strong>in</strong>Annexures XIX, XX, XXI respectively <strong>and</strong> all category total is furnished <strong>in</strong> Annexure XXII. A summary<strong>of</strong> the same on all India basis for all categories taken together is furnished <strong>in</strong> Table No. 24, below:
TABLE NO. 24.UTILISATION OF RAGI FOR PAYMENT IN KIND FOR DIFFERENT PURPOSES.(AVERAGE 1996-97, 1997-98 <strong>and</strong> 1998-99).S. No. ItemCategorySmall Medium Large1. Temp. farm labour 21.72(31.52 18.19(26.40 29.00(42.08(84.88) (71.50) (90.31)2. Farm mach<strong>in</strong>e 0.00(0.00) 0.00(0.00) 0.00(0.00)equipments(0.00) (0.00) (0.00)3. Customary payment 3.44(37.31) 3.87(41.97) 1.91(20.72)to village artisans (13.44) (15.21) (5.95)4. Rent to l<strong>and</strong> owner 0.00(0.00) 0.13(100.00 0.00(0.00)(0.00) (0.51) (0.00)5. Share to the l<strong>and</strong> own 0.41(68.33) 0.19(31.67) 0.00(0.00)(1.60) (0.76) (0.00)6. Payment <strong>of</strong> loans 0.00(0.00) 0.68(100.00 0.00(0.00)(0.00) (2.67) (0.00)7. L<strong>and</strong> revenue 0.00(0.00) 0.00(0.00) 0.00(0.00)(0.00) (0.00) (0.00)8. Irrigation <strong>and</strong> other c 0.00(0.00) 0.09(100.00 0.00(0.00)(0.00) (0.35) (0.00)9. Others 0.02(0.57) 2.29(65.24) 1.20(34.19)(0.08) (9.00) (3.74)Total 25.59(30.78 25.44(30.60 32.11(38.62(100.00) (100.00) (100.00)(‘000 tonnes)Totalpayment68.91(100.00)(82.88)0.00(0.00)(0.00)9.22(100.00)(11.09)0.13(100.00)(0.16)0.60(100.00)(0.72)0.68(100.00)(0.82)0.00(0.00)(0.00)0.09(100.00)(0.11)3.51(100.00)(4.22)83.14(100.00)(100.00)(Figures <strong>in</strong> parenthesis are percentage to total)It has been observed that the s<strong>in</strong>gle major item <strong>of</strong> utilisation for payment <strong>in</strong> k<strong>in</strong>d <strong>in</strong> all categories waspayment towards temporary labour. On all India basis, total payment <strong>in</strong> k<strong>in</strong>d was 83.14 thous<strong>and</strong>tonnes. Out <strong>of</strong> this payment to temporary labour <strong>in</strong> k<strong>in</strong>d accounted for 68.91 thous<strong>and</strong> tonnes or 3.02percent <strong>of</strong> total production. The total payment <strong>in</strong> k<strong>in</strong>d accounted to about 3.64 percent <strong>of</strong> totalproduction.5.11.4 The state-wise break-up <strong>of</strong> total utilisation <strong>of</strong> Ragi by all categories <strong>of</strong> cultivators taken togethertowards payments <strong>in</strong> k<strong>in</strong>d for different items is furnished <strong>in</strong> Table No. 25 below.TABLE NO. 25STATE-WISE BREAK UP OF UTILISATION OF RAGI TOWARDS PAYMENTS IN KIND.(AVERAGE 1996-97, 1997-98 <strong>and</strong> 1998-99).(‘000 tonnes)S. No. State Total production Total utilisation towards payments <strong>in</strong> k<strong>in</strong>d.<strong>of</strong> Ragi Small Medium Large Total1 Andhra Pradesh 134.64 1.09 1.54 1.34 3.972 Arunachal Pradesh 0.00 0.00 0.00 0.00 0.003 Assam 0.00 0.00 0.00 0.00 0.004 Bihar 69.88 0.14 0.70 1.43 2.275 Goa 0.00 0.00 0.00 0.00 0.00
6 Gujarat 20.79 0.00 0.00 0.00 0.007 Haryana 0.00 0.00 0.00 0.00 0.008 Himachal Pr. 6.46 0.06 0.09 0.06 0.219 Jammu & Kashmir 0.00 0.00 0.00 0.00 0.0010 Karnataka 1315.97 8.46 9.56 13.95 31.9711 Kerala 0.00 0.00 0.00 0.00 0.0012 Madhya Pradesh 3.69 0.00 0.00 0.00 0.0013 Maharashtra 158.82 0.00 0.00 0.00 0.0014 Manipur 0.00 0.00 0.00 0.00 0.0015 Meghalaya 0.00 0.00 0.00 0.00 0.0016 Mizoram 0.00 0.00 0.00 0.00 0.0017 Nagal<strong>and</strong> 0.00 0.00 0.00 0.00 0.0018 Orissa 60.44 0.56 0.52 0.66 1.7419 Punjab 0.00 0.00 0.00 0.00 0.0020 Rajasthan 0.00 0.00 0.00 0.00 0.0021 Sikkim 0.00 0.00 0.00 0.00 0.0022 Tamil Nadu 299.33 10.52 8.81 8.09 27.4223 Tripura 0.00 0.00 0.00 0.00 0.0024 Uttar Pradesh 212.82 4.76 4.22 6.58 15.5625 West Bengal 0.00 0.00 0.00 0.00 0.0026 ALL INDIA 2282.84 25.59 25.44 32.11 83.14Utilisation <strong>of</strong> Ragi towards these payments <strong>in</strong> k<strong>in</strong>d was seen predom<strong>in</strong>antly <strong>in</strong> States likeKarnataka, Tamil Nadu <strong>and</strong> Uttar Pradesh etc.
Total Post Harvest Losses <strong>of</strong> Ragi(Qantity <strong>in</strong> '000 tonnes <strong>and</strong> percentage <strong>of</strong> total production)12.07(0.53%)14.10(0.62%)17.53(0.77%)25.77(1.13%)17.43(0.76%)Field To Thresh<strong>in</strong>g FloorDur<strong>in</strong>g Thresh<strong>in</strong>gDur<strong>in</strong>g W<strong>in</strong>now<strong>in</strong>gThresh<strong>in</strong>g Floor to StorageDur<strong>in</strong>g Storage
CHAPTER – VIPOST HARVEST LOSSES OF RAGI AT FARM LEVEL.6.1 Dur<strong>in</strong>g this survey, the <strong>losses</strong> <strong>of</strong> Ragi at producers level were studied <strong>and</strong> the data is presented <strong>in</strong> theAnnexures listed below :i) Estimated <strong>losses</strong> <strong>of</strong> Ragi at thresh<strong>in</strong>g floor, category-wise <strong>and</strong> source-wise – AnnexuresXXIII & XXIV;ii) Estimated <strong>losses</strong> <strong>of</strong> Ragi <strong>in</strong> w<strong>in</strong>now<strong>in</strong>g, category-wise <strong>and</strong> sources-wise – Annexures XXV& XXVI;iii) Estimated <strong>losses</strong> <strong>of</strong> Ragi <strong>in</strong> transport from field to thresh<strong>in</strong>g floor, category-wise <strong>and</strong>mode <strong>of</strong> transport wise – Annexures XXVII & XXVIII;iv) Estimated <strong>losses</strong> <strong>of</strong> Ragi <strong>in</strong> transport from thresh<strong>in</strong>g floor to storage at farm-level,category-wise <strong>and</strong> mode <strong>of</strong> transport used – Annexures XXIX& XXX;v) Estimated <strong>losses</strong> <strong>of</strong> Ragi <strong>in</strong> transport from field to thresh<strong>in</strong>g floor <strong>and</strong> from thresh<strong>in</strong>gfloor to storage – accord<strong>in</strong>g to mode <strong>of</strong> pack<strong>in</strong>g – Annexure XXXI;vi) Estimated <strong>losses</strong> <strong>of</strong> Ragi <strong>in</strong> storage at producer’s level – category-wise <strong>and</strong> accord<strong>in</strong>g totype <strong>of</strong> storage/ mode <strong>of</strong> storage – Annexures XXXII & XXXIII;vii) Estimated <strong>losses</strong> <strong>of</strong> Ragi at producers level accord<strong>in</strong>g to causes <strong>of</strong> <strong>losses</strong> – AnnexureXXXIV;viii) Estimated total <strong>post</strong>-<strong>harvest</strong> <strong>losses</strong> – category-wise Annexure XXXV, XXXVI &XXXVII;ix) Total <strong>post</strong>-<strong>harvest</strong> <strong>losses</strong> – total <strong>of</strong> all categories – Annexure XXXVIII.6.1.1 The overall summary <strong>of</strong> total <strong>post</strong> <strong>harvest</strong> <strong>losses</strong> <strong>of</strong> Ragi at producers’ level dur<strong>in</strong>g differentoperations viz, thresh<strong>in</strong>g, w<strong>in</strong>now<strong>in</strong>g, transport from field to thresh<strong>in</strong>g floor, further to storage atproducers’ level <strong>and</strong> there<strong>in</strong> storage, is given <strong>in</strong> the follow<strong>in</strong>g Table No. 26TABLE NO. 26LOSSES OF RAGI AT PRODUCERS LEVEL(AVERAGE 1996-97, 1997-98 <strong>and</strong> 1998-99)(‘000 tonnes)Percent to totalproductionS.No. Item Quantitylost1. Losses <strong>in</strong> transport from field to thresh<strong>in</strong>g floor 14.10 0.622. Losses <strong>in</strong> thresh<strong>in</strong>g 17.53 0.773. Losses <strong>in</strong> w<strong>in</strong>now<strong>in</strong>g 17.43 0.764. Losses <strong>in</strong> transport from thresh<strong>in</strong>g floor to storage 25.77 1.135. Losses <strong>in</strong> storage at producers level 12.07 0.536. Total <strong>losses</strong> at producers level 86.90 3.81As stated earlier, the study <strong>of</strong> <strong>post</strong>-<strong>harvest</strong> <strong>losses</strong> had been conf<strong>in</strong>ed to the <strong>losses</strong> at the producers’level, stretch<strong>in</strong>g from transport from the field after <strong>harvest</strong> to the thresh<strong>in</strong>g floor, <strong>and</strong> thereafter uptostorage at producers level <strong>and</strong> not beyond that. The study did not cover the <strong>losses</strong> <strong>in</strong> transport fromthe farmer’s storage to market for sale, <strong>in</strong> the market <strong>and</strong> thereafter <strong>in</strong> the process <strong>of</strong> distribution. Thetotal <strong>post</strong> <strong>harvest</strong> <strong>losses</strong> <strong>of</strong> Ragi at producers’ level, as depicted <strong>in</strong> Table above, were estimated at3.81 percent <strong>of</strong> the production.6.1.2 A reference to Annexure XXIV shows that the <strong>losses</strong> <strong>in</strong> thresh<strong>in</strong>g by mechanical means amounted to1.13 thous<strong>and</strong> tonnes (0.05percent <strong>of</strong> production), by animal power to 9.86 thous<strong>and</strong> tonnes <strong>and</strong> bymanual means to 6.53 thous<strong>and</strong> tonnes.6.1.3 In w<strong>in</strong>now<strong>in</strong>g, the total loss <strong>of</strong> Ragi was estimated at 17.43 thous<strong>and</strong> tonnes (0.76 percent) <strong>of</strong>production – Annexure XXV.6.1.4 In transport at farm level, it is observed that the <strong>losses</strong> <strong>of</strong> Ragi <strong>in</strong> transport from field to thresh<strong>in</strong>gfloor amounted to 14.10 thous<strong>and</strong> tonnes <strong>of</strong> total production or 0.62 percent by various modes <strong>of</strong>transport used (Annexures XXVII & XXVIII).
Losses <strong>of</strong> Ragi Dur<strong>in</strong>g Storage <strong>and</strong> Their Causes(Qantity <strong>in</strong> '000 tonnes <strong>and</strong> percentage <strong>of</strong> total production)0.45(0.02%)1.29(0.06%)2.57(0.11%)1.69(0.07%)6.07(0.27%)DriageRodentsInfestationH<strong>and</strong>l<strong>in</strong>gQuality Deterioration
6.1.5 In transport from thresh<strong>in</strong>g floor to farm storage, the total loss <strong>of</strong> Ragi was 25.77 thous<strong>and</strong> tonnes <strong>of</strong>total production (Annexure XXIX) or 1.13 percent.6.1.6 The total <strong>losses</strong> <strong>of</strong> Ragi <strong>in</strong> transport from field to farm storage amounted to 39.87 thous<strong>and</strong> tonnes <strong>of</strong>total production (Annexure XXXI) or 1.75 percent.6.1.7 Dur<strong>in</strong>g the study <strong>of</strong> <strong>losses</strong> <strong>of</strong> Ragi <strong>in</strong> storage, the startl<strong>in</strong>g fact com<strong>in</strong>g to fore was that nearly 68.71percent <strong>of</strong> the storage at the farm household cont<strong>in</strong>ued to be <strong>in</strong> kutcha storage <strong>and</strong> 31.29 percentstorage was pucca. The total quantity stored <strong>in</strong> kutcha godown at farm level was 821.87 thous<strong>and</strong>tonnes <strong>and</strong> <strong>in</strong> pucca storage 374.19 thous<strong>and</strong> tonnes (Annexure XXXIII).6.1.8 The total quantity <strong>of</strong> Ragi lost <strong>in</strong> storage was estimated at 12.07 thous<strong>and</strong> tonnes. (Annexure XXXII)which was 0.53 percent <strong>of</strong> total production. The <strong>losses</strong> <strong>in</strong> storage were attributable to driage,rodents, <strong>in</strong>festation, h<strong>and</strong>l<strong>in</strong>g, etc.6.1.9 The total <strong>post</strong> <strong>harvest</strong> <strong>losses</strong> <strong>of</strong> Ragi at producers level were estimated at 86.90 thous<strong>and</strong> tonnes or3.81% <strong>of</strong> production (Annexure XXXVIII). It is to be noted here that the period <strong>of</strong> storage <strong>and</strong>quantity stored was small. Therefore, the storage <strong>losses</strong> at producer’s level appeared 3.81 percent.However, there is a scope to further curtail these <strong>losses</strong> at farm level by scientific storagepractices.
Total Sale <strong>of</strong> Ragi - Quarterwise(Qantity <strong>in</strong> '000 tonnes <strong>and</strong> percentage <strong>of</strong> total production)44.66(1.96%)0.02(0.001%)227.07(9.95%)381.58(16.72%)First QuarterSecond QuarterThird QuarterFourth Quarter
CHAPTER – VIIMARKETED SURPLUS7.1 The farm households resort to sale <strong>of</strong> Ragi over a period <strong>of</strong> time depend<strong>in</strong>g upon the needs. Thesmall category farmers, who are hard pressed to meet the f<strong>in</strong>ancial obligations resort to, distresssales – immediately after <strong>harvest</strong>, whereas the farmers with better hold<strong>in</strong>g capacity dispose <strong>of</strong> theproduce, when the market is favourable. The total produce sold by the farm households is termed asthe marketed <strong>surplus</strong>, i.e., the <strong>surplus</strong> <strong>of</strong> produce, which is sold <strong>in</strong> the market irrespective <strong>of</strong> theactual requirement <strong>of</strong> the farm households. This is the quantity, which is made available forconsumption to the non-farm<strong>in</strong>g population <strong>in</strong>clud<strong>in</strong>g the buy-back by the farm households. Dur<strong>in</strong>gthe survey, the follow<strong>in</strong>g aspects <strong>of</strong> the sales by the farm households were studied :i) Periodicity;ii) Agencies to whom sold;iii) Sale with<strong>in</strong> the village; <strong>and</strong>iv) Sale outside the village.7.2 PERIODICITY OF SALESThe state-wise <strong>and</strong> quarter-wise, estimated sales <strong>of</strong> Ragi by the different categories <strong>of</strong> cultivators arefurnished <strong>in</strong> Annexures XXXIX, XXXX & XXXXI <strong>and</strong> for all categories <strong>of</strong> cultivators, takentogether, are furnished <strong>in</strong> Annexure – XXXXII. Extract <strong>of</strong> these Annexures is given <strong>in</strong> Table No. 27:TABLE NO. 27SALES OF RAGI(AVERAGE 1996-97, 1997-98 <strong>and</strong> 1998-99).(‘000 tonnes)S. No. QuarterQuarter-wise sales <strong>of</strong> RagiCategorySmall Medium Large Total1. 1 st Quarter 0.00(0.00)0.00(0.00)0.02(0.01)0.02(0.003)2. 2 nd Quarter 57.64(30.95)65.65(29.11)103.78(42.97)227.07(34.76)3. 3 rd Quarter 121.89(65.44)142.65(63.24)117.04(48.46)381.58(58.41)4. 4 th Quarter 6.7317.26 20.67 44.66(3.61)Total 186.26(100.00)(7.65)225.56(100.00)(8.56)241.51(100.00)(6.83)653.33(100.00)It has been observed that 58.41 percent sales <strong>of</strong> Ragi were effected dur<strong>in</strong>g 3 rd quarter followed by34.76 percent <strong>in</strong> 2 nd quarter.7.3 AGENCIES TO WHOM SOLDThe state-wise details <strong>of</strong> agencywise sales <strong>of</strong> Ragi by cultivators <strong>of</strong> small category, medium category,large category <strong>and</strong> total <strong>of</strong> all categories, taken together, are furnished <strong>in</strong> Annexures XXXXIII,XXXXIV, XXXXV <strong>and</strong> XXXXVI respectively. A summary <strong>of</strong> these Annexures is furnished <strong>in</strong> TableNo. 28.
Sale <strong>of</strong> Ragi - Agencywise(Qantity <strong>in</strong> '000 tonnes <strong>and</strong> percentage <strong>of</strong> total production)1.22(0.05%)58.00(2.54%)0.00(0.00%)22.62(0.99%)35.2(1.54%)536.29(23.49%)ConsumersTradersCo-operativesF.C.I.Money LendersOthers
TABLE NO. 28SALES TO VARIOUS AGENCIES.(AVERAGE 1996-97, 1997-98 <strong>and</strong> 1998-99).(‘000 tonnes)S. No. AgencyQuantity soldCategorySmall Medium Large Total1 2 3 4 5 61 Consumers 13.81(7.41)10.57(4.69)10.82(4.48)35.20(5.39)2 Traders 146.35(78.57)176.38(78.19)213.56(88.43)536.29(82.09)3 Co-operatives 2.19(1.18)19.86(8.80)0.57(0.24)22.62(3.46)4 F.C.I. 0.00(0.00)0.00(0.00)0.00(0.00)0.00(0.00)5 Money Lenders 23.91(12.84)18.76(8.32)15.33(6.35)58.00(8.88)6 Others 0.00(0.00)0.00(0.00)1.22(0.50)1.22(0.18)Total 186.26(100.00)225.57(100.00)241.50(100.00)653.33(100.00)The survey revealed that the direct sales <strong>of</strong> Ragi by the producers to the consumers washardly 5.39 percent <strong>and</strong> producers to co-operatives, 3.46 percent. The major share <strong>of</strong> thesesales was to the traders i.e. 82.09 percent. It is a matter <strong>of</strong> <strong>in</strong>trospection for the cooperatives<strong>and</strong> FCI to evaluate their role <strong>in</strong> market<strong>in</strong>g <strong>of</strong> gra<strong>in</strong>s for the benefit <strong>of</strong> thefarm<strong>in</strong>g community. The Annexures XXXXVI showed that the role <strong>of</strong> co-operatives appearedonly <strong>in</strong> Karnataka.7.4 SALES OF RAGI WITHIN VILLAGESThe state-wise estimates <strong>of</strong> sales <strong>of</strong> Ragi with<strong>in</strong> villages quarter-wise <strong>and</strong> category-wise arepresented <strong>in</strong> Annexures XXXXVII, XXXXVIII <strong>and</strong> XXXXIX <strong>and</strong> total <strong>of</strong> all categories <strong>of</strong>cultivators taken together <strong>in</strong> Annexure L. A gist <strong>of</strong> the same is furnished <strong>in</strong> Table No. 29 below:TABLE NO. 29SALES OF RAGI WITHIN VILLAGE(AVERAGE 1996-97, 1997-98 <strong>and</strong> 1998-99).(‘000 tonnes)S. No. QuarterSales with<strong>in</strong> villageCategorySmall Medium Large Total1. 1 st Quarter 0.00(0.00)0.00(0.00)0.02(0.003)0.02(0.001)2. 2 nd Quarter 29.36(3.48)30.70(4.57)76.71(9.99)136.77(5.99)3. 3 rd Quarter 63.10(7.48)60.96(9.08)89.00(11.59)213.06(9.33)4. 4 th Quarter 4.24(0.50)7.35(1.10)17.32(2.26)28.91(1.27)Total 96.70(11.46)99.01(14.75)183.05(23.84)378.76(16.59)(Figures <strong>in</strong> parenthesis are percentage to production <strong>of</strong> category).It was observed that out <strong>of</strong> the total sales <strong>of</strong> 653.33 thous<strong>and</strong> tonnes <strong>of</strong> Ragi, the quantity sold with<strong>in</strong>village was 378.76 thous<strong>and</strong> tonnes or 57.97 percent <strong>of</strong> the total sales.
Sale <strong>of</strong> Paddy - With<strong>in</strong> Village <strong>and</strong> Outside Village <strong>of</strong> Ragi(Qantity <strong>in</strong> '000 tonnes <strong>and</strong> percentage <strong>of</strong> total production)250213.06(9.33%)200168.52(7.38%)150136.77(5.99%)Quantity10090.39(3.96%)5028.91(1.27%)15.75(0.69&)00.02(0.001%)With<strong>in</strong> Village0.00(0.00%)Outside VillageFirst QuarterSecond QuarterThird QuarterFourth Quarter
7.5 SALES OF RAGI OUTSIDE THE VILLAGEThe estimates <strong>of</strong> quarter-wise <strong>and</strong> category-wise sales <strong>of</strong> Ragi outside the village <strong>in</strong> different states <strong>of</strong> thecountry are furnished <strong>in</strong> Annexure LI, LII, LIII <strong>and</strong> for all categories <strong>of</strong> cultivators, taken together, <strong>in</strong>Annexure LIV. A summary <strong>of</strong> these estimates is furnished <strong>in</strong> Table No. 30.TABLE NO. 30SALES OF RAGI OUTSIDE THE VILLAGE(AVERAGE 1996-97, 1997-98 <strong>and</strong> 1998-99).(‘000 tonnes)S. No. QuarterSales outside the villageCategorySmall Medium Large Total1. 1 st Quarter 0.00(0.00)0.00(0.00)0.00(0.00)0.00(0.00)2. 2 ND Quarter 28.28(3.35)34.95(5.21)27.07(3.53)90.30(3.96)3. 3 rd Quarter 58.79(6.97)81.69(12.17)28.04(3.65)168.52(7.38)4. 4 th Quarter 2.49(0.30)9.91(1.48)3.35(0.44)15.75(0.69)Total 89.56(10.62)126.55(18.86)58.46(7.62)274.57(12.03)(Figures <strong>in</strong> parenthesis are percentage to category <strong>of</strong> production).Perusal <strong>of</strong> contents <strong>of</strong> Table No. 31 <strong>and</strong> Table No. 32 shows that out <strong>of</strong> total sales <strong>of</strong> 653.33thous<strong>and</strong> tonnes <strong>of</strong> Ragi, the sales with<strong>in</strong> the village were 378.76 thous<strong>and</strong> tonnes (57.97 percent)<strong>and</strong> outside the village were 274.57 thous<strong>and</strong> tonnes (42.03 percent). This clearly establishes theneed for development <strong>of</strong> <strong>in</strong>frastructural facilities at the village level to serve the <strong>in</strong>terests <strong>of</strong> thefarm households. It is also necessary to shift the focus <strong>of</strong> development from urban marketcentres (largely developed) to the rural market centres.7.6 STATE-WISE SALES OF RAGI (MARKETED SURPLUS)State-wise break-up <strong>of</strong> total sales <strong>of</strong> Ragi by all categories <strong>of</strong> cultivators, taken together, is furnished<strong>in</strong> Table No. 31.TABLE NO. 31STATE-WISE BREAK-UP OF TOTAL SALES OF RAGI(AVERAGE 1996-97, 1997-98 <strong>and</strong> 1998-99).(‘000 tonnes)Percentage tototal productionS. No. State TotalproductionTotal sales1 Andhra Pradesh 134.64 84.05 62.432 Arunachal Pradesh 0.00 0.00 0.003 Assam 0.00 0.00 0.004 Bihar 69.88 0.00 0.005 Goa 0.00 0.00 0.006 Gujarat 20.79 3.52 16.937 Haryana 0.00 0.00 0.008 Himachal Pradesh 6.46 0.00 0.009 Jammu & Kashmir 0.00 0.00 0.0010 Karnataka 1315.97 426.05 32.3811 Kerala 0.00 0.00 0.0012 Madhya Pradesh 3.69 0.61 16.53
13 Maharashtra 158.82 27.12 17.0814 Manipur 0.00 0.00 0.0015 Meghalaya 0.00 0.00 0.0016 Mizoram 0.00 0.00 0.0017 Nagal<strong>and</strong> 0.00 0.00 0.0018 Orissa 60.44 15.56 25.7419 Punjab 0.00 0.00 0.0020 Rajasthan 0.00 0.00 0.0021 Sikkim 0.00 0.00 0.0022 Tamil Nadu 299.33 62.69 20.9423 Tripura 0.00 0.00 0.0024 Uttar Pradesh 212.82 33.73 15.8525 West Bengal 0.00 0.00 0.0026 ALL INDIA 2282.84 653.34 28.62The contribution to the overall marketed <strong>surplus</strong> <strong>of</strong> Ragi by different states is further analysed<strong>and</strong> presented <strong>in</strong> the follow<strong>in</strong>g table No. 32.TABLE NO. 32CONTRIBUTION TO THE MARKETED SURPLUS(AVERAGE 1996-97, 1997-98 <strong>and</strong> 1998-99).(‘000 tonnes)S. No. Contribution States1. More than 400 Karnataka (426.05)2. 50-400 Andhra Pradesh (84.05)Tamil Nadu (62.69)3. 10-50 Uttar Pradesh (33.73)Maharashtra (27.12)Orissa (15.56)4. Less than 10 Gujarat (3.52)Madhya Pradesh (0.61)
Production, Utilisation <strong>and</strong> Marketable Surplus <strong>of</strong> Ragi(Qantity <strong>in</strong> '000 tonnes <strong>and</strong> percentage <strong>of</strong> total production)2500.002282.84(100.00%)2000.001612.72(70.64%)1500.00Quantity1000.00670.14(29.36%)500.000.001Estimated ProductionEstimated UtilisationEstimated Marketable Surplus
CHAPTER VIIIMARKETABLE SURPLUS8.1 In earlier chapters, the estimates <strong>of</strong> production, retention for various purposes, purchases, <strong>losses</strong>,sales or marketed <strong>surplus</strong>, etc., have been discussed. In this chapter, estimates <strong>of</strong> <strong>marketable</strong> <strong>surplus</strong>are discussed. Marketable Surplus is derived from the formula :MS = A-BWhere A is total production;B is total retention, plus total purchases <strong>and</strong> total <strong>losses</strong> at farm level or producers level.MS is <strong>marketable</strong> Surplus.8.2 The estimated <strong>marketable</strong> <strong>surplus</strong> – category-wise <strong>and</strong> total <strong>of</strong> all categories <strong>of</strong> farmers takentogether is furnished <strong>in</strong> Annexures LV, LVI, LVII <strong>and</strong> LVIII respectively. Summary there<strong>of</strong> on allIndia basis is furnished <strong>in</strong> Table No. 33.TABLE NO. 33TOTAL FARM FAMILY REQUIREMENT AND ESTIMATED MARKETABLE SURPLUS.(AVERAGE 1996-97, 97-98 <strong>and</strong> 98-99).(‘000 tonnes)S. No. Category TotalproductionATotal farm-familyrequirement <strong>in</strong>clud<strong>in</strong>g<strong>losses</strong>BMarketable<strong>surplus</strong>(A-B)(1) (2) (3) (4) (5)1. Small 844.01 648.59(76.85)195.42(23.15)2. Medium 671.14 441.74(65.82)229.40(34.18)3. Large 767.69 522.37(68.04)245.32(31.96)Total 2282.84 1612.70(70.64)(Figures <strong>in</strong> parenthesis are percentage to total production)670.14(29.36)8.3 The total farm-family requirement <strong>in</strong>clud<strong>in</strong>g <strong>losses</strong> <strong>of</strong> Ragi was 1612.70 thous<strong>and</strong> tonnes i.e., 70.64percent <strong>of</strong> total production <strong>of</strong> Ragi. Similarly, the total <strong>marketable</strong> <strong>surplus</strong> <strong>of</strong> Ragi was 670.14thous<strong>and</strong> tonnes i.e., 29.36 percent <strong>of</strong> the production.8.4 A comparative analysis <strong>of</strong> Marketable Surplus <strong>and</strong> Marketed Surplus estimates by differentcategories <strong>of</strong> cultivators is presented <strong>in</strong> the follow<strong>in</strong>g table No. 34.
S.No.CategoryTotalproductionATABLE NO. 34MARKETABLE SURPLUS OF RAGI(AVERAGE 1996-97, 97-98 <strong>and</strong> 98-99).Total farm-familyrequirement <strong>in</strong>clud<strong>in</strong>g <strong>losses</strong>BMarketable <strong>surplus</strong>(‘000 tonnes)Marketed <strong>surplus</strong>(A-B). Quantity % Quantity % Quantity %1 Small 844.01 648.59 76.85 195.42 23.15 186.26 22.072 Medium 671.14 441.74 65.82 229.40 34.18 225.57 33.613 Large 767.69 5222.37 68.04 245.32 31.96 241.51 31.46Total 2282.84 1612.70 70.64 670.14 29.36 653.34 28.628.5 It has been observed that out <strong>of</strong> total estimated production <strong>of</strong> 2282.84 thous<strong>and</strong> tonnes <strong>of</strong> Ragi, thetotal farm-family requirement, <strong>in</strong>clud<strong>in</strong>g <strong>losses</strong>, was 1612.70 thous<strong>and</strong> tonnes or 70.64 percent. The<strong>marketable</strong> <strong>surplus</strong> was estimated at 670.14 thous<strong>and</strong> tonnes, which was 29.36 percent. As aga<strong>in</strong>st
Production, Marketable Surplus <strong>and</strong> Marketd Surplus<strong>of</strong> Ragi(Qantity <strong>in</strong> '000 tonnes <strong>and</strong> percentage <strong>of</strong> total production)2500.002282.84(100.00%)2000.001500.00Quantity1000.00670.14(29.36%) 653.34(28.62%)500.000.001ProductionMarketable SurplusMarketed Surplusthis, the marketed <strong>surplus</strong> was 28.62 percent or 653.34 thous<strong>and</strong> tonnes. This meant that 16.80
thous<strong>and</strong> tonnes (0.74 percent) <strong>of</strong> Ragi was unsold <strong>and</strong> was on an average carry-over <strong>of</strong> stocks withthe farmers.8.6 As per the previous survey <strong>of</strong> 1972, the average number <strong>of</strong> family members per farm-familyhousehold was 6.26, whereas, the present survey showed that the average number <strong>of</strong> members perfarm-family household was 6.45. Therefore, there was marg<strong>in</strong>al <strong>in</strong>crease <strong>in</strong> farm-family size.8.7 State-wise break up <strong>of</strong> the estimates <strong>of</strong> production, total farm-family requirement <strong>in</strong>clud<strong>in</strong>g <strong>losses</strong> atfarm level, <strong>marketable</strong> <strong>surplus</strong> <strong>and</strong> marketed <strong>surplus</strong> is presented <strong>in</strong> Table No. 35.TABLE NO. 35STATE-WISE BREAK UP OF PRODUCTION, FARM FAMILYREQUIREMENT, MARKETABLE SURPLUS AND MARKETED SURPLUS OF RAGI.(AVERAGE 1996-97, 97-98 <strong>and</strong> 98-99).S. No State Total.Production.Total farm familyrequirement<strong>in</strong>clud<strong>in</strong>g <strong>losses</strong>(‘000 tonnes)Marketed <strong>surplus</strong> Marketable <strong>surplus</strong>Quantity % Quantity % Quantity %1 2 3 4 5 6 7 8 91 Andhra Pradesh 134.64 49.89 37.05 84.05 62.43 84.75 62.952 Arunachal Pradesh 0.00 0.00 0.00 0.00 0.00 0.00 0.003 Assam 0.00 0.00 0.00 0.00 0.00 0.00 0.004 Bihar 69.88 69.42 99.34 0.00 0.00 0.46 0.665 Goa 0.00 0.00 0.00 0.00 0.00 0.00 0.006 Gujarat 20.79 17.07 82.11 3.52 16.93 3.72 17.897 Haryana 0.00 0.00 0.00 0.00 0.00 0.00 0.008 Himachal Pradesh 6.46 6.28 97.21 0.00 0.00 0.18 2.799 Jammu & Kashmir 0.00 0.00 0.00 0.00 0.00 0.00 0.0010 Karnataka 1315.97 882.47 67.06 426.05 32.38 433.50 32.9411 Kerala 0.00 0.00 0.00 0.00 0.00 0.00 0.0012 Madhya Pradesh 3.69 3.07 83.20 0.61 16.53 0.62 16.8013 Maharashtra 158.82 130.79 82.35 27.12 17.08 28.03 17.6514 Manipur 0.00 0.00 0.00 0.00 0.00 0.00 0.0015 Meghalaya 0.00 0.00 0.00 0.00 0.00 0.00 0.0016 Mizoram 0.00 0.00 0.00 0.00 0.00 0.00 0.0017 Nagal<strong>and</strong> 0.00 0.00 0.00 0.00 0.00 0.00 0.0018 Orissa 60.44 44.63 73.84 15.56 25.74 15.81 26.1619 Punjab 0.00 0.00 0.00 0.00 0.00 0.00 0.0020 Rajasthan 0.00 0.00 0.00 0.00 0.00 0.00 0.0021 Sikkim 0.00 0.00 0.00 0.00 0.00 0.00 0.0022 Tamil Nadu 299.33 235.10 78.54 62.69 20.94 64.23 21.4623 Tripura 0.00 0.00 0.00 0.00 0.00 0.00 0.0024 Uttar Pradesh 212.82 173.98 81.75 33.73 15.85 38.84 18.2525 West Bengal 0.00 0.00 0.00 0.00 0.00 0.00 0.0026 ALL INDIA 2282.84 1612.70 70.64 653.34 28.62 670.14 29.368.8 The startl<strong>in</strong>g fact to be noted here was that the states like Andhra Pradesh had more than 60 percent<strong>marketable</strong> <strong>surplus</strong>. In states like Karnataka, Orissa <strong>and</strong> Tamil Nadu, the <strong>marketable</strong> <strong>surplus</strong> wasmore than 20 percent8.9 The <strong>in</strong>creased production obviously needs strengthen<strong>in</strong>g <strong>of</strong> agricultural market<strong>in</strong>g system bydevelopment <strong>of</strong> <strong>in</strong>frastructure <strong>and</strong> facilities, dissem<strong>in</strong>ation <strong>of</strong> knowledge for pr<strong>of</strong>itable market<strong>in</strong>g,support<strong>in</strong>g services like grad<strong>in</strong>g, storage <strong>and</strong> f<strong>in</strong>ance etc. It is necessary to improve market<strong>in</strong>gefficiency by reduc<strong>in</strong>g market<strong>in</strong>g costs, improved physical <strong>in</strong>frastructure <strong>and</strong> thus facilitat<strong>in</strong>g betterreturns to the farmer.
Annexure – I Area under Ragi – Irrigated/Unirrigated(Triennium end<strong>in</strong>g 1998-99)(<strong>in</strong> ‘000 hect.)Category <strong>of</strong> cultivatorS No Name <strong>of</strong> stateSmall Medium Large AllIrrigated Unirrigated Total area Irrigated Unirrigated Total area Irrigated Unirrigated Total area Irrigated Unirrigated Total area1 2 3 4 5 6 7 8 9 10 11 12 13 141 Andhra Pradesh 0.00 50.61 50.61 0.00 55.30 55.30 0.00 27.75 27.75 0.00 133.66 133.662 Arunachal Pradesh 0.00 0.00 0.00 0.00 0.00 0.00 0.00 0.00 0.00 0.00 0.00 0.003 Assam 0.00 0.00 0.00 0.00 0.00 0.00 0.00 0.00 0.00 0.00 0.00 0.004 Bihar 2.09 15.60 17.69 2.12 18.40 20.52 2.87 28.74 31.61 7.08 62.74 69.825 Goa 0.00 0.00 0.00 0.00 0.00 0.00 0.00 0.00 0.00 0.00 0.00 0.006 Gujarat 10.00 0.00 10.00 8.00 0.00 8.00 1.67 0.00 1.67 19.67 0.00 19.677 Haryana 0.00 0.00 0.00 0.00 0.00 0.00 0.00 0.00 0.00 0.00 0.00 0.008 Himachal Pradesh 0.00 2.24 2.24 0.00 2.12 2.12 0.00 1.47 1.47 0.00 5.83 5.839 Jammu <strong>and</strong> Kashmir 0.00 0.00 0.00 0.00 0.00 0.00 0.00 0.00 0.00 0.00 0.00 0.0010 Karnataka 32.58 287.48 320.06 24.33 209.42 233.75 24.19 244.48 268.67 81.10 741.38 822.4811 Kerala 0.00 0.00 0.00 0.00 0.00 0.00 0.00 0.00 0.00 0.00 0.00 0.0012 Madhya Pradesh 0.00 3.00 3.00 0.00 0.75 0.75 0.00 8.39 8.39 0.00 12.14 12.1413 Maharashtra 0.00 52.00 52.00 0.00 52.30 52.30 0.00 50.00 50.00 0.00 154.30 154.3014 Manipur 0.00 0.00 0.00 0.00 0.00 0.00 0.00 0.00 0.00 0.00 0.00 0.0015 Meghalaya 0.00 0.00 0.00 0.00 0.00 0.00 0.00 0.00 0.00 0.00 0.00 0.0016 Mizoram 0.00 0.00 0.00 0.00 0.00 0.00 0.00 0.00 0.00 0.00 0.00 0.0017 Nagal<strong>and</strong> 0.00 0.00 0.00 0.00 0.00 0.00 0.00 0.00 0.00 0.00 0.00 0.0018 Orissa 0.00 28.48 28.48 0.00 28.18 28.18 0.00 25.74 25.74 0.00 82.40 82.4019 Punjab 0.00 0.00 0.00 0.00 0.00 0.00 0.00 0.00 0.00 0.00 0.00 0.0020 Rajasthan 0.00 0.00 0.00 0.00 0.00 0.00 0.00 0.00 0.00 0.00 0.00 0.0021 Sikkim 0.00 0.00 0.00 0.00 0.00 0.00 0.00 0.00 0.00 0.00 0.00 0.0022 Tamil Nadu 41.67 17.46 59.13 20.33 21.58 41.91 26.68 16.68 43.36 88.68 55.72 144.4023 Tripura 0.00 0.00 0.00 0.00 0.00 0.00 0.00 0.00 0.00 0.00 0.00 0.0024 Uttar Pradesh 0.67 60.73 61.40 1.78 31.06 32.84 12.12 36.09 48.21 14.57 127.88 142.4525 West Bengal 0.00 0.00 0.00 0.00 0.00 0.00 0.00 0.00 0.00 0.00 0.00 0.0026 ALL INDIA 87.01 517.60 604.61 56.56 419.11 475.67 67.53 439.34 506.87 211.10 1376.05 1587.15
Annexure – IIArea under Ragi – High Yield<strong>in</strong>g Varieties <strong>and</strong> Traditional varieties (TV)(Triennium end<strong>in</strong>g 1998-99)(<strong>in</strong> ‘000 hect.)Category <strong>of</strong> cultivatorSmall Medium Large AllS.No. Name <strong>of</strong> state HYV TV Total area HYV TV Total area HYV TV Total area HYV TV Total area1 2 3 4 5 6 7 8 9 10 11 12 13 141 Andhra Pradesh 0.00 50.61 50.61 0.00 55.30 55.30 0.00 27.75 27.75 0.00 133.66 133.662 Arunachal Pradesh 0.00 0.00 0.00 0.00 0.00 0.00 0.00 0.00 0.00 0.00 0.00 0.003 Assam 0.00 0.00 0.00 0.00 0.00 0.00 0.00 0.00 0.00 0.00 0.00 0.004 Bihar 2.39 15.30 17.69 2.72 17.80 20.52 3.01 28.60 31.61 8.12 61.70 69.825 Goa 0.00 0.00 0.00 0.00 0.00 0.00 0.00 0.00 0.00 0.00 0.00 0.006 Gujarat 10.00 0.00 10.00 8.00 0.00 8.00 1.67 0.00 1.67 19.67 0.00 19.677 Haryana 0.00 0.00 0.00 0.00 0.00 0.00 0.00 0.00 0.00 0.00 0.00 0.008 Himachal Pradesh 0.00 2.24 2.24 0.00 2.12 2.12 0.00 1.47 1.47 0.00 5.83 5.839 Jammu <strong>and</strong> Kashmir 0.00 0.00 0.00 0.00 0.00 0.00 0.00 0.00 0.00 0.00 0.00 0.0010 Karnataka 276.00 44.06 320.06 195.00 38.75 233.75 176.67 92.00 268.67 647.67 174.81 822.4811 Kerala 0.00 0.00 0.00 0.00 0.00 0.00 0.00 0.00 0.00 0.00 0.00 0.0012 Madhya Pradesh 0.00 3.00 3.00 0.00 0.75 0.75 0.00 8.39 8.39 0.00 12.14 12.1413 Maharashtra 0.00 52.00 52.00 0.00 52.30 52.30 0.00 50.00 50.00 0.00 154.30 154.3014 Manipur 0.00 0.00 0.00 0.00 0.00 0.00 0.00 0.00 0.00 0.00 0.00 0.0015 Meghalaya 0.00 0.00 0.00 0.00 0.00 0.00 0.00 0.00 0.00 0.00 0.00 0.0016 Mizoram 0.00 0.00 0.00 0.00 0.00 0.00 0.00 0.00 0.00 0.00 0.00 0.0017 Nagal<strong>and</strong> 0.00 0.00 0.00 0.00 0.00 0.00 0.00 0.00 0.00 0.00 0.00 0.0018 Orissa 9.24 19.24 28.48 9.03 19.15 28.18 10.72 15.02 25.74 28.99 53.41 82.4019 Punjab 0.00 0.00 0.00 0.00 0.00 0.00 0.00 0.00 0.00 0.00 0.00 0.0020 Rajasthan 0.00 0.00 0.00 0.00 0.00 0.00 0.00 0.00 0.00 0.00 0.00 0.0021 Sikkim 0.00 0.00 0.00 0.00 0.00 0.00 0.00 0.00 0.00 0.00 0.00 0.0022 Tamil Nadu 52.64 6.49 59.13 38.73 3.18 41.91 40.38 2.98 43.36 131.75 12.65 144.4023 Tripura 0.00 0.00 0.00 0.00 0.00 0.00 0.00 0.00 0.00 0.00 0.00 0.0024 Uttar Pradesh 20.97 40.43 61.40 10.47 22.37 32.84 15.47 32.74 48.21 46.91 95.54 142.4525 West Bengal 0.00 0.00 0.00 0.00 0.00 0.00 0.00 0.00 0.00 0.00 0.00 0.0026 ALL INDIA 371.24 233.37 604.61 263.95 211.72 475.67 247.92 258.95 506.87 883.11 704.04 1587.15
Annexure – IIIS.No. Name <strong>of</strong> stateProduction <strong>of</strong> Ragi – Irrigated/Unirrigated(Triennium end<strong>in</strong>g 1998-99)(<strong>in</strong> ‘000 tonnes)Category <strong>of</strong> cultivatorSmall Medium Large AllIrrigated Unirrigated Total Irrigated Unirrigated Total Irrigated Unirrigated Total Irrigated Unirrigated Totalproductionproductionproductionproduction1 2 3 4 5 6 7 8 9 10 11 12 13 141 Andhra Pradesh 0.00 40.48 40.48 0.00 60.83 60.83 0.00 33.33 33.33 0.00 134.64 134.642 Arunachal Pradesh 0.00 0.00 0.00 0.00 0.00 0.00 0.00 0.00 0.00 0.00 0.00 0.003 Assam 0.00 0.00 0.00 0.00 0.00 0.00 0.00 0.00 0.00 0.00 0.00 0.004 Bihar 2.31 12.98 15.29 2.42 18.27 20.69 3.66 30.24 33.90 8.39 61.49 69.885 Goa 0.00 0.00 0.00 0.00 0.00 0.00 0.00 0.00 0.00 0.00 0.00 0.006 Gujarat 10.11 0.00 10.11 8.84 0.00 8.84 1.84 0.00 1.84 20.79 0.00 20.797 Haryana 0.00 0.00 0.00 0.00 0.00 0.00 0.00 0.00 0.00 0.00 0.00 0.008 Himachal Pradesh 0.00 2.47 2.47 0.00 2.37 2.37 0.00 1.62 1.62 0.00 6.46 6.469 Jammu <strong>and</strong> Kashmir 0.00 0.00 0.00 0.00 0.00 0.00 0.00 0.00 0.00 0.00 0.00 0.0010 Karnataka 66.88 432.41 499.29 51.72 317.66 369.38 59.82 387.48 447.30 178.42 1137.55 1315.9711 Kerala 0.00 0.00 0.00 0.00 0.00 0.00 0.00 0.00 0.00 0.00 0.00 0.0012 Madhya Pradesh 0.00 0.92 0.92 0.00 0.25 0.25 0.00 2.52 2.52 0.00 3.69 3.6913 Maharashtra 0.00 52.17 52.17 0.00 52.23 52.23 0.00 54.42 54.42 0.00 158.82 158.8214 Manipur 0.00 0.00 0.00 0.00 0.00 0.00 0.00 0.00 0.00 0.00 0.00 0.0015 Meghalaya 0.00 0.00 0.00 0.00 0.00 0.00 0.00 0.00 0.00 0.00 0.00 0.0016 Mizoram 0.00 0.00 0.00 0.00 0.00 0.00 0.00 0.00 0.00 0.00 0.00 0.0017 Nagal<strong>and</strong> 0.00 0.00 0.00 0.00 0.00 0.00 0.00 0.00 0.00 0.00 0.00 0.0018 Orissa 0.00 19.94 19.94 0.00 21.14 21.14 0.00 19.36 19.36 0.00 60.44 60.4419 Punjab 0.00 0.00 0.00 0.00 0.00 0.00 0.00 0.00 0.00 0.00 0.00 0.0020 Rajasthan 0.00 0.00 0.00 0.00 0.00 0.00 0.00 0.00 0.00 0.00 0.00 0.0021 Sikkim 0.00 0.00 0.00 0.00 0.00 0.00 0.00 0.00 0.00 0.00 0.00 0.0022 Tamil Nadu 99.22 18.16 117.38 58.92 30.48 89.40 74.70 17.85 92.55 232.84 66.49 299.3323 Tripura 0.00 0.00 0.00 0.00 0.00 0.00 0.00 0.00 0.00 0.00 0.00 0.0024 Uttar Pradesh 1.28 84.68 85.96 3.52 42.49 46.01 24.57 56.28 80.85 29.37 183.45 212.8225 West Bengal 0.00 0.00 0.00 0.00 0.00 0.00 0.00 0.00 0.00 0.00 0.00 0.0026 All INDIA 179.80 664.21 844.01 125.42 545.72 671.14 164.59 603.10 767.69 469.81 1813.03 2282.84
Annexure – IVProduction <strong>of</strong> Ragi – High Yield<strong>in</strong>g Varieties (HYV) <strong>and</strong> Traditional Varieties (TV)(Triennium end<strong>in</strong>g 1998-99) (<strong>in</strong> ‘000 tonnes)S.No. Name <strong>of</strong> stateCategory <strong>of</strong> cultivatorSmall Medium Large AllHYV TV Total HYV TV Total HYV TV Total HYV TV Totalproductionproductionproductionproduction1 2 3 4 5 6 7 8 9 10 11 12 13 141 Andhra Pradesh 0.00 40.48 40.48 0.00 60.83 60.83 0.00 33.33 33.33 0.00 134.64 134.642 Arunachal Pradesh 0.00 0.00 0.00 0.00 0.00 0.00 0.00 0.00 0.00 0.00 0.00 0.003 Assam 0.00 0.00 0.00 0.00 0.00 0.00 0.00 0.00 0.00 0.00 0.00 0.004 Bihar 4.17 11.12 15.29 4.84 15.85 20.69 5.42 28.48 33.90 14.43 55.45 69.885 Goa 0.00 0.00 0.00 0.00 0.00 0.00 0.00 0.00 0.00 0.00 0.00 0.006 Gujarat 10.11 0.00 10.11 8.84 0.00 8.84 1.84 0.00 1.84 20.79 0.00 20.797 Haryana 0.00 0.00 0.00 0.00 0.00 0.00 0.00 0.00 0.00 0.00 0.00 0.008 Himachal Pradesh 0.00 2.47 2.47 0.00 2.37 2.37 0.00 1.62 1.62 0.00 6.46 6.469 Jammu <strong>and</strong> Kashmir 0.00 0.00 0.00 0.00 0.00 0.00 0.00 0.00 0.00 0.00 0.00 0.0010 Karnataka 469.20 30.09 499.29 332.42 36.96 369.38 364.18 83.12 447.30 1165.80 150.17 1315.9711 Kerala 0.00 0.00 0.00 0.00 0.00 0.00 0.00 0.00 0.00 0.00 0.00 0.0012 Madhya Pradesh 0.00 0.92 0.92 0.00 0.25 0.25 0.00 2.52 2.52 0.00 3.69 3.6913 Maharashtra 0.00 52.17 52.17 0.00 52.23 52.23 0.00 54.42 54.42 0.00 158.82 158.8214 Manipur 0.00 0.00 0.00 0.00 0.00 0.00 0.00 0.00 0.00 0.00 0.00 0.0015 Meghalaya 0.00 0.00 0.00 0.00 0.00 0.00 0.00 0.00 0.00 0.00 0.00 0.0016 Mizoram 0.00 0.00 0.00 0.00 0.00 0.00 0.00 0.00 0.00 0.00 0.00 0.0017 Nagal<strong>and</strong> 0.00 0.00 0.00 0.00 0.00 0.00 0.00 0.00 0.00 0.00 0.00 0.0018 Orissa 9.72 10.22 19.94 9.97 11.17 21.14 11.80 7.56 19.36 31.49 28.95 60.4419 Punjab 0.00 0.00 0.00 0.00 0.00 0.00 0.00 0.00 0.00 0.00 0.00 0.0020 Rajasthan 0.00 0.00 0.00 0.00 0.00 0.00 0.00 0.00 0.00 0.00 0.00 0.0021 Sikkim 0.00 0.00 0.00 0.00 0.00 0.00 0.00 0.00 0.00 0.00 0.00 0.0022 Tamil Nadu 113.49 3.89 117.38 86.88 2.52 89.40 90.11 2.44 92.55 290.48 8.85 299.3323 Tripura 0.00 0.00 0.00 0.00 0.00 0.00 0.00 0.00 0.00 0.00 0.00 0.0024 Uttar Pradesh 37.44 48.52 85.96 19.08 26.93 46.01 35.02 45.83 80.85 91.54 121.28 212.8225 West Bengal 0.00 0.00 0.00 0.00 0.00 0.00 0.00 0.00 0.00 0.00 0.00 0.0026 ALL INDIA 644.13 199.88 844.01 462.03 209.11 671.14 508.37 259.32 767.69 1614.53 668.31 2282.84
Annexure – VRetention <strong>of</strong> Ragi for farm Family Consumption(Triennium end<strong>in</strong>g 1998-99) (<strong>in</strong> ‘000 tonnes)Category <strong>of</strong> cultivatorName <strong>of</strong> stateSmall Medium Large AllS.No.% to Production% to Production <strong>of</strong>% to Production <strong>of</strong>% to totalQuantity <strong>of</strong> category Quantity category Quantity category Quantity production1 2 3 4 5 6 7 8 9 101 Andhra Pradesh 26.47 65.40 9.50 15.62 4.60 13.79 40.57 30.132 Arunachal Pradesh 0.00 0.00 0.00 0.00 0.00 0.00 0.00 0.003 Assam 0.00 0.00 0.00 0.00 0.00 0.00 0.00 0.004 Bihar 13.18 86.17 16.76 80.99 27.40 80.84 57.34 82.055 Goa 0.00 0.00 0.00 0.00 0.00 0.00 0.00 0.006 Gujarat 7.89 78.04 6.64 75.14 1.36 74.01 15.89 76.437 Haryana 0.00 0.00 0.00 0.00 0.00 0.00 0.00 0.008 Himachal Pradesh 2.19 88.48 2.07 87.45 1.39 85.88 5.65 87.469 Jammu <strong>and</strong> Kashmir 0.00 0.00 0.00 0.00 0.00 0.00 0.00 0.0010 Karnataka 303.40 60.77 176.40 47.76 210.59 47.08 690.39 52.4611 Kerala 0.00 0.00 0.00 0.00 0.00 0.00 0.00 0.0012 Madhya Pradesh 0.69 74.47 0.18 72.07 1.75 69.55 2.62 71.0013 Maharashtra 43.01 82.45 40.42 77.38 40.75 74.88 124.18 78.1914 Manipur 0.00 0.00 0.00 0.00 0.00 0.00 0.00 0.0015 Meghalaya 0.00 0.00 0.00 0.00 0.00 0.00 0.00 0.0016 Nagal<strong>and</strong> 0.00 0.00 0.00 0.00 0.00 0.00 0.00 0.0017 Nagal<strong>and</strong> 0.00 0.00 0.00 0.00 0.00 0.00 0.00 0.0018 Orissa 11.22 56.25 13.07 61.81 11.60 59.94 35.89 59.3819 Punjab 0.00 0.00 0.00 0.00 0.00 0.00 0.00 0.0020 Rajasthan 0.00 0.00 0.00 0.00 0.00 0.00 0.00 0.0021 Sikkim 0.00 60.81 0.00 46.81 0.00 0.00 0.00 0.0022 Tamil Nadu 77.54 66.06 56.21 62.87 57.48 62.11 191.23 63.8923 Tripura 0.00 0.00 0.00 0.00 0.00 0.00 0.00 0.0024 Uttar Pradesh 63.11 73.42 27.07 58.84 48.29 59.73 138.47 65.0625 West Bengal 0.00 0.00 0.00 0.00 0.00 0.00 0.00 0.0026 ALL INDIA 548.70 65.01 348.32 51.90 405.21 52.78 1302.23 57.04
Annexure – VIRetention <strong>of</strong> Ragi for Consumption <strong>of</strong> Permanent Labour(Triennium end<strong>in</strong>g 1998-99)(<strong>in</strong> ‘000 tonnes)Category <strong>of</strong> CultivatorSmall Medium Large AllS.No. Name <strong>of</strong> state%to Production <strong>of</strong>%to Production <strong>of</strong>%to Production <strong>of</strong>%to total productionQuantity category Quantity category Quantity category Quantity1 2 3 4 5 6 7 8 9 101 Andhra Pradesh 0.00 0.00 0.00 0.00 0.00 0.00 0.00 0.002 Arunachal Pradesh 0.00 0.00 0.00 0.00 0.00 0.00 0.00 0.003 Assam 0.00 0.00 0.00 0.00 0.00 0.00 0.00 0.004 Bihar 0.00 0.00 0.00 0.00 0.00 0.00 0.00 0.005 Goa 0.00 0.00 0.00 0.00 0.00 0.00 0.00 0.006 Gujarat 0.00 0.00 0.00 0.00 0.00 0.00 0.00 0.007 Haryana 0.00 0.00 0.00 0.00 0.00 0.00 0.00 0.008 Himachal Pradesh 0.00 0.00 0.00 0.00 0.00 0.00 0.00 0.009 Jammu <strong>and</strong> Kashmir 0.00 0.00 0.00 0.00 0.00 0.00 0.00 0.0010 Karnataka 0.00 0.00 0.00 0.00 0.45 0.11 0.45 0.0311 Kerala 0.00 0.00 0.00 0.00 0.00 0.00 0.00 0.0012 Madhya Pradesh 0.00 0.00 0.00 0.00 0.00 0.00 0.00 0.0013 Maharashtra 0.00 0.00 0.00 0.00 0.00 0.00 0.00 0.0014 Manipur 0.00 0.00 0.00 0.00 0.00 0.00 0.00 0.0015 Meghalaya 0.00 0.00 0.00 0.00 0.00 0.00 0.00 0.0016 Mizoram 0.00 0.00 0.00 0.00 0.00 0.00 0.00 0.0017 Nagal<strong>and</strong> 0.00 0.00 0.00 0.00 0.00 0.00 0.00 0.0018 Orissa 0.00 0.00 0.00 0.00 0.00 0.00 0.00 0.0019 Punjab 0.00 0.00 0.00 0.00 0.00 0.00 0.00 0.0020 Rajasthan 0.00 0.00 0.00 0.00 0.00 0.00 0.00 0.0021 Sikkim 0.00 0.00 0.00 0.00 0.00 0.00 0.00 0.0022 Tamil Nadu 0.00 0.00 0.00 0.00 0.00 0.00 0.00 0.0023 Tripura 0.00 0.00 0.00 0.00 0.00 0.00 0.00 0.0024 Uttar Pradesh 0.00 0.00 0.00 0.00 0.00 0.00 0.00 0.0025 West Bengal 0.00 0.00 0.00 0.00 0.00 0.00 0.00 0.0026 ALL INDIA 0.00 0.00 0.00 0.00 0.45 0.06 0.45 0.02
Annexure – VIIRetention <strong>of</strong> Ragi for Consumption <strong>of</strong> Temporary Labour(Triennium end<strong>in</strong>g 1998-99)(<strong>in</strong> ‘000 tonnes)Category <strong>of</strong> cultivatorSmall Medium Large AllS.No. Name <strong>of</strong> statePercent to production <strong>of</strong>Percent to production <strong>of</strong> Percent to production <strong>of</strong> Percent to totalQuantity category Quantity category Quantity category Quantity production1 2 3 4 5 6 7 8 9 101 Andhra Pradesh 0.00 0.00 0.00 0.00 0.00 0.00 0.00 0.002 Arunachal Pradesh 0.00 0.00 0.00 0.00 0.00 0.00 0.00 0.003 Assam 0.00 0.00 0.00 0.00 0.00 0.00 0.00 0.004 Bihar 0.62 4.05 1.15 5.56 1.63 4.81 3.40 4.875 Goa 0.00 0.00 0.00 0.00 0.00 0.00 0.00 0.006 Gujarat 0.11 1.09 0.13 1.47 0.02 1.09 0.26 1.257 Haryana 0.00 0.00 0.00 0.00 0.00 0.00 0.00 0.008 Himachal Pradesh 0.06 2.43 0.06 2.53 0.05 3.09 0.17 2.639 Jammu <strong>and</strong> Kashmir 0.00 0.00 0.00 0.00 0.00 0.00 0.00 0.0010 Karnataka 22.08 4.42 22.61 6.12 27.64 6.18 72.33 5.5011 Kerala 0.00 0.00 0.00 0.00 0.00 0.00 0.00 0.0012 Madhya Pradesh 0.01 1.09 0.00 0.00 0.00 0.00 0.01 0.2713 Maharashtra 0.00 0.00 0.00 0.00 0.00 0.00 0.00 0.0014 Manipur 0.00 0.00 0.00 0.00 0.00 0.00 0.00 0.0015 Meghalaya 0.00 0.00 0.00 0.00 0.00 0.00 0.00 0.0016 Mizoram 0.00 0.00 0.00 0.00 0.00 0.00 0.00 0.0017 Nagal<strong>and</strong> 0.00 0.00 0.00 0.00 0.00 0.00 0.00 0.0018 Orissa 0.27 1.35 0.33 1.56 0.00 0.00 0.60 0.9919 Punjab 0.00 0.00 0.00 0.00 0.00 0.00 0.00 0.0020 Rajasthan 0.00 0.00 0.00 0.00 0.00 0.00 0.00 0.0021 Sikkim 0.00 0.00 0.00 0.00 0.00 0.00 0.00 0.0022 Tamil Nadu 0.00 0.00 0.00 0.00 0.00 0.00 0.00 0.0023 Tripura 0.00 0.00 0.00 0.00 0.00 0.00 0.00 0.0024 Uttar Pradesh 0.00 0.00 1.75 3.80 3.37 4.17 5.12 2.4125 West Bengal 0.00 0.00 0.00 0.00 0.00 0.00 0.00 0.0026 ALL INDIA 23.15 2.74 26.03 3.88 32.71 4.26 81.89 3.59
Annexure – VIIITotal Retention <strong>of</strong> Ragi for consumption at Farm Level(Triennium end<strong>in</strong>g 1998-99) (<strong>in</strong> ‘000 tonnes)Category <strong>of</strong> cultivatorS.No. Name <strong>of</strong> stateSmall Medium Large AllPercent to production <strong>of</strong>Percent to production <strong>of</strong>Percent to production <strong>of</strong>Percent to totalQuantity category Quantity category Quantity category Quantity production1 2 3 4 5 6 7 8 9 101 Andhra Pradesh 26.47 65.39 9.50 15.62 4.60 13.80 40.57 30.132 Arunachal Pradesh 0.00 0.00 0.00 0.00 0.00 0.00 0.00 0.003 Assam 0.00 0.00 0.00 0.00 0.00 0.00 0.00 0.004 Bihar 13.80 90.26 17.91 86.56 29.03 85.63 60.74 86.925 Goa 0.00 0.00 0.00 0.00 0.00 0.00 0.00 0.006 Gujarat 8.00 79.13 6.77 76.58 1.38 75.00 16.15 77.687 Haryana 0.00 0.00 0.00 0.00 0.00 0.00 0.00 0.008 Himachal Pradesh 2.25 91.09 2.13 89.87 1.44 88.89 5.82 90.099 Jammu <strong>and</strong> Kashmir 0.00 0.00 0.00 0.00 0.00 0.00 0.00 0.0010 Karnataka 325.48 65.19 199.01 53.88 238.68 53.36 763.17 57.9911 Kerala 0.00 0.00 0.00 0.00 0.00 0.00 0.00 0.0012 Madhya Pradesh 0.70 76.09 0.18 72.00 1.75 69.44 2.63 71.2713 Maharashtra 43.01 82.44 40.42 77.39 40.75 74.88 124.18 78.1914 Manipur 0.00 0.00 0.00 0.00 0.00 0.00 0.00 0.0015 Meghalaya 0.00 0.00 0.00 0.00 0.00 0.00 0.00 0.0016 Mizoram 0.00 0.00 0.00 0.00 0.00 0.00 0.00 0.0017 Nagal<strong>and</strong> 0.00 0.00 0.00 0.00 0.00 0.00 0.00 0.0018 Orissa 11.49 57.62 13.40 63.39 11.60 59.92 36.49 60.3719 Punjab 0.00 0.00 0.00 0.00 0.00 0.00 0.00 0.0020 Rajasthan 0.00 0.00 0.00 0.00 0.00 0.00 0.00 0.0021 Sikkim 0.00 0.00 0.00 0.00 0.00 0.00 0.00 0.0022 Tamil Nadu 77.54 66.06 56.21 62.87 57.48 62.11 191.23 63.8923 Tripura 0.00 0.00 0.00 0.00 0.00 0.00 0.00 0.0024 Uttar Pradesh 63.11 73.42 28.82 62.64 51.66 63.90 143.59 67.4725 West Bengal 0.00 0.00 0.00 0.00 0.00 0.00 0.00 0.0026 ALL INDIA 571.85 67.75 374.35 55.78 438.37 57.10 1384.57 60.65
Annexure –IXTotal Retention <strong>of</strong> Ragi for Seed(Triennium end<strong>in</strong>g 1998-99)(<strong>in</strong> ‘000 tonnes)Category <strong>of</strong> cultivatorSmall Medium Large AllS.No. Name <strong>of</strong> statePercent to production <strong>of</strong>Percent to production <strong>of</strong>Percent to production <strong>of</strong>Percent to totalQuantity category Quantity category Quantity category Quantity production1 2 3 4 5 6 7 8 9 101 Andhra Pradesh 0.08 0.20 0.07 0.12 0.05 0.15 0.20 0.152 Arunachal Pradesh 0.00 0.00 0.00 0.00 0.00 0.00 0.00 0.003 Assam 0.00 0.00 0.00 0.00 0.00 0.00 0.00 0.004 Bihar 0.24 1.57 0.68 3.29 1.43 4.22 2.35 3.365 Goa 0.00 0.00 0.00 0.00 0.00 0.00 0.00 0.006 Gujarat 0.04 0.40 0.01 0.11 0.00 0.00 0.05 0.247 Haryana 0.00 0.00 0.00 0.00 0.00 0.00 0.00 0.008 Himachal Pradesh 0.03 1.21 0.00 0.00 0.02 1.23 0.05 0.779 Jammu <strong>and</strong> Kashmir 0.00 0.00 0.00 0.00 0.00 0.00 0.00 0.0010 Karnataka 11.93 2.39 9.33 2.53 14.90 3.33 36.16 2.7511 Kerala 0.00 0.00 0.00 0.00 0.00 0.00 0.00 0.0012 Madhya Pradesh 0.00 0.00 0.02 8.00 0.19 7.54 0.21 5.6913 Maharashtra 0.11 0.21 0.17 0.33 0.66 1.21 0.94 0.5914 Manipur 0.00 0.00 0.00 0.00 0.00 0.00 0.00 0.0015 Meghalaya 0.00 0.00 0.00 0.00 0.00 0.00 0.00 0.0016 Mizoram 0.00 0.00 0.00 0.00 0.00 0.00 0.00 0.0017 Nagal<strong>and</strong> 0.00 0.00 0.00 0.00 0.00 0.00 0.00 0.0018 Orissa 1.02 5.12 1.00 4.73 1.02 5.27 3.04 5.0319 Punjab 0.00 0.00 0.00 0.00 0.00 0.00 0.00 0.0020 Rajasthan 0.00 0.00 0.00 0.00 0.00 0.00 0.00 0.0021 Sikkim 0.00 0.00 0.00 0.00 0.00 0.00 0.00 0.0022 Tamil Nadu 3.14 2.68 1.69 1.89 1.95 2.11 6.78 2.2723 Tripura 0.00 0.00 0.00 0.00 0.00 0.00 0.00 0.0024 Uttar Pradesh 1.80 2.09 1.37 2.98 3.82 4.72 6.99 3.2825 West Bengal 0.00 0.00 0.00 0.00 0.00 0.00 0.00 0.0026 ALL INDIA 18.39 2.18 14.34 2.14 24.04 3.13 56.77 2.49
Annexure – IX-ATotal Retention <strong>of</strong> Ragi for Seed Irrigated / Unirrigated(Triennium end<strong>in</strong>g 1998-99)(<strong>in</strong> ‘000 tonnes)Irrigated Unirrigated total Qty. reta<strong>in</strong>edS.No. Name <strong>of</strong> state Area Qty. reta<strong>in</strong>ed Percent to col. 9 Area Qty. reta<strong>in</strong>ed Percent to col. 91 2 3 4 5 6 7 8 91 Andhra Pradesh 0.00 0.00 0.00 133.66 0.20 100.00 0.202 Arunachal Pradesh 0.00 0.00 0.00 0.00 0.00 0.00 0.003 Assam 0.00 0.00 0.00 0.00 0.00 0.00 0.004 Bihar 7.08 0.01 0.57 62.74 2.34 99.43 2.355 Goa 0.00 0.00 0.00 0.00 0.00 0.00 0.006 Gujarat 19.67 0.00 0.00 0.00 0.05 100.00 0.057 Haryana 0.00 0.00 0.00 0.00 0.00 0.00 0.008 Himachal Pradesh 0.00 0.00 0.00 5.83 0.05 100.00 0.059 Jammu <strong>and</strong> Kashmir 0.00 0.00 0.00 0.00 0.00 0.00 0.0010 Karnataka 81.10 2.37 6.55 741.38 33.79 93.45 36.1611 Kerala 0.00 0.00 0.00 0.00 0.00 0.00 0.0012 Madhya Pradesh 0.00 0.12 58.73 12.14 0.09 41.27 0.2113 Maharashtra 0.00 0.00 0.00 154.30 0.94 100.00 0.9414 Manipur 0.00 0.00 0.00 0.00 0.00 0.00 0.0015 Meghalaya 0.00 0.00 0.00 0.00 0.00 0.00 0.0016 Mizoram 0.00 0.00 0.00 0.00 0.00 0.00 0.0017 Nagal<strong>and</strong> 0.00 0.00 0.00 0.00 0.00 0.00 0.0018 Orissa 0.00 0.03 0.88 82.40 3.01 99.12 3.0419 Punjab 0.00 0.00 0.00 0.00 0.00 0.00 0.0020 Rajasthan 0.00 0.00 0.00 0.00 0.00 0.00 0.0021 Sikkim 0.00 0.00 0.00 0.00 0.00 0.00 0.0022 Tamil Nadu 88.68 1.80 26.55 55.72 4.98 73.45 6.7823 Tripura 0.00 0.00 0.00 0.00 0.00 0.00 0.0024 Uttar Pradesh 14.57 0.04 0.62 127.88 6.95 99.38 6.9925 West Bengal 0.00 0.00 0.00 0.00 0.00 0.00 0.0026 ALL INDIA 211.10 4.38 7.71 1376.05 52.39 92.29 56.77
Annexure – XRetention <strong>of</strong> Ragi for Animal Feed(Triennium end<strong>in</strong>g 1998-99)(<strong>in</strong> ‘000 tonnes)Category Of CultivatorSmall Medium Large AllS.No. Name <strong>of</strong> statePercent to production <strong>of</strong>Percent to production <strong>of</strong>Percent to production <strong>of</strong>Percent to totalQuantity category Quantity category Quantity category Quantity production1 2 3 4 5 6 7 8 9 101 Andhra Pradesh 0.00 0.00 0.00 0.00 0.00 0.00 0.00 0.002 Arunachal Pradesh 0.00 0.00 0.00 0.00 0.00 0.00 0.00 0.003 Assam 0.00 0.00 0.00 0.00 0.00 0.00 0.00 0.004 Bihar 0.00 0.00 0.00 0.00 0.00 0.00 0.00 0.005 Goa 0.00 0.00 0.00 0.00 0.00 0.00 0.00 0.006 Gujarat 0.00 0.00 0.00 0.00 0.00 0.00 0.00 0.007 Haryana 0.00 0.00 0.00 0.00 0.00 0.00 0.00 0.008 Himachal Pradesh 0.00 0.00 0.00 0.00 0.00 0.00 0.00 0.009 Jammu <strong>and</strong> Kashmir 0.00 0.00 0.00 0.00 0.00 0.00 0.00 0.0010 Karnataka 0.00 0.00 0.31 0.08 0.49 0.11 0.80 0.0611 Kerala 0.00 0.00 0.00 0.00 0.00 0.00 0.00 0.0012 Madhya Pradesh 0.00 0.00 0.00 0.00 0.00 0.00 0.00 0.0013 Maharashtra 0.00 0.00 0.00 0.00 0.00 0.00 0.00 0.0014 Manipur 0.00 0.00 0.00 0.00 0.00 0.00 0.00 0.0015 Meghalaya 0.00 0.00 0.00 0.00 0.00 0.00 0.00 0.0016 Mizoram 0.00 0.00 0.00 0.00 0.00 0.00 0.00 0.0017 Nagal<strong>and</strong> 0.00 0.00 0.00 0.00 0.00 0.00 0.00 0.0018 Orissa 0.00 0.00 0.04 0.18 0.16 0.83 0.20 0.3319 Punjab 0.00 0.00 0.00 0.00 0.00 0.00 0.00 0.0020 Rajasthan 0.00 0.00 0.00 0.00 0.00 0.00 0.00 0.0021 Sikkim 0.00 0.00 0.00 0.00 0.00 0.00 0.00 0.0022 Tamil Nadu 0.00 0.00 0.00 0.00 0.00 0.00 0.00 0.0023 Tripura 0.00 0.00 0.00 0.00 0.00 0.00 0.00 0.0024 Uttar Pradesh 0.13 0.15 0.07 0.16 0.12 0.15 0.32 0.1525 West Bengal 0.00 0.00 0.00 0.00 0.00 0.00 0.00 0.0026 ALL INDIA 0.13 0.02 0.42 0.06 0.77 0.10 1.31 0.06
Annexure – XIUtilisation <strong>of</strong> Ragi for Payment <strong>in</strong> Cash to Temporary Labours <strong>and</strong> Other Purposes (,from the Sale <strong>of</strong> Current year crop)– Small Category Cultivators(Triennium end<strong>in</strong>g 1998-99)(<strong>in</strong> ‘000 tonnes)Quantity utilisedTotalName <strong>of</strong> state Temporary Farm Customary L<strong>and</strong> L<strong>and</strong> owner as repayment L<strong>and</strong> Irrigation charges OthersS.No.farmlaborersmach<strong>in</strong>e &equipmentpayments tovillage artisansowner asrentshare <strong>of</strong>produce<strong>of</strong> loan revenue & other cesses1 2 3 4 5 6 7 8 9 10 11 121 Andhra Pradesh 0.00 0.00 0.00 0.00 0.00 0.00 0.00 0.00 0.00 0.002 Arunachal Pradesh 0.00 0.00 0.00 0.00 0.00 0.00 0.00 0.00 0.00 0.003 Assam 0.00 0.00 0.00 0.00 0.00 0.00 0.00 0.00 0.00 0.004 Bihar 0.00 0.00 0.00 0.00 0.00 0.00 0.00 0.00 0.00 0.005 Goa 0.00 0.00 0.00 0.00 0.00 0.00 0.00 0.00 0.00 0.006 Gujarat 0.00 0.00 0.00 0.00 0.00 0.00 0.00 0.00 0.00 0.007 Haryana 0.00 0.00 0.00 0.00 0.00 0.00 0.00 0.00 0.00 0.008 Himachal Pradesh 0.00 0.00 0.00 0.00 0.00 0.00 0.00 0.00 0.00 0.009 Jammu <strong>and</strong> Kashmir 0.00 0.00 0.00 0.00 0.00 0.00 0.00 0.00 0.00 0.0010 Karnataka 0.00 0.00 0.00 0.00 0.00 0.00 0.00 0.00 0.00 0.0011 Kerala 0.00 0.00 0.00 0.00 0.00 0.00 0.00 0.00 0.00 0.0012 Madhya Pradesh 3.42 0.00 0.00 0.00 0.00 0.00 0.00 0.00 0.00 3.4213 Maharashtra 0.00 0.00 0.00 0.00 0.00 0.00 0.00 0.00 0.00 0.0014 Manipur 0.00 0.00 0.00 0.00 0.00 0.00 0.00 0.00 0.00 0.0015 Meghalaya 0.00 0.00 0.00 0.00 0.00 0.00 0.00 0.00 0.00 0.0016 Mizoram 0.00 0.00 0.00 0.00 0.00 0.00 0.00 0.00 0.00 0.0017 Nagal<strong>and</strong> 0.00 0.00 0.00 0.00 0.00 0.00 0.00 0.00 0.00 0.0018 Orissa 0.00 0.00 0.00 0.00 0.00 0.00 0.00 0.00 0.12 0.1219 Punjab 0.00 0.00 0.00 0.00 0.00 0.00 0.00 0.00 0.00 0.0020 Rajasthan 0.00 0.00 0.00 0.00 0.00 0.00 0.00 0.00 0.00 0.0021 Sikkim 0.00 0.00 0.00 0.00 0.00 0.00 0.00 0.00 0.00 0.0022 Tamil Nadu 0.00 0.00 0.00 0.00 0.00 0.00 0.00 0.00 0.00 0.0023 Tripura 0.00 0.00 0.00 0.00 0.00 0.00 0.00 0.00 0.00 0.0024 Uttar Pradesh 0.00 0.00 0.00 0.00 0.00 0.00 0.00 0.02 0.47 0.4925 West Bengal 0.00 0.00 0.00 0.00 0.00 0.00 0.00 0.00 0.00 0.0026 ALL INDIA 3.42 0.00 0.00 0.00 0.00 0.00 0.00 0.02 0.59 4.03
Annexure – XIIUtilisation <strong>of</strong> Ragi for Payment <strong>in</strong> Cash to Temporary Labours <strong>and</strong> Other Purposes (,from the Sale <strong>of</strong> Current year crop)– Medium Category Cultivators(Triennium end<strong>in</strong>g 1998-99)(<strong>in</strong> ‘000 tonnes)Quantity utilisedTemporary Farm Customary L<strong>and</strong> L<strong>and</strong> owner repayment L<strong>and</strong> Irrigation Others TotalS.No.Name <strong>of</strong> statefarmlaborersmach<strong>in</strong>e &equipmentpayments tovillage artisansowner asrentas share <strong>of</strong>produce<strong>of</strong> loan revenue charges &other cesses1 2 3 4 5 6 7 8 9 10 11 121 Andhra Pradesh 2.10 0.00 0.00 0.00 0.00 0.00 0.00 0.00 0.19 2.292 Arunachal Pradesh 0.00 0.00 0.00 0.00 0.00 0.00 0.00 0.00 0.00 0.003 Assam 0.00 0.00 0.00 0.00 0.00 0.00 0.00 0.00 0.00 0.004 Bihar 0.00 0.00 0.00 0.00 0.00 0.00 0.00 0.00 0.00 0.005 Goa 0.00 0.00 0.00 0.00 0.00 0.00 0.00 0.00 0.00 0.006 Gujarat 0.00 0.00 0.00 0.00 0.00 0.00 0.00 0.00 0.00 0.007 Haryana 0.00 0.00 0.00 0.00 0.00 0.00 0.00 0.00 0.00 0.008 Himachal Pradesh 0.00 0.00 0.00 0.00 0.00 0.00 0.00 0.00 0.00 0.009 Jammu <strong>and</strong> Kashmir 0.00 0.00 0.00 0.00 0.00 0.00 0.00 0.00 0.00 0.0010 Karnataka 0.00 0.00 0.00 0.00 0.00 0.00 0.00 0.00 0.00 0.0011 Kerala 0.00 0.00 0.00 0.00 0.00 0.00 0.00 0.00 0.00 0.0012 Madhya Pradesh 0.00 0.00 0.00 0.00 0.00 0.00 0.00 0.00 0.00 0.0013 Maharashtra 0.00 0.00 0.00 0.00 0.00 0.00 0.00 0.00 0.00 0.0014 Manipur 0.00 0.00 0.00 0.00 0.00 0.00 0.00 0.00 0.00 0.0015 Meghalaya 0.00 0.00 0.00 0.00 0.00 0.00 0.00 0.00 0.00 0.0016 Mizoram 0.00 0.00 0.00 0.00 0.00 0.00 0.00 0.00 0.00 0.0017 Nagal<strong>and</strong> 0.00 0.00 0.00 0.00 0.00 0.00 0.00 0.00 0.00 0.0018 Orissa 0.01 0.00 0.00 0.00 0.00 0.00 0.00 0.00 0.27 0.2819 Punjab 0.00 0.00 0.00 0.00 0.00 0.00 0.00 0.00 0.00 0.0020 Rajasthan 0.00 0.00 0.00 0.00 0.00 0.00 0.00 0.00 0.00 0.0021 Sikkim 0.00 0.00 0.00 0.00 0.00 0.00 0.00 0.00 0.00 0.0022 Tamil Nadu 0.00 0.00 0.00 0.00 0.00 0.00 0.00 0.00 0.00 0.0023 Tripura 0.00 0.00 0.00 0.00 0.00 0.00 0.00 0.00 0.00 0.0024 Uttar Pradesh 0.67 0.00 0.00 0.00 0.00 0.00 0.01 0.04 1.29 2.0125 West Bengal 0.00 0.00 0.00 0.00 0.00 0.00 0.00 0.00 0.00 0.0026 ALL INDIA 2.78 0.00 0.00 0.00 0.00 0.00 0.01 0.04 1.75 4.58
Annexure – XIIIUtilisation <strong>of</strong> Ragi for Payment <strong>in</strong> Cash to Temporary Labours <strong>and</strong> Other Purposes (,from the Sale <strong>of</strong> Current year crop)– Large Category Cultivators(Triennium end<strong>in</strong>g(<strong>in</strong> ‘000 tonnes) 1998-99)Quantity utilisedS.No.Name <strong>of</strong> stateTemporaryfarmlaborersFarmmach<strong>in</strong>e &equipmentCustomarypayments tovillage artisansL<strong>and</strong>owner asrentL<strong>and</strong> owneras share <strong>of</strong>producerepayment<strong>of</strong> loanL<strong>and</strong>revenueIrrigationcharges &other cessesOthersTotalpayment <strong>in</strong>k<strong>in</strong>d1 2 3 4 5 6 7 8 9 10 11 121 Andhra Pradesh 0.91 0.00 0.00 0.00 0.00 0.00 0.00 0.00 0.03 0.942 Arunachal Pradesh 0.00 0.00 0.00 0.00 0.00 0.00 0.00 0.00 0.00 0.003 Assam 0.00 0.00 0.00 0.00 0.00 0.00 0.00 0.00 0.00 0.004 Bihar 0.00 0.00 0.00 0.00 0.00 0.00 0.00 0.00 0.00 0.005 Goa 0.00 0.00 0.00 0.00 0.00 0.00 0.00 0.00 0.00 0.006 Gujarat 0.00 0.00 0.00 0.00 0.00 0.00 0.00 0.00 0.00 0.007 Haryana 0.00 0.00 0.00 0.00 0.00 0.00 0.00 0.00 0.00 0.008 Himachal Pradesh 0.00 0.00 0.00 0.00 0.00 0.00 0.00 0.00 0.00 0.009 Jammu <strong>and</strong> Kashmir 0.00 0.00 0.00 0.00 0.00 0.00 0.00 0.00 0.00 0.0010 Karnataka 23.15 0.00 0.00 0.00 0.00 0.00 0.00 0.00 0.00 23.1511 Kerala 0.00 0.00 0.00 0.00 0.00 0.00 0.00 0.00 0.00 0.0012 Madhya Pradesh 0.00 0.00 0.00 0.00 0.00 0.00 0.00 0.00 0.00 0.0013 Maharashtra 0.00 0.00 0.00 0.00 0.00 0.00 0.00 0.00 0.00 0.0014 Manipur 0.00 0.00 0.00 0.00 0.00 0.00 0.00 0.00 0.00 0.0015 Meghalaya 0.00 0.00 0.00 0.00 0.00 0.00 0.00 0.00 0.00 0.0016 Mizoram 0.00 0.00 0.00 0.00 0.00 0.00 0.00 0.00 0.00 0.0017 Nagal<strong>and</strong> 0.00 0.00 0.00 0.00 0.00 0.00 0.00 0.00 0.00 0.0018 Orissa 0.06 0.00 0.00 0.00 0.00 0.00 0.00 0.00 0.25 0.3119 Punjab 0.00 0.00 0.00 0.00 0.00 0.00 0.00 0.00 0.00 0.0020 Rajasthan 0.00 0.00 0.00 0.00 0.00 0.00 0.00 0.00 0.00 0.0021 Sikkim 0.00 0.00 0.00 0.00 0.00 0.00 0.00 0.00 0.00 0.0022 Tamil Nadu 0.00 0.00 0.00 0.00 0.00 0.00 2.65 0.00 0.00 2.6523 Tripura 0.00 0.00 0.00 0.00 0.00 0.00 0.00 0.00 0.00 0.0024 Uttar Pradesh 2.16 0.00 0.00 0.00 0.00 0.00 0.02 0.04 1.45 3.6725 West Bengal 0.00 0.00 0.00 0.00 0.00 0.00 0.00 0.00 0.00 0.0026 ALL INDIA 26.28 0.00 0.00 0.00 0.00 0.00 2.67 0.04 1.73 30.72
Annexure – XIVUtilisation <strong>of</strong> Ragi for Payment <strong>in</strong> Cash to Temporary Labours <strong>and</strong> Other Purposes (,from the Sale <strong>of</strong> Current year crop)– All Category Cultivators(Triennium end<strong>in</strong>g 1998-99)(<strong>in</strong> ‘000 tonnes)Quantity utilisedTemporary Farm Customary L<strong>and</strong> L<strong>and</strong> owner repayment L<strong>and</strong> Irrigation Others TotalS.No. Name <strong>of</strong> state farmlaborersmach<strong>in</strong>e &equipmentpayments tovillage artisansowner asrentas share <strong>of</strong>produce<strong>of</strong> loan revenue charges &other cessespayment <strong>in</strong>k<strong>in</strong>d1 2 3 4 5 6 7 8 9 10 11 121 Andhra Pradesh 3.01 0.00 0.00 0.00 0.00 0.00 0.00 0.00 0.22 3.232 Arunachal Pradesh 0.00 0.00 0.00 0.00 0.00 0.00 0.00 0.00 0.00 0.003 Assam 0.00 0.00 0.00 0.00 0.00 0.00 0.00 0.00 0.00 0.004 Bihar 0.00 0.00 0.00 0.00 0.00 0.00 0.00 0.00 0.00 0.005 Goa 0.00 0.00 0.00 0.00 0.00 0.00 0.00 0.00 0.00 0.006 Gujarat 0.00 0.00 0.00 0.00 0.00 0.00 0.00 0.00 0.00 0.007 Haryana 0.00 0.00 0.00 0.00 0.00 0.00 0.00 0.00 0.00 0.008 Himachal Pradesh 0.00 0.00 0.00 0.00 0.00 0.00 0.00 0.00 0.00 0.009 Jammu <strong>and</strong> Kashmir 0.00 0.00 0.00 0.00 0.00 0.00 0.00 0.00 0.00 0.0010 Karnataka 23.15 0.00 0.00 0.00 0.00 0.00 0.00 0.00 0.00 23.1511 Kerala 0.00 0.00 0.00 0.00 0.00 0.00 0.00 0.00 0.00 0.0012 Madhya Pradesh 3.42 0.00 0.00 0.00 0.00 0.00 0.00 0.00 0.00 3.4213 Maharashtra 0.00 0.00 0.00 0.00 0.00 0.00 0.00 0.00 0.00 0.0014 Manipur 0.00 0.00 0.00 0.00 0.00 0.00 0.00 0.00 0.00 0.0015 Meghalaya 0.00 0.00 0.00 0.00 0.00 0.00 0.00 0.00 0.00 0.0016 Mizoram 0.00 0.00 0.00 0.00 0.00 0.00 0.00 0.00 0.00 0.0017 Nagal<strong>and</strong> 0.00 0.00 0.00 0.00 0.00 0.00 0.00 0.00 0.00 0.0018 Orissa 0.07 0.00 0.00 0.00 0.00 0.00 0.00 0.00 0.64 0.7119 Punjab 0.00 0.00 0.00 0.00 0.00 0.00 0.00 0.00 0.00 0.0020 Rajasthan 0.00 0.00 0.00 0.00 0.00 0.00 0.00 0.00 0.00 0.0021 Sikkim 0.00 0.00 0.00 0.00 0.00 0.00 0.00 0.00 0.00 0.0022 Tamil Nadu 0.00 0.00 0.00 0.00 0.00 0.00 2.65 0.00 0.00 2.6523 Tripura 0.00 0.00 0.00 0.00 0.00 0.00 0.00 0.00 0.00 0.0024 Uttar Pradesh 2.83 0.00 0.00 0.00 0.00 0.00 0.03 0.10 3.21 6.1725 West Bengal 0.00 0.00 0.00 0.00 0.00 0.00 0.00 0.00 0.00 0.0026 ALL INDIA 32.48 0.00 0.00 0.00 0.00 0.00 2.68 0.10 4.07 39.33
Annexure – XVUtilisation <strong>of</strong> Ragi for Payment <strong>in</strong> Cash ( from Sale <strong>of</strong> Previous year crop) for Temporary Labour <strong>and</strong> Other Purposes – Small Category Cultivators(Triennium end<strong>in</strong>g 1998-99)(<strong>in</strong> ‘000 tonnes)Quantity utilisedTemporary Farm Customary L<strong>and</strong> L<strong>and</strong> owner repayment L<strong>and</strong> Irrigation Others TotalS.No. Name <strong>of</strong> state farmlaborersmach<strong>in</strong>e &equipmentpayments tovillage artisansowner asrentas share <strong>of</strong>produce<strong>of</strong> loan revenue charges &other cesses1 2 3 4 5 6 7 8 9 10 11 121 Andhra Pradesh 0.31 0.00 0.00 0.00 0.00 0.00 0.00 0.00 0.00 0.312 Arunachal Pradesh 0.00 0.00 0.00 0.00 0.00 0.00 0.00 0.00 0.00 0.003 Assam 0.00 0.00 0.00 0.00 0.00 0.00 0.00 0.00 0.00 0.004 Bihar 0.00 0.00 0.00 0.00 0.00 0.00 0.00 0.00 0.00 0.005 Goa 0.00 0.00 0.00 0.00 0.00 0.00 0.00 0.00 0.00 0.006 Gujarat 0.00 0.00 0.00 0.00 0.00 0.00 0.00 0.00 0.00 0.007 Haryana 0.00 0.00 0.00 0.00 0.00 0.00 0.00 0.00 0.00 0.008 Himachal Pradesh 0.00 0.00 0.00 0.00 0.00 0.00 0.00 0.00 0.00 0.009 Jammu <strong>and</strong> Kashmir 0.00 0.00 0.00 0.00 0.00 0.00 0.00 0.00 0.00 0.0010 Karnataka 3.81 0.00 0.00 0.00 0.00 0.00 0.00 0.00 0.00 3.8111 Kerala 0.00 0.00 0.00 0.00 0.00 0.00 0.00 0.00 0.00 0.0012 Madhya Pradesh 0.00 0.00 0.00 0.00 0.00 0.00 0.00 0.00 0.00 0.0013 Maharashtra 0.00 0.00 0.00 0.00 0.00 0.00 0.00 0.00 0.00 0.0014 Manipur 0.00 0.00 0.00 0.00 0.00 0.00 0.00 0.00 0.00 0.0015 Meghalaya 0.00 0.00 0.00 0.00 0.00 0.00 0.00 0.00 0.00 0.0016 Mizoram 0.00 0.00 0.00 0.00 0.00 0.00 0.00 0.00 0.00 0.0017 Nagal<strong>and</strong> 0.00 0.00 0.00 0.00 0.00 0.00 0.00 0.00 0.00 0.0018 Orissa 0.00 0.00 0.00 0.00 0.00 0.00 0.00 0.00 0.00 0.0019 Punjab 0.00 0.00 0.00 0.00 0.00 0.00 0.00 0.00 0.00 0.0020 Rajasthan 0.00 0.00 0.00 0.00 0.00 0.00 0.00 0.00 0.00 0.0021 Sikkim 0.00 0.00 0.00 0.00 0.00 0.00 0.00 0.00 0.00 0.0022 Tamil Nadu 0.00 0.00 0.00 0.00 0.00 0.00 0.00 0.00 0.00 0.0023 Tripura 0.00 0.00 0.00 0.00 0.00 0.00 0.00 0.00 0.00 0.0024 Uttar Pradesh 0.00 0.00 0.00 0.00 0.00 0.00 0.00 0.03 0.62 0.6525 West Bengal 0.00 0.00 0.00 0.00 0.00 0.00 0.00 0.00 0.00 0.0026 ALL INDIA 4.12 0.00 0.00 0.00 0.00 0.00 0.00 0.03 0.62 4.77
Annexure –XVIUtilisation <strong>of</strong> Ragi for Payment <strong>in</strong> Cash ( from Sale <strong>of</strong> Previous year crop) for Temporary Labour <strong>and</strong> Other Purposes – Medium Category Cultivators(Triennium end<strong>in</strong>g 1998-99)(<strong>in</strong> ‘000 tonnes)Quantity utilisedTemporaryfarmFarmmach<strong>in</strong>e &Customarypayments toL<strong>and</strong>owner asL<strong>and</strong> owneras share <strong>of</strong>Repayment<strong>of</strong> loanL<strong>and</strong>revenueIrrigationcharges &Others TotalS.No. Name <strong>of</strong> state laborers equipment village artisans rent produceother cesses1 2 3 4 5 6 7 8 9 10 11 121 Andhra Pradesh 14.55 0.00 0.00 0.00 0.00 0.00 0.00 0.00 2.90 17.452 Arunachal Pradesh 0.00 0.00 0.00 0.00 0.00 0.00 0.00 0.00 0.00 0.003 Assam 0.00 0.00 0.00 0.00 0.00 0.00 0.00 0.00 0.00 0.004 Bihar 0.00 0.00 0.00 0.00 0.00 0.00 0.00 0.00 0.00 0.005 Goa 0.00 0.00 0.00 0.00 0.00 0.00 0.00 0.00 0.00 0.006 Gujarat 0.00 0.00 0.00 0.00 0.00 0.00 0.00 0.00 0.00 0.007 Haryana 0.00 0.00 0.00 0.00 0.00 0.00 0.00 0.00 0.00 0.008 Himachal Pradesh 0.00 0.00 0.00 0.00 0.00 0.00 0.00 0.00 0.00 0.009 Jammu <strong>and</strong> Kashmir 0.00 0.00 0.00 0.00 0.00 0.00 0.00 0.00 0.00 0.0010 Karnataka 6.94 0.00 0.00 0.00 0.00 0.00 0.00 0.00 0.00 6.9411 Kerala 0.00 0.00 0.00 0.00 0.00 0.00 0.00 0.00 0.00 0.0012 Madhya Pradesh 0.00 0.00 0.00 0.00 0.00 0.00 0.00 0.00 0.00 0.0013 Maharashtra 0.00 0.00 0.00 0.00 0.00 0.00 0.00 0.00 0.00 0.0014 Manipur 0.00 0.00 0.00 0.00 0.00 0.00 0.00 0.00 0.00 0.0015 Meghalaya 0.00 0.00 0.00 0.00 0.00 0.00 0.00 0.00 0.00 0.0016 Mizoram 0.00 0.00 0.00 0.00 0.00 0.00 0.00 0.00 0.00 0.0017 Nagal<strong>and</strong> 0.00 0.00 0.00 0.00 0.00 0.00 0.00 0.00 0.00 0.0018 Orissa 0.00 0.00 0.00 0.00 0.00 0.00 0.00 0.00 0.00 0.0019 Punjab 0.00 0.00 0.00 0.00 0.00 0.00 0.00 0.00 0.00 0.0020 Rajasthan 0.00 0.00 0.00 0.00 0.00 0.00 0.00 0.00 0.00 0.0021 Sikkim 0.00 0.00 0.00 0.00 0.00 0.00 0.00 0.00 0.00 0.0022 Tamil Nadu 0.00 0.00 0.00 0.00 0.00 0.00 0.00 0.00 0.00 0.0023 Tripura 0.00 0.00 0.00 0.00 0.00 0.00 0.00 0.00 0.00 0.0024 Uttar Pradesh 0.18 0.00 0.00 0.00 0.00 0.66 0.01 0.17 0.61 1.6325 West Bengal 0.00 0.00 0.00 0.00 0.00 0.00 0.00 0.00 0.00 0.0026 ALL INDIA 21.67 0.00 0.00 0.00 0.00 0.66 0.01 0.17 3.51 26.02
Annexure – XVIIUtilisation <strong>of</strong> Ragi for Payment <strong>in</strong> Cash ( from Sale <strong>of</strong> Previous year crop) for Temporary Labour <strong>and</strong> Other Purposes – Large Category Cultivators(Triennium end<strong>in</strong>g 1998-99)(<strong>in</strong> ‘000 tonnes)Quantity UtilisedTemporary Farm Customary L<strong>and</strong> L<strong>and</strong> owner Repayment L<strong>and</strong> Irrigation OthersS.No. Name <strong>of</strong> state farmlaborersmach<strong>in</strong>e &equipmentpayments tovillage artisansowner asrentas share <strong>of</strong>produce<strong>of</strong> loan revenue charges &other cesses1 2 3 4 5 6 7 8 9 10 11 121 Andhra Pradesh 7.54 0.00 0.00 0.00 0.00 0.00 0.00 0.00 2.11 9.652 Arunachal Pradesh 0.00 0.00 0.00 0.00 0.00 0.00 0.00 0.00 0.00 0.003 Assam 0.00 0.00 0.00 0.00 0.00 0.00 0.00 0.00 0.00 0.004 Bihar 0.00 0.00 0.00 0.00 0.00 0.00 0.00 0.00 0.36 0.365 Goa 0.00 0.00 0.00 0.00 0.00 0.00 0.00 0.00 0.00 0.006 Gujarat 0.00 0.00 0.00 0.00 0.00 0.00 0.00 0.00 0.00 0.007 Haryana 0.00 0.00 0.00 0.00 0.00 0.00 0.00 0.00 0.00 0.008 Himachal Pradesh 0.00 0.00 0.00 0.00 0.00 0.00 0.00 0.00 0.00 0.009 Jammu <strong>and</strong> Kashmir 0.00 0.00 0.00 0.00 0.00 0.00 0.00 0.00 0.00 0.0010 Karnataka 6.55 0.08 0.00 0.00 0.00 0.00 0.00 0.00 0.00 6.6311 Kerala 0.00 0.00 0.00 0.00 0.00 0.00 0.00 0.00 0.00 0.0012 Madhya Pradesh 0.00 0.00 0.00 0.00 0.00 0.00 0.00 0.00 0.00 0.0013 Maharashtra 0.00 0.00 0.00 0.00 0.00 0.00 0.00 0.00 0.00 0.0014 Manipur 0.00 0.00 0.00 0.00 0.00 0.00 0.00 0.00 0.00 0.0015 Meghalaya 0.00 0.00 0.00 0.00 0.00 0.00 0.00 0.00 0.00 0.0016 Mizoram 0.00 0.00 0.00 0.00 0.00 0.00 0.00 0.00 0.00 0.0017 Nagal<strong>and</strong> 0.00 0.00 0.00 0.00 0.00 0.00 0.00 0.00 0.00 0.0018 Orissa 0.14 0.00 0.00 0.00 0.00 0.00 0.00 0.00 0.00 0.1419 Punjab 0.00 0.00 0.00 0.00 0.00 0.00 0.00 0.00 0.00 0.0020 Rajasthan 0.00 0.00 0.00 0.00 0.00 0.00 0.00 0.00 0.00 0.0021 Sikkim 0.00 0.00 0.00 0.00 0.00 0.00 0.00 0.00 0.00 0.0022 Tamil Nadu 0.07 0.09 0.00 0.00 0.00 0.00 0.00 0.00 0.01 0.1723 Tripura 0.00 0.00 0.00 0.00 0.00 0.00 0.00 0.00 0.00 0.0024 Uttar Pradesh 0.22 0.00 0.00 0.00 0.00 0.00 1.33 0.01 0.19 1.7525 West Bengal 0.00 0.00 0.00 0.00 0.00 0.00 0.00 0.00 0.00 0.0026 ALL INDIA 14.52 0.17 0.00 0.00 0.00 0.00 1.33 0.01 2.67 18.70Total
Annexure – XVIIIUtilisation <strong>of</strong> Ragi for Payment <strong>in</strong> Cash ( from Sale <strong>of</strong> Previous year crop) for Temporary Labour <strong>and</strong> Other Purposes – All Category Cultivators(Triennium end<strong>in</strong>g 1998-99)(<strong>in</strong> ‘000 tonnes)Quantity UtilisedTemporary Farm Customary L<strong>and</strong> L<strong>and</strong> owner Repayment L<strong>and</strong> Irrigation OthersS.No. Name <strong>of</strong> state farmlaborersmach<strong>in</strong>e &equipmentpayments tovillage artisansowner asrentas share <strong>of</strong>produce<strong>of</strong> loan revenue charges &other cesses1 2 3 4 5 6 7 8 9 10 11 121 Andhra Pradesh 22.40 0.00 0.00 0.00 0.00 0.00 0.00 0.00 5.01 27.412 Arunachal Pradesh 0.00 0.00 0.00 0.00 0.00 0.00 0.00 0.00 0.00 0.003 Assam 0.00 0.00 0.00 0.00 0.00 0.00 0.00 0.00 0.00 0.004 Bihar 0.00 0.00 0.00 0.00 0.00 0.00 0.00 0.00 0.36 0.365 Goa 0.00 0.00 0.00 0.00 0.00 0.00 0.00 0.00 0.00 0.006 Gujarat 0.00 0.00 0.00 0.00 0.00 0.00 0.00 0.00 0.00 0.007 Haryana 0.00 0.00 0.00 0.00 0.00 0.00 0.00 0.00 0.00 0.008 Himachal Pradesh 0.00 0.00 0.00 0.00 0.00 0.00 0.00 0.00 0.00 0.009 Jammu <strong>and</strong> Kashmir 0.00 0.00 0.00 0.00 0.00 0.00 0.00 0.00 0.00 0.0010 Karnataka 17.30 0.08 0.00 0.00 0.00 0.00 0.00 0.00 0.00 17.3811 Kerala 0.00 0.00 0.00 0.00 0.00 0.00 0.00 0.00 0.00 0.0012 Madhya Pradesh 0.00 0.00 0.00 0.00 0.00 0.00 0.00 0.00 0.00 0.0013 Maharashtra 0.00 0.00 0.00 0.00 0.00 0.00 0.00 0.00 0.00 0.0014 Manipur 0.00 0.00 0.00 0.00 0.00 0.00 0.00 0.00 0.00 0.0015 Meghalaya 0.00 0.00 0.00 0.00 0.00 0.00 0.00 0.00 0.00 0.0016 Mizoram 0.00 0.00 0.00 0.00 0.00 0.00 0.00 0.00 0.00 0.0017 Nagal<strong>and</strong> 0.00 0.00 0.00 0.00 0.00 0.00 0.00 0.00 0.00 0.0018 Orissa 0.14 0.00 0.00 0.00 0.00 0.00 0.00 0.00 0.00 0.1419 Punjab 0.00 0.00 0.00 0.00 0.00 0.00 0.00 0.00 0.00 0.0020 Rajasthan 0.00 0.00 0.00 0.00 0.00 0.00 0.00 0.00 0.00 0.0021 Sikkim 0.00 0.00 0.00 0.00 0.00 0.00 0.00 0.00 0.00 0.0022 Tamil Nadu 0.07 0.09 0.00 0.00 0.00 0.00 0.00 0.00 0.01 0.1723 Tripura 0.00 0.00 0.00 0.00 0.00 0.00 0.00 0.00 0.00 0.0024 Uttar Pradesh 0.40 0.00 0.00 0.00 0.00 0.66 1.34 0.21 1.42 4.0325 West Bengal 0.00 0.00 0.00 0.00 0.00 0.00 0.00 0.00 0.00 0.0026 ALL INDIA 40.31 0.17 0.00 0.00 0.00 0.66 1.34 0.21 6.80 49.49Total
S.No.Annexure –X IXUtilisation <strong>of</strong> Ragi for Payment <strong>in</strong> k<strong>in</strong>d to Temporary Labours <strong>and</strong> Other Purposes – Small Category Cultivators(Triennium end<strong>in</strong>g 1998-99)TemporaryfarmlaborersFarmmach<strong>in</strong>e &equipmentCustomarypayments tovillage artisansQuantity UtilisedL<strong>and</strong> owner L<strong>and</strong> owneras rent as share <strong>of</strong>produceRepayment<strong>of</strong> loanL<strong>and</strong>revenueIrrigationcharges &other cesses(<strong>in</strong> ‘000 tonnes)OthersTotalpayment <strong>in</strong>k<strong>in</strong>dName <strong>of</strong> state1 2 3 4 5 6 7 8 9 10 11 121 Andhra Pradesh 0.00 0.00 1.09 0.00 0.00 0.00 0.00 0.00 0.00 1.092 Arunachal Pradesh 0.00 0.00 0.00 0.00 0.00 0.00 0.00 0.00 0.00 0.003 Assam 0.00 0.00 0.00 0.00 0.00 0.00 0.00 0.00 0.00 0.004 Bihar 0.00 0.00 0.00 0.00 0.14 0.00 0.00 0.00 0.00 0.145 Goa 0.00 0.00 0.00 0.00 0.00 0.00 0.00 0.00 0.00 0.006 Gujarat 0.00 0.00 0.00 0.00 0.00 0.00 0.00 0.00 0.00 0.007 Haryana 0.00 0.00 0.00 0.00 0.00 0.00 0.00 0.00 0.00 0.008 Himachal Pradesh 0.06 0.00 0.00 0.00 0.00 0.00 0.00 0.00 0.00 0.069 Jammu <strong>and</strong> Kashmir 0.00 0.00 0.00 0.00 0.00 0.00 0.00 0.00 0.00 0.0010 Karnataka 7.22 0.00 1.22 0.00 0.00 0.00 0.00 0.00 0.02 8.4611 Kerala 0.00 0.00 0.00 0.00 0.00 0.00 0.00 0.00 0.00 0.0012 Madhya Pradesh 0.00 0.00 0.00 0.00 0.00 0.00 0.00 0.00 0.00 0.0013 Maharashtra 0.00 0.00 0.00 0.00 0.00 0.00 0.00 0.00 0.00 0.0014 Manipur 0.00 0.00 0.00 0.00 0.00 0.00 0.00 0.00 0.00 0.0015 Meghalaya 0.00 0.00 0.00 0.00 0.00 0.00 0.00 0.00 0.00 0.0016 Mizoram 0.00 0.00 0.00 0.00 0.00 0.00 0.00 0.00 0.00 0.0017 Nagal<strong>and</strong> 0.00 0.00 0.00 0.00 0.00 0.00 0.00 0.00 0.00 0.0018 Orissa 0.29 0.00 0.00 0.00 0.27 0.00 0.00 0.00 0.00 0.5619 Punjab 0.00 0.00 0.00 0.00 0.00 0.00 0.00 0.00 0.00 0.0020 Rajasthan 0.00 0.00 0.00 0.00 0.00 0.00 0.00 0.00 0.00 0.0021 Sikkim 0.00 0.00 0.00 0.00 0.00 0.00 0.00 0.00 0.00 0.0022 Tamil Nadu 9.39 0.00 1.13 0.00 0.00 0.00 0.00 0.00 0.00 10.5223 Tripura 0.00 0.00 0.00 0.00 0.00 0.00 0.00 0.00 0.00 0.0024 Uttar Pradesh 4.76 0.00 0.00 0.00 0.00 0.00 0.00 0.00 0.00 4.7625 West Bengal 0.00 0.00 0.00 0.00 0.00 0.00 0.00 0.00 0.00 0.0026 ALL INDIA 21.72 0.00 3.44 0.00 0.41 0.00 0.00 0.00 0.02 25.59
Annexure –X XUtilisation <strong>of</strong> Ragi for Payment <strong>in</strong> k<strong>in</strong>d to Temporary Labours <strong>and</strong> Other Purposes – Medium Category CultivatorsTriennium end<strong>in</strong>g 1998-99) (<strong>in</strong> ‘000 tonnes)Quantity UtilisedS.No. Name <strong>of</strong> state Temporaryfarm laborersFarmmach<strong>in</strong>e &equipmentCustomarypayments tovillage artisansL<strong>and</strong> owneras rentL<strong>and</strong> owneras share <strong>of</strong>produceRepayment<strong>of</strong> loanL<strong>and</strong>revenueIrrigationcharges &other cessesOthersTotalpayment <strong>in</strong>k<strong>in</strong>d1 2 3 4 5 6 7 8 9 10 11 121 Andhra Pradesh 0.35 0.00 1.19 0.00 0.00 0.00 0.00 0.00 0.00 1.542 Arunachal Pradesh 0.00 0.00 0.00 0.00 0.00 0.00 0.00 0.00 0.00 0.003 Assam 0.00 0.00 0.00 0.00 0.00 0.00 0.00 0.00 0.00 0.004 Bihar 0.70 0.00 0.00 0.00 0.00 0.00 0.00 0.00 0.00 0.705 Goa 0.00 0.00 0.00 0.00 0.00 0.00 0.00 0.00 0.00 0.006 Gujarat 0.00 0.00 0.00 0.00 0.00 0.00 0.00 0.00 0.00 0.007 Haryana 0.00 0.00 0.00 0.00 0.00 0.00 0.00 0.00 0.00 0.008 Himachal Pradesh 0.00 0.00 0.00 0.00 0.00 0.00 0.00 0.00 0.09 0.099 Jammu <strong>and</strong> Kashmir 0.00 0.00 0.00 0.00 0.00 0.00 0.00 0.00 0.00 0.0010 Karnataka 9.56 0.00 0.00 0.00 0.00 0.00 0.00 0.00 0.00 9.5611 Kerala 0.00 0.00 0.00 0.00 0.00 0.00 0.00 0.00 0.00 0.0012 Madhya Pradesh 0.00 0.00 0.00 0.00 0.00 0.00 0.00 0.00 0.00 0.0013 Maharashtra 0.00 0.00 0.00 0.00 0.00 0.00 0.00 0.00 0.00 0.0014 Manipur 0.00 0.00 0.00 0.00 0.00 0.00 0.00 0.00 0.00 0.0015 Meghalaya 0.00 0.00 0.00 0.00 0.00 0.00 0.00 0.00 0.00 0.0016 Mizoram 0.00 0.00 0.00 0.00 0.00 0.00 0.00 0.00 0.00 0.0017 Nagal<strong>and</strong> 0.00 0.00 0.00 0.00 0.00 0.00 0.00 0.00 0.00 0.0018 Orissa 0.19 0.00 0.00 0.13 0.19 0.00 0.00 0.00 0.01 0.5219 Punjab 0.00 0.00 0.00 0.00 0.00 0.00 0.00 0.00 0.00 0.0020 Rajasthan 0.00 0.00 0.00 0.00 0.00 0.00 0.00 0.00 0.00 0.0021 Sikkim 0.00 0.00 0.00 0.00 0.00 0.00 0.00 0.00 0.00 0.0022 Tamil Nadu 6.13 0.00 2.68 0.00 0.00 0.00 0.00 0.00 0.00 8.8123 Tripura 0.00 0.00 0.00 0.00 0.00 0.00 0.00 0.00 0.00 0.0024 Uttar Pradesh 1.26 0.00 0.00 0.00 0.00 0.68 0.00 0.09 2.19 4.2225 West Bengal 0.00 0.00 0.00 0.00 0.00 0.00 0.00 0.00 0.00 0.0026 ALL INDIA 18.19 0.00 3.87 0.13 0.19 0.68 0.00 0.09 2.29 25.44
Annexure – XXIUtilisation <strong>of</strong> Ragi for Payment <strong>in</strong> k<strong>in</strong>d to Temporary Labours <strong>and</strong> Other Purposes – Large Category Cultivators(Triennium end<strong>in</strong>g 1998-99)(<strong>in</strong> ‘000 tonnes)Quantity UtilisedS.No. Name <strong>of</strong> stateTemporaryfarm laborersFarm mach<strong>in</strong>e& equipmentCustomarypayments tovillage artisansL<strong>and</strong> owneras rentL<strong>and</strong> owneras share <strong>of</strong>produceRepayment<strong>of</strong> loanL<strong>and</strong>revenueIrrigationcharges &other cessesOthersTotalpayment <strong>in</strong>k<strong>in</strong>d1 2 3 4 5 6 7 8 9 10 11 121 Andhra Pradesh 0.00 0.00 1.34 0.00 0.00 0.00 0.00 0.00 0.00 1.342 Arunachal Pradesh 0.00 0.00 0.00 0.00 0.00 0.00 0.00 0.00 0.00 0.003 Assam 0.00 0.00 0.00 0.00 0.00 0.00 0.00 0.00 0.00 0.004 Bihar 1.43 0.00 0.00 0.00 0.00 0.00 0.00 0.00 0.00 1.435 Goa 0.00 0.00 0.00 0.00 0.00 0.00 0.00 0.00 0.00 0.006 Gujarat 0.00 0.00 0.00 0.00 0.00 0.00 0.00 0.00 0.00 0.007 Haryana 0.00 0.00 0.00 0.00 0.00 0.00 0.00 0.00 0.00 0.008 Himachal Pradesh 0.00 0.00 0.00 0.00 0.00 0.00 0.00 0.00 0.06 0.069 Jammu <strong>and</strong> Kashmir 0.00 0.00 0.00 0.00 0.00 0.00 0.00 0.00 0.00 0.0010 Karnataka 13.75 0.00 0.13 0.00 0.00 0.00 0.00 0.00 0.07 13.9511 Kerala 0.00 0.00 0.00 0.00 0.00 0.00 0.00 0.00 0.00 0.0012 Madhya Pradesh 0.00 0.00 0.00 0.00 0.00 0.00 0.00 0.00 0.00 0.0013 Maharashtra 0.00 0.00 0.00 0.00 0.00 0.00 0.00 0.00 0.00 0.0014 Manipur 0.00 0.00 0.00 0.00 0.00 0.00 0.00 0.00 0.00 0.0015 Meghalaya 0.00 0.00 0.00 0.00 0.00 0.00 0.00 0.00 0.00 0.0016 Mizoram 0.00 0.00 0.00 0.00 0.00 0.00 0.00 0.00 0.00 0.0017 Nagal<strong>and</strong> 0.00 0.00 0.00 0.00 0.00 0.00 0.00 0.00 0.00 0.0018 Orissa 0.66 0.00 0.00 0.00 0.00 0.00 0.00 0.00 0.00 0.6619 Punjab 0.00 0.00 0.00 0.00 0.00 0.00 0.00 0.00 0.00 0.0020 Rajasthan 0.00 0.00 0.00 0.00 0.00 0.00 0.00 0.00 0.00 0.0021 Sikkim 0.00 0.00 0.00 0.00 0.00 0.00 0.00 0.00 0.00 0.0022 Tamil Nadu 7.65 0.00 0.44 0.00 0.00 0.00 0.00 0.00 0.00 8.0923 Tripura 0.00 0.00 0.00 0.00 0.00 0.00 0.00 0.00 0.00 0.0024 Uttar Pradesh 5.51 0.00 0.00 0.00 0.00 0.00 0.00 0.00 1.07 6.5825 West Bengal 0.00 0.00 0.00 0.00 0.00 0.00 0.00 0.00 0.00 0.0026 ALL INDIA 29.00 0.00 1.91 0.00 0.00 0.00 0.00 0.00 1.20 32.11
Annexure – XXIIUtilisation <strong>of</strong> Ragi for Payment <strong>in</strong> k<strong>in</strong>d to Temporary Labours <strong>and</strong> Other Purposes – All Category Cultivators(Triennium end<strong>in</strong>g 1998-99) (<strong>in</strong> ‘000 tonnes)Quantity UtilisedS.NO. Name <strong>of</strong> stateTemporaryfarmlaborersFarm mach<strong>in</strong>e &equipmentCustomarypayments tovillage artisansL<strong>and</strong>owner asrentL<strong>and</strong> owneras share <strong>of</strong>produceRepayment<strong>of</strong> loanL<strong>and</strong>revenueIrrigationcharges &other cessOthersTotalpayment <strong>in</strong>k<strong>in</strong>d1 2 3 4 5 6 7 8 9 10 11 121 Andhra Pradesh 0.35 0.00 3.62 0.00 0.00 0.00 0.00 0.00 0.00 3.972 Arunachal Pradesh 0.00 0.00 0.00 0.00 0.00 0.00 0.00 0.00 0.00 0.003 Assam 0.00 0.00 0.00 0.00 0.00 0.00 0.00 0.00 0.00 0.004 Bihar 2.13 0.00 0.00 0.00 0.14 0.00 0.00 0.00 0.00 2.275 Goa 0.00 0.00 0.00 0.00 0.00 0.00 0.00 0.00 0.00 0.006 Gujarat 0.00 0.00 0.00 0.00 0.00 0.00 0.00 0.00 0.00 0.007 Haryana 0.00 0.00 0.00 0.00 0.00 0.00 0.00 0.00 0.00 0.008 Himachal Pradesh 0.06 0.00 0.00 0.00 0.00 0.00 0.00 0.00 0.15 0.219 Jammu <strong>and</strong> Kashmir 0.00 0.00 0.00 0.00 0.00 0.00 0.00 0.00 0.00 0.0010 Karnataka 30.53 0.00 1.35 0.00 0.00 0.00 0.00 0.00 0.09 31.9711 Kerala 0.00 0.00 0.00 0.00 0.00 0.00 0.00 0.00 0.00 0.0012 Madhya Pradesh 0.00 0.00 0.00 0.00 0.00 0.00 0.00 0.00 0.00 0.0013 Maharashtra 0.00 0.00 0.00 0.00 0.00 0.00 0.00 0.00 0.00 0.0014 Manipur 0.00 0.00 0.00 0.00 0.00 0.00 0.00 0.00 0.00 0.0015 Meghalaya 0.00 0.00 0.00 0.00 0.00 0.00 0.00 0.00 0.00 0.0016 Mizoram 0.00 0.00 0.00 0.00 0.00 0.00 0.00 0.00 0.00 0.0017 Nagal<strong>and</strong> 0.00 0.00 0.00 0.00 0.00 0.00 0.00 0.00 0.00 0.0018 Orissa 1.14 0.00 0.00 0.13 0.46 0.00 0.00 0.00 0.01 1.7419 Punjab 0.00 0.00 0.00 0.00 0.00 0.00 0.00 0.00 0.00 0.0020 Rajasthan 0.00 0.00 0.00 0.00 0.00 0.00 0.00 0.00 0.00 0.0021 Sikkim 0.00 0.00 0.00 0.00 0.00 0.00 0.00 0.00 0.00 0.0022 Tamil Nadu 23.17 0.00 4.25 0.00 0.00 0.00 0.00 0.00 0.00 27.4223 Tripura 0.00 0.00 0.00 0.00 0.00 0.00 0.00 0.00 0.00 0.0024 Uttar Pradesh 11.53 0.00 0.00 0.00 0.00 0.68 0.00 0.09 3.26 15.5625 West Bengal 0.00 0.00 0.00 0.00 0.00 0.00 0.00 0.00 0.00 0.0026 ALL INDIA 68.91 0.00 9.22 0.13 0.60 0.68 0.00 0.09 3.51 83.14
Annexure – XXIIILosses <strong>of</strong> Ragi dur<strong>in</strong>g Thresh<strong>in</strong>g(Triennium end<strong>in</strong>g 1998-99)(<strong>in</strong> ‘000 tonnes)Category <strong>of</strong> CultivatorSmall Medium Large AllS.No. Name <strong>of</strong> state Quantity Percent to production Quantity Percent to production <strong>of</strong> Quantity Percent to production Quantity Percent to production<strong>of</strong> categorycategory<strong>of</strong> category<strong>of</strong> category1 2 3 4 5 6 7 8 9 101 Andhra Pradesh 0.05 0.12 0.53 0.87 0.20 0.60 0.78 0.582 Arunachal Pradesh 0.00 0.00 0.00 0.00 0.00 0.00 0.00 0.003 Assam 0.00 0.00 0.00 0.00 0.00 0.00 0.00 0.004 Bihar 0.03 0.20 0.38 1.84 0.50 1.47 0.91 1.305 Goa 0.00 0.00 0.00 0.00 0.00 0.00 0.00 0.006 Gujarat 0.11 1.09 0.09 1.02 0.03 1.63 0.23 1.117 Haryana 0.00 0.00 0.00 0.00 0.00 0.00 0.00 0.008 Himachal Pradesh 0.00 0.00 0.03 1.27 0.03 1.85 0.06 0.939 Jammu <strong>and</strong> Kashmir 0.00 0.00 0.00 0.00 0.00 0.00 0.00 0.0010 Karnataka 1.34 0.27 3.98 1.08 4.84 1.08 10.16 0.7711 Kerala 0.00 0.00 0.00 0.00 0.00 0.00 0.00 0.0012 Madhya Pradesh 0.00 0.00 0.00 0.00 0.04 1.59 0.04 1.0813 Maharashtra 0.51 0.98 0.33 0.63 0.60 1.10 1.44 0.9114 Manipur 0.00 0.00 0.00 0.00 0.00 0.00 0.00 0.0015 Meghalaya 0.00 0.00 0.00 0.00 0.00 0.00 0.00 0.0016 Mizoram 0.00 0.00 0.00 0.00 0.00 0.00 0.00 0.0017 Nagal<strong>and</strong> 0.00 0.00 0.00 0.00 0.00 0.00 0.00 0.0018 Orissa 0.03 0.15 0.26 1.23 0.33 1.70 0.62 1.0319 Punjab 0.00 0.00 0.00 0.00 0.00 0.00 0.00 0.0020 Rajasthan 0.00 0.00 0.00 0.00 0.00 0.00 0.00 0.0021 Sikkim 0.00 0.00 0.00 0.00 0.00 0.00 0.00 0.0022 Tamil Nadu 0.02 0.02 0.86 0.96 1.04 1.12 1.92 0.6423 Tripura 0.00 0.00 0.00 0.00 0.00 0.00 0.00 0.0024 Uttar Pradesh 0.14 0.16 0.72 1.56 0.51 0.63 1.37 0.6425 West Bengal 0.00 0.00 0.00 0.00 0.00 0.00 0.00 0.0026 ALL INDIA 2.23 0.26 7.18 1.07 8.12 1.06 17.53 0.77
Annexure – XXIVLosses <strong>of</strong> Ragi dur<strong>in</strong>g Thresh<strong>in</strong>g – Source wise(Triennium end<strong>in</strong>g 1998-99)(<strong>in</strong> ‘000 tonnes)SourceS.No.Mechanical Animal Manual Total loss <strong>in</strong> thresh<strong>in</strong>gQuantity Percent to Percent to Quantity Percent to Percent to Quantity Percent to Percent to Quantity Percent to totalName <strong>of</strong> stateproduction col. 12production col. 12production col. 12production1 2 3 4 5 6 7 8 9 10 11 12 131 Andhra Pradesh 0.00 0.00 0.00 0.73 0.54 93.75 0.05 0.04 6.25 0.78 0.582 Arunachal Pradesh 0.00 0.00 0.00 0.00 0.00 0.00 0.00 0.00 0.00 0.00 0.003 Assam 0.00 0.00 0.00 0.00 0.00 0.00 0.00 0.00 0.00 0.00 0.004 Bihar 0.00 0.00 0.00 0.91 1.30 100.00 0.00 0.00 0.00 0.91 1.305 Goa 0.00 0.00 0.00 0.00 0.00 0.00 0.00 0.00 0.00 0.00 0.006 Gujarat 0.00 0.00 0.00 0.23 1.11 100.00 0.00 0.00 0.00 0.23 1.117 Haryana 0.00 0.00 0.00 0.00 0.00 0.00 0.00 0.00 0.00 0.00 0.008 Himachal Pradesh 0.06 0.93 0.00 0.00 0.00 0.00 0.00 0.00 0.00 0.06 0.939 Jammu <strong>and</strong> Kashmir 0.00 0.00 0.00 0.00 0.00 0.00 0.00 0.00 0.00 0.00 0.0010 Karnataka 0.82 0.06 8.05 6.03 0.46 59.34 3.31 0.25 32.61 10.16 0.7711 Kerala 0.00 0.00 0.00 0.00 0.00 0.00 0.00 0.00 0.00 0.00 0.0012 Madhya Pradesh 0.04 1.08 100.00 0.00 0.00 0.00 0.00 0.00 0.00 0.04 1.0813 Maharashtra 0.00 0.00 0.00 0.80 0.50 55.56 0.64 0.40 44.44 1.44 0.9114 Manipur 0.00 0.00 0.00 0.00 0.00 0.00 0.00 0.00 0.00 0.00 0.0015 Meghalaya 0.00 0.00 0.00 0.00 0.00 0.00 0.00 0.00 0.00 0.00 0.0016 Mizoram 0.00 0.00 0.00 0.00 0.00 0.00 0.00 0.00 0.00 0.00 0.0017 Nagal<strong>and</strong> 0.00 0.00 0.00 0.00 0.00 0.00 0.00 0.00 0.00 0.00 0.0018 Orissa 0.00 0.00 0.00 0.01 0.01 0.99 0.61 1.02 99.01 0.62 1.0319 Punjab 0.00 0.00 0.00 0.00 0.00 0.00 0.00 0.00 0.00 0.00 0.0020 Rajasthan 0.00 0.00 0.00 0.00 0.00 0.00 0.00 0.00 0.00 0.00 0.0021 Sikkim 0.00 0.00 0.00 0.00 0.00 0.00 0.00 0.00 0.00 0.00 0.0022 Tamil Nadu 0.18 0.06 9.39 1.08 0.36 56.09 0.66 0.22 34.52 1.92 0.6423 Tripura 0.00 0.00 0.00 0.00 0.00 0.00 0.00 0.00 0.00 0.00 0.0024 Uttar Pradesh 0.03 0.02 2.37 0.08 0.04 5.93 1.26 0.59 91.70 1.37 0.6425 West Bengal 0.00 0.00 0.00 0.00 0.00 0.00 0.00 0.00 0.00 0.00 0.0026 ALL INDIA 1.13 0.05 6.45 9.86 0.43 56.27 6.53 0.29 37.28 17.53 0.77
Annexure – XXVLosses <strong>of</strong> Ragi dur<strong>in</strong>g W<strong>in</strong>now<strong>in</strong>g(Triennium end<strong>in</strong>g 1998-99)(<strong>in</strong> ‘000 tonnes)S.No.Category <strong>of</strong> CultivatorSmall Medium Large AllName <strong>of</strong> state Quantity Percent to production Quantity Percent to production Quantity Percent to production Quantity Percent to production<strong>of</strong> category<strong>of</strong> category<strong>of</strong> category<strong>of</strong> category1 2 3 4 5 6 7 8 9 101 Andhra Pradesh 0.63 1.56 0.52 0.85 0.22 0.66 1.37 1.022 Arunachal Pradesh 0.00 0.00 0.00 0.00 0.00 0.00 0.00 0.003 Assam 0.00 0.00 0.00 0.00 0.00 0.00 0.00 0.004 Bihar 0.05 0.33 0.29 1.40 0.51 1.50 0.85 1.225 Goa 0.00 0.00 0.00 0.00 0.00 0.00 0.00 0.006 Gujarat 0.11 1.09 0.09 1.02 0.03 1.63 0.23 1.117 Haryana 0.00 0.00 0.00 0.00 0.00 0.00 0.00 0.008 Himachal Pradesh 0.00 0.00 0.03 1.27 0.02 1.23 0.05 0.779 Jammu <strong>and</strong> Kashmir 0.00 0.00 0.00 0.00 0.00 0.00 0.00 0.0010 Karnataka 1.27 0.25 3.89 1.05 4.34 0.97 9.50 0.7211 Kerala 0.00 0.00 0.00 0.00 0.00 0.00 0.00 0.0012 Madhya Pradesh 0.00 0.00 0.00 0.00 0.04 1.59 0.04 1.0813 Maharashtra 0.51 0.98 0.33 0.63 0.61 1.12 1.45 0.9114 Manipur 0.00 0.00 0.00 0.00 0.00 0.00 0.00 0.0015 Meghalaya 0.00 0.00 0.00 0.00 0.00 0.00 0.00 0.0016 Mizoram 0.00 0.00 0.00 0.00 0.00 0.00 0.00 0.0017 Nagal<strong>and</strong> 0.00 0.00 0.00 0.00 0.00 0.00 0.00 0.0018 Orissa 0.05 0.25 0.25 1.18 0.34 1.76 0.64 1.0619 Punjab 0.00 0.00 0.00 0.00 0.00 0.00 0.00 0.0020 Rajasthan 0.00 0.00 0.00 0.00 0.00 0.00 0.00 0.0021 Sikkim 0.00 0.00 0.00 0.00 0.00 0.00 0.00 0.0022 Tamil Nadu 0.11 0.09 0.42 0.47 1.03 1.11 1.56 0.5223 Tripura 0.00 0.00 0.00 0.00 0.00 0.00 0.00 0.0024 Uttar Pradesh 0.61 0.71 0.72 1.56 0.41 0.51 1.74 0.8225 West Bengal 0.00 0.00 0.00 0.00 0.00 0.00 0.00 0.0026 ALL INDIA 3.34 0.40 6.54 0.97 7.55 0.98 17.43 0.76
S.No.Name <strong>of</strong> stateLosses <strong>of</strong> Ragi dur<strong>in</strong>g W<strong>in</strong>now<strong>in</strong>g – Mechanical / Manual(Triennium end<strong>in</strong>g 1998-99)Source <strong>of</strong> powerAnnexure – XXVI(<strong>in</strong> ‘000 tonnes)Total loss <strong>in</strong> w<strong>in</strong>now<strong>in</strong>gMechanicalManualQuantity Percent to Percent to col. Quantity Percent to Percent to Quantity Percent to totalproduction 9production col. 9production1 2 3 4 5 6 7 8 9 101 Andhra Pradesh 0.59 0.44 43.07 0.78 0.58 56.93 1.37 1.022 Arunachal Pradesh 0.00 0.00 0.00 0.00 0.00 0.00 0.00 0.003 Assam 0.00 0.00 0.00 0.00 0.00 0.00 0.00 0.004 Bihar 0.28 0.40 32.94 0.57 0.82 67.06 0.85 1.225 Goa 0.00 0.00 0.00 0.00 0.00 0.00 0.00 0.006 Gujarat 0.08 0.38 34.78 0.15 0.72 65.22 0.23 1.117 Haryana 0.00 0.00 0.00 0.00 0.00 0.00 0.00 0.008 Himachal Pradesh 0.00 0.00 0.00 0.05 0.77 100.00 0.05 0.779 Jammu <strong>and</strong> Kashmir 0.00 0.00 0.00 0.00 0.00 0.00 0.00 0.0010 Karnataka 1.79 0.14 18.84 7.71 0.59 81.16 9.50 0.7211 Kerala 0.00 0.00 0.00 0.00 0.00 0.00 0.00 0.0012 Madhya Pradesh 0.02 0.54 50.00 0.02 0.54 50.00 0.04 1.0813 Maharashtra 0.80 0.50 55.17 0.65 0.41 44.83 1.45 0.9114 Manipur 0.00 0.00 0.00 0.00 0.00 0.00 0.00 0.0015 Meghalaya 0.00 0.00 0.00 0.00 0.00 0.00 0.00 0.0016 Mizoram 0.00 0.00 0.00 0.00 0.00 0.00 0.00 0.0017 Nagal<strong>and</strong> 0.00 0.00 0.00 0.00 0.00 0.00 0.00 0.0018 Orissa 0.00 0.00 0.00 0.64 1.06 100.00 0.64 1.0619 Punjab 0.00 0.00 0.00 0.00 0.00 0.00 0.00 0.0020 Rajasthan 0.00 0.00 0.00 0.00 0.00 0.00 0.00 0.0021 Sikkim 0.00 0.00 0.00 0.00 0.00 0.00 0.00 0.0022 Tamil Nadu 0.10 0.03 6.23 1.46 0.49 93.77 1.56 0.5223 Tripura 0.00 0.00 0.00 0.00 0.00 0.00 0.00 0.0024 Uttar Pradesh 0.11 0.05 6.58 1.63 0.76 93.42 1.74 0.8225 West Bengal 0.00 0.00 0.00 0.00 0.00 0.00 0.00 0.0026 ALL INDIA 1.12 0.05 6.40 16.31 0.71 93.60 17.43 0.76
Annexure –X XVIILosses <strong>of</strong> Ragi <strong>in</strong> Transport from Field to Thresh<strong>in</strong>g Floor(Triennium end<strong>in</strong>g 1998-99) (<strong>in</strong> ‘000 tonnes)S.No. Name <strong>of</strong> stateCategory <strong>of</strong> CultivatorSmall Medium Large AllQuantity Percent to production<strong>of</strong> categoryQuantity Percent to production<strong>of</strong> categoryQuantity Percent to production<strong>of</strong> categoryQuantity Percent to production<strong>of</strong> category1 3 4 5 6 7 8 9 101 Andhra Pradesh 0.27 0.67 0.42 0.69 0.15 0.45 0.84 0.622 Arunachal Pradesh 0.00 0.00 0.00 0.00 0.00 0.00 0.00 0.003 Assam 0.00 0.00 0.00 0.00 0.00 0.00 0.00 0.004 Bihar 0.14 0.92 0.36 1.74 0.35 1.03 0.85 1.225 Goa 0.00 0.00 0.00 0.00 0.00 0.00 0.00 0.006 Gujarat 0.07 0.69 0.07 0.79 0.01 0.54 0.15 0.727 Haryana 0.00 0.00 0.00 0.00 0.00 0.00 0.00 0.008 Himachal Pradesh 0.00 0.00 0.02 0.84 0.01 0.62 0.03 0.469 Jammu <strong>and</strong> Kashmir 0.00 0.00 0.00 0.00 0.00 0.00 0.00 0.0010 Karnataka 2.50 0.50 2.52 0.68 2.25 0.50 7.27 0.5511 Kerala 0.00 0.00 0.00 0.00 0.00 0.00 0.00 0.0012 Madhya Pradesh 0.03 3.26 0.00 0.00 0.01 0.40 0.04 1.0813 Maharashtra 0.61 1.17 0.31 0.59 0.24 0.44 1.16 0.7314 Manipur 0.00 0.00 0.00 0.00 0.00 0.00 0.00 0.0015 Meghalaya 0.00 0.00 0.00 0.00 0.00 0.00 0.00 0.0016 Mizoram 0.00 0.00 0.00 0.00 0.00 0.00 0.00 0.0017 Nagal<strong>and</strong> 0.00 0.00 0.00 0.00 0.00 0.00 0.00 0.0018 Orissa 0.22 1.10 0.20 0.95 0.08 0.41 0.50 0.8319 Punjab 0.00 0.00 0.00 0.00 0.00 0.00 0.00 0.0020 Rajasthan 0.00 0.00 0.00 0.00 0.00 0.00 0.00 0.0021 Sikkim 0.00 0.00 0.00 0.00 0.00 0.00 0.00 0.0022 Tamil Nadu 1.19 1.01 0.42 0.47 0.37 0.40 1.98 0.6623 Tripura 0.00 0.00 0.00 0.00 0.00 0.00 0.00 0.0024 Uttar Pradesh 0.25 0.29 0.61 1.33 0.42 0.52 1.28 0.6025 West Bengal 0.00 0.00 0.00 0.00 0.00 0.00 0.00 0.0026 ALL INDIA 5.28 0.63 4.93 0.73 3.89 0.51 14.10 0.62
Annexure –X XVIIILosses <strong>of</strong> Ragi <strong>in</strong> Transport from Field to Thresh<strong>in</strong>g Floor – By Mode <strong>of</strong> Transport Used(Triennium end<strong>in</strong>g 1998-99) (<strong>in</strong> ‘000 tonnes)Mode <strong>of</strong> transportS.No.Head loads Pack animals Bullock cart Tractor trolley Others Total lossName <strong>of</strong> state Quantity Percent to Quantity Percent to Quantity Percent to Quantity Percent to Quantity Percent to Quantity Percent toproductionproductionproductionproduction production production1 2 3 4 5 6 7 8 9 10 11 12 13 141 Andhra Pradesh 0.84 0.62 0.00 0.00 0.00 0.00 0.00 0.00 0.00 0.00 0.84 0.622 Arunachal Pradesh 0.00 0.00 0.00 0.00 0.00 0.00 0.00 0.00 0.00 0.00 0.00 0.003 Assam 0.00 0.00 0.00 0.00 0.00 0.00 0.00 0.00 0.00 0.00 0.00 0.004 Bihar 0.85 1.22 0.00 0.00 0.00 0.00 0.00 0.00 0.00 0.00 0.85 1.225 Goa 0.00 0.00 0.00 0.00 0.00 0.00 0.00 0.00 0.00 0.00 0.00 0.006 Gujarat 0.15 0.72 0.00 0.00 0.00 0.00 0.00 0.00 0.00 0.00 0.15 0.727 Haryana 0.00 0.00 0.00 0.00 0.00 0.00 0.00 0.00 0.00 0.00 0.00 0.008 Himachal Pradesh 0.03 0.46 0.00 0.00 0.00 0.00 0.00 0.00 0.00 0.00 0.03 0.469 Jammu <strong>and</strong> Kashmir 0.00 0.00 0.00 0.00 0.00 0.00 0.00 0.00 0.00 0.00 0.00 0.0010 Karnataka 2.83 0.21 0.63 0.05 3.57 0.27 0.24 0.02 0.00 0.00 7.27 0.5511 Kerala 0.00 0.00 0.00 0.00 0.00 0.00 0.00 0.00 0.00 0.00 0.00 0.0012 Madhya Pradesh 0.02 0.43 0.00 0.00 0.00 0.00 0.02 0.65 0.00 0.00 0.04 1.0813 Maharashtra 1.16 0.73 0.00 0.00 0.00 0.00 0.00 0.00 0.00 0.00 1.16 0.7314 Manipur 0.00 0.00 0.00 0.00 0.00 0.00 0.00 0.00 0.00 0.00 0.00 0.0015 Meghalaya 0.00 0.00 0.00 0.00 0.00 0.00 0.00 0.00 0.00 0.00 0.00 0.0016 Mizoram 0.00 0.00 0.00 0.00 0.00 0.00 0.00 0.00 0.00 0.00 0.00 0.0017 Nagal<strong>and</strong> 0.00 0.00 0.00 0.00 0.00 0.00 0.00 0.00 0.00 0.00 0.00 0.0018 Orissa 0.50 0.83 0.00 0.00 0.00 0.00 0.00 0.00 0.00 0.00 0.50 0.8319 Punjab 0.00 0.00 0.00 0.00 0.00 0.00 0.00 0.00 0.00 0.00 0.00 0.0020 Rajasthan 0.00 0.00 0.00 0.00 0.00 0.00 0.00 0.00 0.00 0.00 0.00 0.0021 Sikkim 0.00 0.00 0.00 0.00 0.00 0.00 0.00 0.00 0.00 0.00 0.00 0.0022 Tamil Nadu 1.94 0.65 0.00 0.00 0.04 0.01 0.00 0.00 0.00 0.00 1.98 0.6623 Tripura 0.00 0.00 0.00 0.00 0.00 0.00 0.00 0.00 0.00 0.00 0.00 0.0024 Uttar Pradesh 1.28 0.60 0.00 0.00 0.00 0.00 0.00 0.00 0.00 0.00 1.28 0.6025 West Bengal 0.00 0.00 0.00 0.00 0.00 0.00 0.00 0.00 0.00 0.00 0.00 0.0026 ALL INDIA 9.59 0.42 0.63 0.03 3.61 0.16 0.26 0.01 0.00 0.00 14.10 0.62
Annexure – XXIXLosses <strong>of</strong> Ragi <strong>in</strong> Transport from Thresh<strong>in</strong>g Floor to Storage(Triennium end<strong>in</strong>g 1998-99)Category Of Cultivator(<strong>in</strong> ‘000 tonnes)Small Medium Large AllQuantity Percent to production<strong>of</strong> categoryQuantity Percent to production<strong>of</strong> categoryQuantity Percent to production<strong>of</strong> categoryQuantity Percent to production<strong>of</strong> category1 2 3 4 5 6 7 8 9 101 Andhra Pradesh 1.29 3.19 0.22 0.36 0.09 0.27 1.60 1.192 Arunachal Pradesh 0.00 0.00 0.00 0.00 0.00 0.00 0.00 0.003 Assam 0.00 0.00 0.00 0.00 0.00 0.00 0.00 0.004 Bihar 0.70 4.58 0.09 0.43 0.28 0.83 1.07 1.535 Goa 0.00 0.00 0.00 0.00 0.00 0.00 0.00 0.006 Gujarat 0.07 0.69 0.05 0.57 0.01 0.54 0.13 0.637 Haryana 0.00 0.00 0.00 0.00 0.00 0.00 0.00 0.008 Himachal Pradesh 0.00 0.00 0.02 0.84 0.01 0.62 0.03 0.469 Jammu <strong>and</strong> Kashmir 0.00 0.00 0.00 0.00 0.00 0.00 0.00 0.0010 Karnataka 9.87 1.98 2.24 0.61 2.79 0.62 14.90 1.1311 Kerala 0.00 0.00 0.00 0.00 0.00 0.00 0.00 0.0012 Madhya Pradesh 0.04 4.35 0.00 0.00 0.01 0.40 0.05 1.3613 Maharashtra 0.35 0.67 0.30 0.57 0.24 0.44 0.89 0.5614 Manipur 0.00 0.00 0.00 0.00 0.00 0.00 0.00 0.0015 Meghalaya 0.00 0.00 0.00 0.00 0.00 0.00 0.00 0.0016 Mizoram 0.00 0.00 0.00 0.00 0.00 0.00 0.00 0.0017 Nagal<strong>and</strong> 0.00 0.00 0.00 0.00 0.00 0.00 0.00 0.0018 Orissa 0.80 4.01 0.20 0.95 0.08 0.41 1.08 1.7919 Punjab 0.00 0.00 0.00 0.00 0.00 0.00 0.00 0.0020 Rajasthan 0.00 0.00 0.00 0.00 0.00 0.00 0.00 0.0021 Sikkim 0.00 0.00 0.00 0.00 0.00 0.00 0.00 0.0022 Tamil Nadu 3.26 2.78 0.21 0.23 0.28 0.30 3.75 1.2523 Tripura 0.00 0.00 0.00 0.00 0.00 0.00 0.00 0.0024 Uttar Pradesh 1.90 2.21 0.28 0.61 0.09 0.11 2.27 1.0725 West Bengal 0.00 0.00 0.00 0.00 0.00 0.00 0.00 0.0026 ALL INDIA 18.28 2.17 3.61 0.54 3.88 0.51 25.77 1.13
Annexure – XXXS.No.Name <strong>of</strong> stateLosses <strong>of</strong> Ragi <strong>in</strong> Transport from Thresh<strong>in</strong>g Floor to Storage – By Mode <strong>of</strong> Transport Used(Triennium end<strong>in</strong>g 1998-99) (<strong>in</strong> ‘000 tonnes)Mode <strong>of</strong> transportHead loads Pack animals Bullock cart Tractor trolley Others Total lossQuantity Percent toproductionQuantityPercent toproductionQuantityPercent toproductionQuantityPercent toproductionQuantityPercent toproductionQuantityPercent toproduction1 2 3 4 5 6 7 8 9 10 11 12 13 141 Andhra Pradesh 0.00 0.00 0.00 0.00 1.52 1.13 0.08 0.06 0.00 0.00 1.60 1.192 Arunachal Pradesh 0.00 0.00 0.00 0.00 0.00 0.00 0.00 0.00 0.00 0.00 0.00 0.003 Assam 0.00 0.00 0.00 0.00 0.00 0.00 0.00 0.00 0.00 0.00 0.00 0.004 Bihar 1.07 1.53 0.00 0.00 0.00 0.00 0.00 0.00 0.00 0.00 1.07 1.535 Goa 0.00 0.00 0.00 0.00 0.00 0.00 0.00 0.00 0.00 0.00 0.00 0.006 Gujarat 0.03 0.14 0.00 0.00 0.10 0.48 0.00 0.00 0.00 0.00 0.13 0.637 Haryana 0.00 0.00 0.00 0.00 0.00 0.00 0.00 0.00 0.00 0.00 0.00 0.008 Himachal Pradesh 0.03 0.46 0.00 0.00 0.00 0.00 0.00 0.00 0.00 0.00 0.03 0.469 Jammu <strong>and</strong> Kashmir 0.00 0.00 0.00 0.00 0.00 0.00 0.00 0.00 0.00 0.00 0.00 0.0010 Karnataka 1.00 0.08 0.15 0.01 12.64 0.96 1.10 0.08 0.00 0.00 14.90 1.1311 Kerala 0.00 0.00 0.00 0.00 0.00 0.00 0.00 0.00 0.00 0.00 0.00 0.0012 Madhya Pradesh 0.00 0.00 0.00 0.00 0.03 0.68 0.03 0.68 0.00 0.00 0.05 1.3613 Maharashtra 0.89 0.56 0.00 0.00 0.00 0.00 0.00 0.00 0.00 0.00 0.89 0.5614 Manipur 0.00 0.00 0.00 0.00 0.00 0.00 0.00 0.00 0.00 0.00 0.00 0.0015 Meghalaya 0.00 0.00 0.00 0.00 0.00 0.00 0.00 0.00 0.00 0.00 0.00 0.0016 Mizoram 0.00 0.00 0.00 0.00 0.00 0.00 0.00 0.00 0.00 0.00 0.00 0.0017 Nagal<strong>and</strong> 0.00 0.00 0.00 0.00 0.00 0.00 0.00 0.00 0.00 0.00 0.00 0.0018 Orissa 1.08 1.79 0.00 0.00 0.00 0.00 0.00 0.00 0.00 0.00 1.08 1.7919 Punjab 0.00 0.00 0.00 0.00 0.00 0.00 0.00 0.00 0.00 0.00 0.00 0.0020 Rajasthan 0.00 0.00 0.00 0.00 0.00 0.00 0.00 0.00 0.00 0.00 0.00 0.0021 Sikkim 0.00 0.00 0.00 0.00 0.00 0.00 0.00 0.00 0.00 0.00 0.00 0.0022 Tamil Nadu 3.31 1.11 0.00 0.00 0.44 0.15 0.00 0.00 0.00 0.00 3.75 1.2523 Tripura 0.00 0.00 0.00 0.00 0.00 0.00 0.00 0.00 0.00 0.00 0.00 0.0024 Uttar Pradesh 2.27 1.07 0.00 0.00 0.00 0.00 0.00 0.00 0.00 0.00 2.27 1.0725 West Bengal 0.00 0.00 0.00 0.00 0.00 0.00 0.00 0.00 0.00 0.00 0.00 0.0026 ALL INDIA 9.68 0.42 0.15 0.01 14.73 0.65 1.21 0.05 0.00 0.00 25.77 1.13
Annexure – XXXITotal Losses <strong>of</strong> Ragi <strong>in</strong> Transport from Field to Storage – By Mode Of Pack<strong>in</strong>g(Triennium end<strong>in</strong>g 1998-99) (<strong>in</strong> ‘000 tonnes)Field to thresh<strong>in</strong>g floorThresh<strong>in</strong>g floor to storageTotal <strong>losses</strong> <strong>in</strong> transportMode <strong>of</strong> pack<strong>in</strong>gMode <strong>of</strong> pack<strong>in</strong>gfrom field to storageIn bulk In bags In bulk In bagsS.No. Name <strong>of</strong> state Quantity Percent toproductionQuantity Percent toproductionQuantity Percent toProductionQuantity Percent toproductionQuantity Percent toproduction1 2 3 4 5 6 7 8 9 10 11 121 Andhra Pradesh 0.84 0.62 0.00 0.00 1.53 1.14 0.07 0.05 2.44 1.812 Arunachal Pradesh 0.00 0.00 0.00 0.00 0.00 0.00 0.00 0.00 0.00 0.003 Assam 0.00 0.00 0.00 0.00 0.00 0.00 0.00 0.00 0.00 0.004 Bihar 0.85 1.22 0.00 0.00 0.87 1.24 0.20 0.29 1.92 2.755 Goa 0.00 0.00 0.00 0.00 0.00 0.00 0.00 0.00 0.00 0.006 Gujarat 0.15 0.72 0.00 0.00 0.13 0.63 0.00 0.00 0.28 1.357 Haryana 0.00 0.00 0.00 0.00 0.00 0.00 0.00 0.00 0.00 0.008 Himachal Pradesh 0.03 0.46 0.00 0.00 0.03 0.46 0.00 0.00 0.06 0.939 Jammu <strong>and</strong> Kashmir 0.00 0.00 0.00 0.00 0.00 0.00 0.00 0.00 0.00 0.0010 Karnataka 7.27 0.55 0.00 0.00 13.49 1.02 1.41 0.11 22.17 1.6811 Kerala 0.00 0.00 0.00 0.00 0.00 0.00 0.00 0.00 0.00 0.0012 Madhya Pradesh 0.04 1.08 0.00 0.00 0.04 0.99 0.01 0.36 0.09 2.4413 Maharashtra 1.16 0.73 0.00 0.00 0.89 0.56 0.00 0.00 2.05 1.2914 Manipur 0.00 0.00 0.00 0.00 0.00 0.00 0.00 0.00 0.00 0.0015 Meghalaya 0.00 0.00 0.00 0.00 0.00 0.00 0.00 0.00 0.00 0.0016 Mizoram 0.00 0.00 0.00 0.00 0.00 0.00 0.00 0.00 0.00 0.0017 Nagal<strong>and</strong> 0.00 0.00 0.00 0.00 0.00 0.00 0.00 0.00 0.00 0.0018 Orissa 0.50 0.83 0.00 0.00 1.07 1.77 0.01 0.02 1.58 2.6119 Punjab 0.00 0.00 0.00 0.00 0.00 0.00 0.00 0.00 0.00 0.0020 Rajasthan 0.00 0.00 0.00 0.00 0.00 0.00 0.00 0.00 0.00 0.0021 Sikkim 0.00 0.00 0.00 0.00 0.00 0.00 0.00 0.00 0.00 0.0022 Tamil Nadu 1.98 0.66 0.00 0.00 3.69 1.23 0.06 0.02 5.73 1.9123 Tripura 0.00 0.00 0.00 0.00 0.00 0.00 0.00 0.00 0.00 0.0024 Uttar Pradesh 1.28 0.60 0.00 0.00 2.03 0.95 0.24 0.11 3.55 1.6725 West Bengal 0.00 0.00 0.00 0.00 0.00 0.00 0.00 0.00 0.00 0.0026 ALL INDIA 14.10 0.62 0.00 0.00 23.77 1.04 2.00 0.09 39.87 1.75
Annexure – XXXIILosses <strong>of</strong> Ragi dur<strong>in</strong>g Storage at Farm Level(Triennium end<strong>in</strong>g 1998-99)(<strong>in</strong> ‘000 tonnes)S.No. Name <strong>of</strong> stateCategory <strong>of</strong> CultivatorSmall Medium Large AllQuantity Quantity loss % Quantity Quantity loss % Quantity Quantity loss % Quantity Quantity loss %stored loststored loststored loststored lost1 2 3 4 5 6 7 8 9 10 11 12 13 141 Andhra Pradesh 7.67 0.03 0.39 20.34 0.39 1.92 26.84 0.14 0.52 54.85 0.56 1.022 Arunachal Pradesh 0.00 0.00 0.00 0.00 0.00 0.00 0.00 0.00 0.00 0.00 0.00 0.003 Assam 0.00 0.00 0.00 0.00 0.00 0.00 0.00 0.00 0.00 0.00 0.00 0.004 Bihar 12.28 0.01 0.08 17.61 0.17 0.97 17.33 0.20 1.15 47.22 0.38 0.805 Goa 0.00 0.00 0.00 0.00 0.00 0.00 0.00 0.00 0.00 0.00 0.00 0.006 Gujarat 7.01 0.05 0.71 5.62 0.07 1.25 7.21 0.01 0.14 19.84 0.13 0.667 Haryana 0.00 0.00 0.00 0.00 0.00 0.00 0.00 0.00 0.00 0.00 0.00 0.008 Himachal Pradesh 1.52 0.00 0.00 1.48 0.02 1.35 0.33 0.01 3.03 3.33 0.03 0.909 Jammu <strong>and</strong> Kashmir 0.00 0.00 0.00 0.00 0.00 0.00 0.00 0.00 0.00 0.00 0.00 0.0010 Karnataka 362.44 2.79 0.77 229.07 3.33 1.45 195.88 2.42 1.24 787.39 8.54 1.0811 Kerala 0.00 0.00 0.00 0.00 0.00 0.00 0.00 0.00 0.00 0.00 0.00 0.0012 Madhya Pradesh 0.63 0.03 4.76 0.57 0.02 3.51 0.34 0.01 2.94 1.54 0.06 3.9013 Maharashtra 42.34 0.24 0.57 35.46 0.32 0.90 34.88 0.17 0.49 112.68 0.73 0.6514 Manipur 0.00 0.00 0.00 0.00 0.00 0.00 0.00 0.00 0.00 0.00 0.00 0.0015 Meghalaya 0.00 0.00 0.00 0.00 0.00 0.00 0.00 0.00 0.00 0.00 0.00 0.0016 Mizoram 0.00 0.00 0.00 0.00 0.00 0.00 0.00 0.00 0.00 0.00 0.00 0.0017 Nagal<strong>and</strong> 0.00 0.00 0.00 0.00 0.00 0.00 0.00 0.00 0.00 0.00 0.00 0.0018 Orissa 6.51 0.05 0.77 5.58 0.20 3.58 5.37 0.07 1.30 17.46 0.32 1.8319 Punjab 0.00 0.00 0.00 0.00 0.00 0.00 0.00 0.00 0.00 0.00 0.00 0.0020 Rajasthan 0.00 0.00 0.00 0.00 0.00 0.00 0.00 0.00 0.00 0.00 0.00 0.0021 Sikkim 0.00 0.00 0.00 0.00 0.00 0.00 0.00 0.00 0.00 0.00 0.00 0.0022 Tamil Nadu 50.71 0.09 0.18 16.25 0.04 0.25 29.35 0.33 1.12 96.31 0.46 0.4823 Tripura 0.00 0.00 0.00 0.00 0.00 0.00 0.00 0.00 0.00 0.00 0.00 0.0024 Uttar Pradesh 17.85 0.21 1.18 25.38 0.37 1.46 12.21 0.28 2.29 55.44 0.86 1.5525 West Bengal 0.00 0.00 0.00 0.00 0.00 0.00 0.00 0.00 0.00 0.00 0.00 0.0026 ALL INDIA 508.96 3.50 0.69 357.36 4.93 1.38 329.74 3.64 1.10 1196.06 12.07 1.01
S. No. Name <strong>of</strong> stateLosses <strong>of</strong> Ragi dur<strong>in</strong>g Storage at Farm Level – By Type <strong>and</strong> Mode <strong>of</strong> Storage Annexure – XXXIII(Triennium end<strong>in</strong>g 1998-99) (<strong>in</strong> ‘000 tonnes)Type <strong>of</strong> storageMode <strong>of</strong> storageKutcha storage Pucca storage In bulks In bags Partly <strong>in</strong> bags & <strong>in</strong> bulkQuantity Quantity loss % Quantity Quantity loss % Quantity Quantity loss Quantity Quantity loss Quantity Quantity lossstored loststored loststored lost % stored lost % stored lost %1 2 3 4 5 6 7 8 9 10 11 12 13 14 15 16 171 Andhra Pradesh 34.42 0.48 1.39 20.42 0.08 0.39 0.00 0.00 0.00 18.30 0.15 0.82 36.54 0.41 1.122 Arunachal Pradesh 0.00 0.00 0.00 0.00 0.00 0.00 0.00 0.00 0.00 0.00 0.00 0.00 0.00 0.00 0.003 Assam 0.00 0.00 0.00 0.00 0.00 0.00 0.00 0.00 0.00 0.00 0.00 0.00 0.00 0.00 0.004 Bihar 34.32 0.36 1.05 12.90 0.02 0.16 0.00 0.00 0.00 15.37 0.12 0.78 31.85 0.26 0.825 Goa 0.00 0.00 0.00 0.00 0.00 0.00 0.00 0.00 0.00 0.00 0.00 0.00 0.00 0.00 0.006 Gujarat 13.25 0.12 0.93 6.59 0.007 0.11 0.00 0.00 0.00 9.10 0.07 0.77 10.74 0.06 0.567 Haryana 0.00 0.00 0.00 0.00 0.00 0.00 0.00 0.00 0.00 0.00 0.00 0.00 0.00 0.00 0.008 Himachal Pradesh 2.31 0.03 1.08 1.02 0.005 0.49 0.00 0.00 0.00 1.49 0.02 1.01 1.84 0.015 0.829 Jammu <strong>and</strong> Kashmir 0.00 0.00 0.00 0.00 0.00 0.00 0.00 0.00 0.00 0.00 0.00 0.00 0.00 0.00 0.0010 Karnataka 556.82 6.92 1.24 230.58 1.62 0.70 0.00 0.00 0.00 600.43 6.66 1.11 186.97 1.88 1.0111 Kerala 0.00 0.00 0.00 0.00 0.00 0.00 0.00 0.00 0.00 0.00 0.00 0.00 0.00 0.00 0.0012 Madhya Pradesh 0.68 0.04 5.88 0.86 0.02 2.33 0.00 0.00 0.00 0.73 0.04 5.48 0.81 0.02 2.4713 Maharashtra 70.18 0.54 0.77 42.50 0.19 0.45 0.00 0.00 0.00 77.77 0.55 0.71 34.91 0.18 0.5214 Manipur 0.00 0.00 0.00 0.00 0.00 0.00 0.00 0.00 0.00 0.00 0.00 0.00 0.00 0.00 0.0015 Meghalaya 0.00 0.00 0.00 0.00 0.00 0.00 0.00 0.00 0.00 0.00 0.00 0.00 0.00 0.00 0.0016 Mizoram 0.00 0.00 0.00 0.00 0.00 0.00 0.00 0.00 0.00 0.00 0.00 0.00 0.00 0.00 0.0017 Nagal<strong>and</strong> 0.00 0.00 0.00 0.00 0.00 0.00 0.00 0.00 0.00 0.00 0.00 0.00 0.00 0.00 0.0018 Orissa 10.58 0.21 1.98 6.88 0.11 1.60 0.00 0.00 0.00 12.80 0.28 2.19 4.66 0.04 0.8619 Punjab 0.00 0.00 0.00 0.00 0.00 0.00 0.00 0.00 0.00 0.00 0.00 0.00 0.00 0.00 0.0020 Rajasthan 0.00 0.00 0.00 0.00 0.00 0.00 0.00 0.00 0.00 0.00 0.00 0.00 0.00 0.00 0.0021 Sikkim 0.00 0.00 0.00 0.00 0.00 0.00 0.00 0.00 0.00 0.00 0.00 0.00 0.00 0.00 0.0022 Tamil Nadu 65.29 0.38 0.58 31.02 0.08 0.26 0.00 0.00 0.00 62.97 0.34 0.54 33.34 0.12 0.3623 Tripura 0.00 0.00 0.00 0.00 0.00 0.00 0.00 0.00 0.00 0.00 0.00 0.00 0.00 0.00 0.0024 Uttar Pradesh 34.02 0.75 2.20 21.42 0.11 0.51 0.00 0.00 0.00 27.20 0.53 1.95 28.24 0.33 1.1725 West Bengal 0.00 0.00 0.00 0.00 0.00 0.00 0.00 0.00 0.00 0.00 0.00 0.00 0.00 0.00 0.0026 ALL INDIA 821.87 9.83 1.20 374.19 2.24 0.60 0.00 0.00 0.00 826.16 8.76 1.06 369.90 3.32 0.90
Annexure – XXXIVS.No.Name <strong>of</strong> stateQuantitylostLosses <strong>of</strong> Ragi dur<strong>in</strong>g Storage at Farm Level–By Causes <strong>of</strong> <strong>losses</strong>(Triennium end<strong>in</strong>g 1998-99) (<strong>in</strong> ‘000 tonnes)Causes <strong>of</strong> <strong>losses</strong>Driage Rodents Infestation H<strong>and</strong>l<strong>in</strong>g Quality deterioration OthersPercent tocol. 15QuantitylostPercent tocol. 15QuantitylostPercent tocol. 15QuantitylostPercent tocol. 15QuantitylostPercent tocol. 15QuantitylostPercent tocol. 151 2 3 4 5 6 7 8 9 10 11 12 13 14 151 Andhra Pradesh 0.16 28.57 0.30 53.57 0.02 3.57 0.08 14.29 0.00 0.00 0.00 0.00 0.562 Arunachal Pradesh 0.00 0.00 0.00 0.00 0.00 0.00 0.00 0.00 0.00 0.00 0.00 0.00 0.003 Assam 0.00 0.00 0.00 0.00 0.00 0.00 0.00 0.00 0.00 0.00 0.00 0.00 0.004 Bihar 0.09 23.68 0.27 71.05 0.01 2.63 0.01 2.63 0.00 0.00 0.00 0.00 0.385 Goa 0.00 0.00 0.00 0.00 0.00 0.00 0.00 0.00 0.00 0.00 0.00 0.00 0.006 Gujarat 0.02 15.38 0.11 84.62 0.00 0.00 0.00 0.00 0.00 0.00 0.00 0.00 0.137 Haryana 0.00 0.00 0.00 0.00 0.00 0.00 0.00 0.00 0.00 0.00 0.00 0.00 0.008 Himachal Pradesh 0.00 0.00 0.03 100.00 0.00 0.00 0.00 0.00 0.00 0.00 0.00 0.00 0.039 Jammu <strong>and</strong> Kashmir 0.00 0.00 0.00 0.00 0.00 0.00 0.00 0.00 0.00 0.00 0.00 0.00 0.0010 Karnataka 1.40 16.39 3.95 46.25 1.66 19.44 1.08 12.65 0.45 5.27 0.00 0.00 8.5411 Kerala 0.00 0.00 0.00 0.00 0.00 0.00 0.00 0.00 0.00 0.00 0.00 0.00 0.0012 Madhya Pradesh 0.00 0.00 0.06 100.00 0.00 0.00 0.00 0.00 0.00 0.00 0.00 0.00 0.0613 Maharashtra 0.00 0.00 0.73 100.00 0.00 0.00 0.00 0.00 0.00 0.00 0.00 0.00 0.7314 Manipur 0.00 0.00 0.00 0.00 0.00 0.00 0.00 0.00 0.00 0.00 0.00 0.00 0.0015 Meghalaya 0.00 0.00 0.00 0.00 0.00 0.00 0.00 0.00 0.00 0.00 0.00 0.00 0.0016 Mizoram 0.00 0.00 0.00 0.00 0.00 0.00 0.00 0.00 0.00 0.00 0.00 0.00 0.0017 Nagal<strong>and</strong> 0.00 0.00 0.00 0.00 0.00 0.00 0.00 0.00 0.00 0.00 0.00 0.00 0.0018 Orissa 0.02 6.25 0.18 56.25 0.00 0.00 0.12 37.50 0.00 0.00 0.00 0.00 0.3219 Punjab 0.00 0.00 0.00 0.00 0.00 0.00 0.00 0.00 0.00 0.00 0.00 0.00 0.0020 Rajasthan 0.00 0.00 0.00 0.00 0.00 0.00 0.00 0.00 0.00 0.00 0.00 0.00 0.0021 Sikkim 0.00 0.00 0.00 0.00 0.00 0.00 0.00 0.00 0.00 0.00 0.00 0.00 0.0022 Tamil Nadu 0.12 26.09 0.34 73.91 0.00 0.00 0.00 0.00 0.00 0.00 0.00 0.00 0.4623 Tripura 0.00 0.00 0.00 0.00 0.00 0.00 0.00 0.00 0.00 0.00 0.00 0.00 0.0024 Uttar Pradesh 0.76 88.37 0.10 11.63 0.00 0.00 0.00 0.00 0.00 0.00 0.00 0.00 0.8625 West Bengal 0.00 0.00 0.00 0.00 0.00 0.00 0.00 0.00 0.00 0.00 0.00 0.00 0.0026 ALL INDIA 2.57 21.29 6.07 50.29 1.69 14.00 1.29 10.69 0.45 3.73 0.00 0.00 12.07TotalQty.lost
S.No.Name <strong>of</strong> stateTotal Post Harvest Losses <strong>of</strong> Ragi at Producer’s Level – Small Category Cultivators Annexure – XXXV(Triennium end<strong>in</strong>g 1998-99) (<strong>in</strong> ‘000 tonnes)Losses <strong>in</strong> thresh<strong>in</strong>g Losses <strong>in</strong> w<strong>in</strong>now<strong>in</strong>g Losses <strong>in</strong> transport Losses dur<strong>in</strong>g storage at Total <strong>losses</strong> atthresh<strong>in</strong>g floor to producer’s level producer’s levelstorageLosses <strong>in</strong> transportfield to thresh<strong>in</strong>g floorQuantitylostPercent toproduction<strong>of</strong> categoryQuantitylostPercent toproduction<strong>of</strong> categoryQuantitylostPercent toproduction<strong>of</strong> categoryQuantitylostPercent toproduction <strong>of</strong>categoryQuantitylostPercent toproduction <strong>of</strong>categoryQuantitylostPercent toproduction<strong>of</strong> category1 2 3 4 5 6 7 8 9 10 11 12 13 141 Andhra Pradesh 0.27 0.67 0.05 0.12 0.63 1.56 1.29 3.19 0.03 0.07 2.27 5.612 Arunachal Pradesh 0.00 0.00 0.00 0.00 0.00 0.00 0.00 0.00 0.00 0.00 0.00 0.003 Assam 0.00 0.00 0.00 0.00 0.00 0.00 0.00 0.00 0.00 0.00 0.00 0.004 Bihar 0.14 0.92 0.03 0.20 0.05 0.33 0.70 4.58 0.01 0.07 0.93 6.085 Goa 0.00 0.00 0.00 0.00 0.00 0.00 0.00 0.00 0.00 0.00 0.00 0.006 Gujarat 0.07 0.69 0.11 1.09 0.11 1.09 0.07 0.69 0.05 0.49 0.41 4.067 Haryana 0.00 0.00 0.00 0.00 0.00 0.00 0.00 0.00 0.00 0.00 0.00 0.008 Himachal Pradesh 0.00 0.00 0.00 0.00 0.00 0.00 0.00 0.00 0.00 0.00 0.00 0.009 Jammu <strong>and</strong> Kashmir 0.00 0.00 0.00 0.00 0.00 0.00 0.00 0.00 0.00 0.00 0.00 0.0010 Karnataka 2.50 0.50 1.34 0.27 1.27 0.25 9.87 1.98 2.79 0.56 17.77 3.5611 Kerala 0.00 0.00 0.00 0.00 0.00 0.00 0.00 0.00 0.00 0.00 0.00 0.0012 Madhya Pradesh 0.03 3.26 0.00 0.00 0.00 0.00 0.04 4.35 0.03 3.26 0.10 10.8713 Maharashtra 0.61 1.17 0.51 0.98 0.51 0.98 0.35 0.67 0.24 0.46 2.22 4.2614 Manipur 0.00 0.00 0.00 0.00 0.00 0.00 0.00 0.00 0.00 0.00 0.00 0.0015 Meghalaya 0.00 0.00 0.00 0.00 0.00 0.00 0.00 0.00 0.00 0.00 0.00 0.0016 Mizoram 0.00 0.00 0.00 0.00 0.00 0.00 0.00 0.00 0.00 0.00 0.00 0.0017 Nagal<strong>and</strong> 0.00 0.00 0.00 0.00 0.00 0.00 0.00 0.00 0.00 0.00 0.00 0.0018 Orissa 0.22 1.10 0.03 0.15 0.05 0.25 0.80 4.01 0.05 0.25 1.15 5.7719 Punjab 0.00 0.00 0.00 0.00 0.00 0.00 0.00 0.00 0.00 0.00 0.00 0.0020 Rajasthan 0.00 0.00 0.00 0.00 0.00 0.00 0.00 0.00 0.00 0.00 0.00 0.0021 Sikkim 0.00 0.00 0.00 0.00 0.00 0.00 0.00 0.00 0.00 0.00 0.00 0.0022 Tamil Nadu 1.19 1.01 0.02 0.02 0.11 0.09 3.26 2.78 0.09 0.08 4.67 3.9823 Tripura 0.00 0.00 0.00 0.00 0.00 0.00 0.00 0.00 0.00 0.00 0.00 0.0024 Uttar Pradesh 0.25 0.29 0.14 0.16 0.61 0.71 1.90 2.21 0.21 0.24 3.11 3.6225 West Bengal 0.00 0.00 0.00 0.00 0.00 0.00 0.00 0.00 0.00 0.00 0.00 0.0026 ALL INDIA 5.28 0.63 2.23 0.26 3.34 0.40 18.28 2.17 3.50 0.41 32.63 3.87
Annexure – XXXVIS.No.Name <strong>of</strong> stateTotal Post Harvest <strong>losses</strong> <strong>of</strong> Ragi at Producer’s Level – Medium Category Cultivators(Triennium end<strong>in</strong>g 1998-99) (<strong>in</strong> ‘000 tonnes)Losses <strong>in</strong> transportfield to thresh<strong>in</strong>g floorLosses <strong>in</strong> thresh<strong>in</strong>g Losses <strong>in</strong>w<strong>in</strong>now<strong>in</strong>gLosses <strong>in</strong> transportthresh<strong>in</strong>g floor to storageLosses dur<strong>in</strong>g storageat producer’s levelTotal <strong>losses</strong> atproducer’s levelQuantitylostPercent toproduction<strong>of</strong> categoryQuantitylostPercent toproduction<strong>of</strong> categoryQuantitylostPercent toproduction<strong>of</strong> categoryQuantitylostPercent toproduction <strong>of</strong>categoryQuantitylostPercent toproduction<strong>of</strong> categoryQuantitylostPercent toproduction<strong>of</strong> category1 2 3 4 5 6 7 8 9 10 11 12 13 141 Andhra Pradesh 0.42 0.69 0.53 0.87 0.52 0.85 0.22 0.36 0.39 0.64 2.08 3.422 Arunachal Pradesh 0.00 0.00 0.00 0.00 0.00 0.00 0.00 0.00 0.00 0.00 0.00 0.003 Assam 0.00 0.00 0.00 0.00 0.00 0.00 0.00 0.00 0.00 0.00 0.00 0.004 Bihar 0.36 1.74 0.38 1.84 0.29 1.40 0.09 0.43 0.17 0.82 1.29 6.235 Goa 0.00 0.00 0.00 0.00 0.00 0.00 0.00 0.00 0.00 0.00 0.00 0.006 Gujarat 0.07 0.79 0.09 1.02 0.09 1.02 0.05 0.57 0.07 0.79 0.37 4.197 Haryana 0.00 0.00 0.00 0.00 0.00 0.00 0.00 0.00 0.00 0.00 0.00 0.008 Himachal Pradesh 0.02 0.84 0.03 1.27 0.03 1.27 0.02 0.84 0.02 0.84 0.12 5.069 Jammu <strong>and</strong> Kashmir 0.00 0.00 0.00 0.00 0.00 0.00 0.00 0.00 0.00 0.00 0.00 0.0010 Karnataka 2.52 0.68 3.98 1.08 3.89 1.05 2.24 0.61 3.33 0.90 15.96 4.3211 Kerala 0.00 0.00 0.00 0.00 0.00 0.00 0.00 0.00 0.00 0.00 0.00 0.0012 Madhya Pradesh 0.00 0.00 0.00 0.00 0.00 0.00 0.00 0.00 0.02 8.00 0.02 8.0013 Maharashtra 0.31 0.59 0.33 0.63 0.33 0.63 0.30 0.57 0.32 0.61 1.59 3.0414 Manipur 0.00 0.00 0.00 0.00 0.00 0.00 0.00 0.00 0.00 0.00 0.00 0.0015 Meghalaya 0.00 0.00 0.00 0.00 0.00 0.00 0.00 0.00 0.00 0.00 0.00 0.0016 Mizoram 0.00 0.00 0.00 0.00 0.00 0.00 0.00 0.00 0.00 0.00 0.00 0.0017 Nagal<strong>and</strong> 0.00 0.00 0.00 0.00 0.00 0.00 0.00 0.00 0.00 0.00 0.00 0.0018 Orissa 0.20 0.95 0.26 1.23 0.25 1.18 0.20 0.95 0.20 0.95 1.11 5.2519 Punjab 0.00 0.00 0.00 0.00 0.00 0.00 0.00 0.00 0.00 0.00 0.00 0.0020 Rajasthan 0.00 0.00 0.00 0.00 0.00 0.00 0.00 0.00 0.00 0.00 0.00 0.0021 Sikkim 0.00 0.00 0.00 0.00 0.00 0.00 0.00 0.00 0.00 0.00 0.00 0.0022 Tamil Nadu 0.42 0.47 0.86 0.96 0.42 0.47 0.21 0.23 0.04 0.04 1.95 2.1823 Tripura 0.00 0.00 0.00 0.00 0.00 0.00 0.00 0.00 0.00 0.00 0.00 0.0024 Uttar Pradesh 0.61 1.33 0.72 1.56 0.72 1.56 0.28 0.61 0.37 0.80 2.70 5.8725 West Bengal 0.00 0.00 0.00 0.00 0.00 0.00 0.00 0.00 0.00 0.00 0.00 0.0026 ALL INDIA 4.93 0.73 7.18 1.07 6.54 0.97 3.61 0.54 4.93 0.73 27.19 4.05
Annexure – XXXVIIS.No. Name <strong>of</strong> state QuantitylostTotal Post Harvest <strong>losses</strong> <strong>of</strong> Ragi at Producer’s Level – Large Category Cultivators(Triennium end<strong>in</strong>g 1998-99) (<strong>in</strong> ‘000 tonnes)Losses <strong>in</strong> thresh<strong>in</strong>g Losses <strong>in</strong> w<strong>in</strong>now<strong>in</strong>g Losses <strong>in</strong> transport Losses dur<strong>in</strong>g storage Total <strong>losses</strong> atthresh<strong>in</strong>g floor to at producer’s level producer’s levelstorageLosses <strong>in</strong> transportfield to thresh<strong>in</strong>g floorPercent toproduction<strong>of</strong> categoryQuantitylostPercent toproduction<strong>of</strong> categoryQuantitylostPercent toproduction<strong>of</strong> categoryQuantitylostPercent toproduction<strong>of</strong> categoryQuantitylostPercent toproduction<strong>of</strong> categoryQuantitylostPercent toproduction<strong>of</strong> category1 2 3 4 5 6 7 8 9 10 11 12 13 141 Andhra Pradesh 0.15 0.45 0.20 0.60 0.22 0.66 0.09 0.27 0.14 0.42 0.80 2.402 Arunachal Pradesh 0.00 0.00 0.00 0.00 0.00 0.00 0.00 0.00 0.00 0.00 0.00 0.003 Assam 0.00 0.00 0.00 0.00 0.00 0.00 0.00 0.00 0.00 0.00 0.00 0.004 Bihar 0.35 1.03 0.50 1.47 0.51 1.50 0.28 0.83 0.20 0.59 1.84 5.435 Goa 0.00 0.00 0.00 0.00 0.00 0.00 0.00 0.00 0.00 0.00 0.00 0.006 Gujarat 0.01 0.54 0.03 1.63 0.03 1.63 0.01 0.54 0.01 0.54 0.09 4.897 Haryana 0.00 0.00 0.00 0.00 0.00 0.00 0.00 0.00 0.00 0.00 0.00 0.008 Himachal Pradesh 0.01 0.62 0.03 1.85 0.02 1.23 0.01 0.62 0.01 0.62 0.08 4.949 Jammu <strong>and</strong> Kashmir 0.00 0.00 0.00 0.00 0.00 0.00 0.00 0.00 0.00 0.00 0.00 0.0010 Karnataka 2.25 0.50 4.84 1.08 4.34 0.97 2.79 0.62 2.42 0.54 16.64 3.7211 Kerala 0.00 0.00 0.00 0.00 0.00 0.00 0.00 0.00 0.00 0.00 0.00 0.0012 Madhya Pradesh 0.01 0.40 0.04 1.59 0.04 1.59 0.01 0.40 0.01 0.40 0.11 4.3713 Maharashtra 0.24 0.44 0.60 1.10 0.61 1.12 0.24 0.44 0.17 0.31 1.86 3.4214 Manipur 0.00 0.00 0.00 0.00 0.00 0.00 0.00 0.00 0.00 0.00 0.00 0.0015 Meghalaya 0.00 0.00 0.00 0.00 0.00 0.00 0.00 0.00 0.00 0.00 0.00 0.0016 Mizoram 0.00 0.00 0.00 0.00 0.00 0.00 0.00 0.00 0.00 0.00 0.00 0.0017 Nagal<strong>and</strong> 0.00 0.00 0.00 0.00 0.00 0.00 0.00 0.00 0.00 0.00 0.00 0.0018 Orissa 0.08 0.41 0.33 1.70 0.34 1.76 0.08 0.41 0.07 0.36 0.90 4.6519 Punjab 0.00 0.00 0.00 0.00 0.00 0.00 0.00 0.00 0.00 0.00 0.00 0.0020 Rajasthan 0.00 0.00 0.00 0.00 0.00 0.00 0.00 0.00 0.00 0.00 0.00 0.0021 Sikkim 0.00 0.00 0.00 0.00 0.00 0.00 0.00 0.00 0.00 0.00 0.00 0.0022 Tamil Nadu 0.37 0.40 1.04 1.12 1.03 1.11 0.28 0.30 0.33 0.36 3.05 3.3023 Tripura 0.00 0.00 0.00 0.00 0.00 0.00 0.00 0.00 0.00 0.00 0.00 0.0024 Uttar Pradesh 0.42 0.52 0.51 0.63 0.41 0.51 0.09 0.11 0.28 0.35 1.71 2.1225 West Bengal 0.00 0.00 0.00 0.00 0.00 0.00 0.00 0.00 0.00 0.00 0.00 0.0026 ALL INDIA 3.89 0.51 8.12 1.06 7.55 0.98 3.88 0.51 3.64 0.47 27.08 3.53
Annexure – XXXVIIIS.No.Name <strong>of</strong> stateField to thresh<strong>in</strong>gfloorQuantity Percent tolost productionTotal Post Harvest <strong>losses</strong> <strong>of</strong> Ragi at Producer’s Level – All Category Cultivators(Triennium end<strong>in</strong>g 1998-99)Dur<strong>in</strong>g thresh<strong>in</strong>g Dur<strong>in</strong>g w<strong>in</strong>now<strong>in</strong>g Thresh<strong>in</strong>g floor tostoragePercent to Quantity Percent to Quantity Percent toproduction lost production lost production<strong>of</strong> category <strong>of</strong> category<strong>of</strong> categoryQuantitylostDur<strong>in</strong>g storage atproducer’s levelQuantity Percent tolost production(<strong>in</strong> ‘000 tonnes)Total <strong>losses</strong> atproducer’s levelPercent toproduction<strong>of</strong> categoryQuantitylost<strong>of</strong> category<strong>of</strong> category1 2 3 4 5 6 7 8 9 10 11 12 13 141 Andhra Pradesh 0.84 0.62 0.78 0.58 1.37 1.02 1.60 1.19 0.56 0.42 5.15 3.832 Arunachal Pradesh 0.00 0.00 0.00 0.00 0.00 0.00 0.00 0.00 0.00 0.00 0.00 0.003 Assam 0.00 0.00 0.00 0.00 0.00 0.00 0.00 0.00 0.00 0.00 0.00 0.004 Bihar 0.85 1.22 0.91 1.30 0.85 1.22 1.07 1.53 0.38 0.54 4.06 5.815 Goa 0.00 0.00 0.00 0.00 0.00 0.00 0.00 0.00 0.00 0.00 0.00 0.006 Gujarat 0.15 0.72 0.23 1.11 0.23 1.11 0.13 0.63 0.13 0.63 0.87 4.187 Haryana 0.00 0.00 0.00 0.00 0.00 0.00 0.00 0.00 0.00 0.00 0.00 0.008 Himachal Pradesh 0.03 0.46 0.06 0.93 0.05 0.77 0.03 0.46 0.03 0.46 0.20 3.109 Jammu <strong>and</strong> Kashmir 0.00 0.00 0.00 0.00 0.00 0.00 0.00 0.00 0.00 0.00 0.00 0.0010 Karnataka 7.27 0.55 10.16 0.77 9.50 0.72 14.90 1.13 8.54 0.65 50.37 3.8311 Kerala 0.00 0.00 0.00 0.00 0.00 0.00 0.00 0.00 0.00 0.00 0.00 0.0012 Madhya Pradesh 0.04 1.08 0.04 1.08 0.04 1.08 0.05 1.36 0.06 1.63 0.23 6.2313 Maharashtra 1.16 0.73 1.44 0.91 1.45 0.91 0.89 0.56 0.73 0.46 5.67 3.5714 Manipur 0.00 0.00 0.00 0.00 0.00 0.00 0.00 0.00 0.00 0.00 0.00 0.0015 Meghalaya 0.00 0.00 0.00 0.00 0.00 0.00 0.00 0.00 0.00 0.00 0.00 0.0016 Mizoram 0.00 0.00 0.00 0.00 0.00 0.00 0.00 0.00 0.00 0.00 0.00 0.0017 Nagal<strong>and</strong> 0.00 0.00 0.00 0.00 0.00 0.00 0.00 0.00 0.00 0.00 0.00 0.0018 Orissa 0.50 0.83 0.62 1.03 0.64 1.06 1.08 1.79 0.32 0.53 3.16 5.2319 Punjab 0.00 0.00 0.00 0.00 0.00 0.00 0.00 0.00 0.00 0.00 0.00 0.0020 Rajasthan 0.00 0.00 0.00 0.00 0.00 0.00 0.00 0.00 0.00 0.00 0.00 0.0021 Sikkim 0.00 0.00 0.00 0.00 0.00 0.00 0.00 0.00 0.00 0.00 0.00 0.0022 Tamil Nadu 1.98 0.66 1.92 0.64 1.56 0.52 3.75 1.25 0.46 0.15 9.67 3.2323 Tripura 0.00 0.00 0.00 0.00 0.00 0.00 0.00 0.00 0.00 0.00 0.00 0.0024 Uttar Pradesh 1.28 0.60 1.37 0.64 1.74 0.82 2.27 1.07 0.86 0.40 7.52 3.5325 West Bengal 0.00 0.00 0.00 0.00 0.00 0.00 0.00 0.00 0.00 0.00 0.00 0.0026 ALL INDIA 14.10 0.62 17.53 0.77 17.43 0.76 25.77 1.13 12.07 0.53 86.90 3.81
Annexure – XXXIXS.No.Total Sale <strong>of</strong> Ragi-Quarterwise – Small Category Cultivators(Triennium end<strong>in</strong>g 1998-99)(<strong>in</strong> ‘000 tonnes)Total saleName <strong>of</strong> stateQuarter <strong>of</strong> saleI II III IVQty. % to col. 11 Qty. % to col. 11 Qty. % to col. 11 Qty. % to col. 111 2 3 4 5 6 7 8 9 10 111 Andhra Pradesh 0.00 0.00 10.41 100.00 0.00 0.00 0.00 0.00 10.412 Arunachal Pradesh 0.00 0.00 0.00 0.00 0.00 0.00 0.00 0.00 0.003 Assam 0.00 0.00 0.00 0.00 0.00 0.00 0.00 0.00 0.004 Bihar 0.00 0.00 0.00 0.00 0.00 0.00 0.00 0.00 0.005 Goa 0.00 0.00 0.00 0.00 0.00 0.00 0.00 0.00 0.006 Gujarat 0.00 0.00 0.00 0.00 1.57 100.00 0.00 0.00 1.577 Haryana 0.00 0.00 0.00 0.00 0.00 0.00 0.00 0.00 0.008 Himachal Pradesh 0.00 0.00 0.00 0.00 0.00 0.00 0.00 0.00 0.009 Jammu <strong>and</strong> Kashmir 0.00 0.00 0.00 0.00 0.00 0.00 0.00 0.00 0.0010 Karnataka 0.00 0.00 33.34 25.12 98.88 74.50 0.51 0.38 132.7311 Kerala 0.00 0.00 0.00 0.00 0.00 0.00 0.00 0.00 0.0012 Madhya Pradesh 0.00 0.00 0.00 0.00 0.11 100.00 0.00 0.00 0.1113 Maharashtra 0.00 0.00 0.00 0.00 6.33 100.00 0.00 0.00 6.3314 Manipur 0.00 0.00 0.00 0.00 0.00 0.00 0.00 0.00 0.0015 Meghalaya 0.00 0.00 0.00 0.00 0.00 0.00 0.00 0.00 0.0016 Mizoram 0.00 0.00 0.00 0.00 0.00 0.00 0.00 0.00 0.0017 Nagal<strong>and</strong> 0.00 0.00 0.00 0.00 0.00 0.00 0.00 0.00 0.0018 Orissa 0.00 0.00 0.06 1.06 5.48 96.65 0.13 2.29 5.6719 Punjab 0.00 0.00 0.00 0.00 0.00 0.00 0.00 0.00 0.0020 Rajasthan 0.00 0.00 0.00 0.00 0.00 0.00 0.00 0.00 0.0021 Sikkim 0.00 0.00 0.00 0.00 0.00 0.00 0.00 0.00 0.0022 Tamil Nadu 0.00 0.00 5.22 25.06 9.52 45.70 6.09 29.24 20.8323 Tripura 0.00 0.00 0.00 0.00 0.00 0.00 0.00 0.00 0.0024 Uttar Pradesh 0.00 0.00 8.61 100.00 0.00 0.00 0.00 0.00 8.6125 West Bengal 0.00 0.00 0.00 0.00 0.00 0.00 0.00 0.00 0.0026 ALL INDIA 0.00 0.00 57.64 30.95 121.89 65.44 6.73 3.61 186.26
Annexure – XXXXTotal Sale <strong>of</strong> Ragi-Quarterwise – Medium Category Cultivators(Triennium end<strong>in</strong>g 1998-99)(<strong>in</strong> ‘000 tonnes)Quarter Of SaleTotal saleS.No. Name <strong>of</strong> stateI II III IVQty. % to col. 11 Qty. % to col. 11 Qty. % to col. 11 Qty. % to col. 111 2 3 4 5 6 7 8 9 10 111 Andhra Pradesh 0.00 0.00 18.49 39.12 25.72 54.42 3.05 6.45 47.262 Arunachal Pradesh 0.00 0.00 0.00 0.00 0.00 0.00 0.00 0.00 0.003 Assam 0.00 0.00 0.00 0.00 0.00 0.00 0.00 0.00 0.004 Bihar 0.00 0.00 0.00 0.00 0.00 0.00 0.00 0.00 0.005 Goa 0.00 0.00 0.00 0.00 0.00 0.00 0.00 0.00 0.006 Gujarat 0.00 0.00 0.00 0.00 1.60 100.00 0.00 0.00 1.607 Haryana 0.00 0.00 0.00 0.00 0.00 0.00 0.00 0.00 0.008 Himachal Pradesh 0.00 0.00 0.00 0.00 0.00 0.00 0.00 0.00 0.009 Jammu <strong>and</strong> Kashmir 0.00 0.00 0.00 0.00 0.00 0.00 0.00 0.00 0.0010 Karnataka 0.00 0.00 33.76 25.41 98.53 74.16 0.58 0.44 132.8711 Kerala 0.00 0.00 0.00 0.00 0.00 0.00 0.00 0.00 0.0012 Madhya Pradesh 0.00 0.00 0.00 0.00 0.03 100.00 0.00 0.00 0.0313 Maharashtra 0.00 0.00 0.00 0.00 9.79 100.00 0.00 0.00 9.7914 Manipur 0.00 0.00 0.00 0.00 0.00 0.00 0.00 0.00 0.0015 Meghalaya 0.00 0.00 0.00 0.00 0.00 0.00 0.00 0.00 0.0016 Mizoram 0.00 0.00 0.00 0.00 0.00 0.00 0.00 0.00 0.0017 Nagal<strong>and</strong> 0.00 0.00 0.00 0.00 0.00 0.00 0.00 0.00 0.0018 Orissa 0.00 0.00 0.04 0.80 1.63 32.80 3.30 66.40 4.9719 Punjab 0.00 0.00 0.00 0.00 0.00 0.00 0.00 0.00 0.0020 Rajasthan 0.00 0.00 0.00 0.00 0.00 0.00 0.00 0.00 0.0021 Sikkim 0.00 0.00 0.00 0.00 0.00 0.00 0.00 0.00 0.0022 Tamil Nadu 0.00 0.00 4.74 23.21 5.35 26.20 10.33 50.59 20.4223 Tripura 0.00 0.00 0.00 0.00 0.00 0.00 0.00 0.00 0.0024 Uttar Pradesh 0.00 0.00 8.62 100.00 0.00 0.00 0.00 0.00 8.6225 West Bengal 0.00 0.00 0.00 0.00 0.00 0.00 0.00 0.00 0.0026 ALL INDIA 0.00 0.00 65.65 29.11 142.65 63.24 17.26 7.65 225.56
Annexure – XXXXITotal Sale <strong>of</strong> Ragi-Quarterwise – Large Category Cultivators(Triennium end<strong>in</strong>g 1998-99)(<strong>in</strong> ‘000 tonnes)Quarter <strong>of</strong> saleTotal saleS.No. Name <strong>of</strong> stateI II III IVQty. % to col. 11 Qty. % to col. 11 Qty. % to col. 11 Qty. % to col. 111 2 3 4 5 6 7 8 9 10 111 Andhra Pradesh 0.00 0.00 26.11 98.98 0.00 0.00 0.27 1.02 26.382 Arunachal Pradesh 0.00 0.00 0.00 0.00 0.00 0.00 0.00 0.00 0.003 Assam 0.00 0.00 0.00 0.00 0.00 0.00 0.00 0.00 0.004 Bihar 0.00 0.00 0.00 0.00 0.00 0.00 0.00 0.00 0.005 Goa 0.00 0.00 0.00 0.00 0.00 0.00 0.00 0.00 0.006 Gujarat 0.00 0.00 0.00 0.00 0.35 100.00 0.00 0.00 0.357 Haryana 0.00 0.00 0.00 0.00 0.00 0.00 0.00 0.00 0.008 Himachal Pradesh 0.00 0.00 0.00 0.00 0.00 0.00 0.00 0.00 0.009 Jammu <strong>and</strong> Kashmir 0.00 0.00 0.00 0.00 0.00 0.00 0.00 0.00 0.0010 Karnataka 0.00 0.00 65.42 40.77 94.74 59.05 0.29 0.18 160.4511 Kerala 0.00 0.00 0.00 0.00 0.00 0.00 0.00 0.00 0.0012 Madhya Pradesh 0.00 0.00 0.00 0.00 0.47 100.00 0.00 0.00 0.4713 Maharashtra 0.00 0.00 0.00 0.00 11.00 100.00 0.00 0.00 11.0014 Manipur 0.00 0.00 0.00 0.00 0.00 0.00 0.00 0.00 0.0015 Meghalaya 0.00 0.00 0.00 0.00 0.00 0.00 0.00 0.00 0.0016 Mizoram 0.00 0.00 0.00 0.00 0.00 0.00 0.00 0.00 0.0017 Nagal<strong>and</strong> 0.00 0.00 0.00 0.00 0.00 0.00 0.00 0.00 0.0018 Orissa 0.00 0.00 0.00 0.00 4.19 85.16 0.73 14.84 4.9219 Punjab 0.00 0.00 0.00 0.00 0.00 0.00 0.00 0.00 0.0020 Rajasthan 0.00 0.00 0.00 0.00 0.00 0.00 0.00 0.00 0.0021 Sikkim 0.00 0.00 0.00 0.00 0.00 0.00 0.00 0.00 0.0022 Tamil Nadu 0.00 0.00 6.40 29.85 6.29 29.34 8.75 40.81 21.4423 Tripura 0.00 0.00 0.00 0.00 0.00 0.00 0.00 0.00 0.0024 Uttar Pradesh 0.02 0.12 5.85 35.45 0.00 0.00 10.63 64.42 16.5025 West Bengal 0.00 0.00 0.00 0.00 0.00 0.00 0.00 0.00 0.0026 ALL INDIA 0.02 0.01 103.78 42.97 117.04 48.46 20.67 8.56 241.51
Annexure –XXXXIITotal Sale <strong>of</strong> Ragi-Quarterwise – All Category Cultivators(Triennium end<strong>in</strong>g 1998-99)(<strong>in</strong> ‘000 tonnes)Quarter <strong>of</strong> saleTotal saleS.No. Name <strong>of</strong> stateI II III IVQty. % to col. 11 Qty. % to col. 11 Qty. % to col. 11 Qty. % to col. 111 2 3 4 5 6 7 8 9 10 111 Andhra Pradesh 0.00 0.00 55.01 65.45 25.72 30.60 3.32 3.95 84.052 Arunachal Pradesh 0.00 0.00 0.00 0.00 0.00 0.00 0.00 0.00 0.003 Assam 0.00 0.00 0.00 0.00 0.00 0.00 0.00 0.00 0.004 Bihar 0.00 0.00 0.00 0.00 0.00 0.00 0.00 0.00 0.005 Goa 0.00 0.00 0.00 0.00 0.00 0.00 0.00 0.00 0.006 Gujarat 0.00 0.00 0.00 0.00 3.52 100.00 0.00 0.00 3.527 Haryana 0.00 0.00 0.00 0.00 0.00 0.00 0.00 0.00 0.008 Himachal Pradesh 0.00 0.00 0.00 0.00 0.00 0.00 0.00 0.00 0.009 Jammu <strong>and</strong> Kashmir 0.00 0.00 0.00 0.00 0.00 0.00 0.00 0.00 0.0010 Karnataka 0.00 0.00 132.52 31.10 292.15 68.57 1.38 0.32 426.0511 Kerala 0.00 0.00 0.00 0.00 0.00 0.00 0.00 0.00 0.0012 Madhya Pradesh 0.00 0.00 0.00 0.00 0.61 100.00 0.00 0.00 0.6113 Maharashtra 0.00 0.00 0.00 0.00 27.12 100.00 0.00 0.00 27.1214 Manipur 0.00 0.00 0.00 0.00 0.00 0.00 0.00 0.00 0.0015 Meghalaya 0.00 0.00 0.00 0.00 0.00 0.00 0.00 0.00 0.0016 Mizoram 0.00 0.00 0.00 0.00 0.00 0.00 0.00 0.00 0.0017 Nagal<strong>and</strong> 0.00 0.00 0.00 0.00 0.00 0.00 0.00 0.00 0.0018 Orissa 0.00 0.00 0.10 0.64 11.30 72.62 4.16 26.74 15.5619 Punjab 0.00 0.00 0.00 0.00 0.00 0.00 0.00 0.00 0.0020 Rajasthan 0.00 0.00 0.00 0.00 0.00 0.00 0.00 0.00 0.0021 Sikkim 0.00 0.00 0.00 0.00 0.00 0.00 0.00 0.00 0.0022 Tamil Nadu 0.00 0.00 16.36 26.10 21.16 33.75 25.17 40.15 62.6923 Tripura 0.00 0.00 0.00 0.00 0.00 0.00 0.00 0.00 0.0024 Uttar Pradesh 0.02 0.06 23.08 68.43 0.00 0.00 10.63 31.51 33.7325 West Bengal 0.00 0.00 0.00 0.00 0.00 0.00 0.00 0.00 0.0026 ALL INDIA 0.02 0.004 227.07 34.76 381.58 58.41 44.66 6.83 653.33
Annexure –XXXXIIIS.No.Sale <strong>of</strong> Ragi – Agencywise – Small Category Cultivators(Triennium end<strong>in</strong>g 1998-99)(<strong>in</strong> ‘000 tonnes)AgencyConsumers Traders Co-operatives F.C.I. Money lenders Others TotalName <strong>of</strong> state Quantity Percent to Quantity Percent to Quantity Percent Quantity Percent to Quantity Percent to Quantity Percent to salescol. 15col. 15to col. 15col. 15col. 15col. 151 2 3 4 5 6 7 8 9 10 11 12 13 14 151 Andhra Pradesh 0.00 0.00 10.41 100.00 0.00 0.00 0.00 0.00 0.00 0.00 0.00 0.00 10.412 Arunachal Pradesh 0.00 0.00 0.00 0.00 0.00 0.00 0.00 0.00 0.00 0.00 0.00 0.00 0.003 Assam 0.00 0.00 0.00 0.00 0.00 0.00 0.00 0.00 0.00 0.00 0.00 0.00 0.004 Bihar 0.00 0.00 0.00 0.00 0.00 0.00 0.00 0.00 0.00 0.00 0.00 0.00 0.005 Goa 0.00 0.00 0.00 0.00 0.00 0.00 0.00 0.00 0.00 0.00 0.00 0.00 0.006 Gujarat 0.27 17.20 1.30 82.80 0.00 0.00 0.00 0.00 0.00 0.00 0.00 0.00 1.577 Haryana 0.00 0.00 0.00 0.00 0.00 0.00 0.00 0.00 0.00 0.00 0.00 0.00 0.008 Himachal Pradesh 0.00 0.00 0.00 0.00 0.00 0.00 0.00 0.00 0.00 0.00 0.00 0.00 0.009 Jammu <strong>and</strong> Kashmir 0.00 0.00 0.00 0.00 0.00 0.00 0.00 0.00 0.00 0.00 0.00 0.00 0.0010 Karnataka 5.84 4.40 100.79 75.94 2.19 1.65 0.00 0.00 23.91 18.01 0.00 0.00 132.7311 Kerala 0.00 0.00 0.00 0.00 0.00 0.00 0.00 0.00 0.00 0.00 0.00 0.00 0.0012 Madhya Pradesh 0.00 0.00 0.11 100.00 0.00 0.00 0.00 0.00 0.00 0.00 0.00 0.00 0.1113 Maharashtra 0.13 2.05 6.20 97.95 0.00 0.00 0.00 0.00 0.00 0.00 0.00 0.00 6.3314 Manipur 0.00 0.00 0.00 0.00 0.00 0.00 0.00 0.00 0.00 0.00 0.00 0.00 0.0015 Meghalaya 0.00 0.00 0.00 0.00 0.00 0.00 0.00 0.00 0.00 0.00 0.00 0.00 0.0016 Mizoram 0.00 0.00 0.00 0.00 0.00 0.00 0.00 0.00 0.00 0.00 0.00 0.00 0.0017 Nagal<strong>and</strong> 0.00 0.00 0.00 0.00 0.00 0.00 0.00 0.00 0.00 0.00 0.00 0.00 0.0018 Orissa 0.00 0.00 5.67 100.00 0.00 0.00 0.00 0.00 0.00 0.00 0.00 0.00 5.6719 Punjab 0.00 0.00 0.00 0.00 0.00 0.00 0.00 0.00 0.00 0.00 0.00 0.00 0.0020 Rajasthan 0.00 0.00 0.00 0.00 0.00 0.00 0.00 0.00 0.00 0.00 0.00 0.00 0.0021 Sikkim 0.00 0.00 0.00 0.00 0.00 0.00 0.00 0.00 0.00 0.00 0.00 0.00 0.0022 Tamil Nadu 1.32 6.36 19.51 93.64 0.00 0.00 0.00 0.00 0.00 0.00 0.00 0.00 20.8323 Tripura 0.00 0.00 0.00 0.00 0.00 0.00 0.00 0.00 0.00 0.00 0.00 0.00 0.0024 Uttar Pradesh 6.25 72.61 2.36 27.39 0.00 0.00 0.00 0.00 0.00 0.00 0.00 0.00 8.6125 West Bengal 0.00 0.00 0.00 0.00 0.00 0.00 0.00 0.00 0.00 0.00 0.00 0.00 0.0026 ALL INDIA 13.81 7.41 146.35 78.57 2.19 1.18 0.00 0.00 23.91 12.84 0.00 0.00 186.26
Annexure – XXXXIVS.No. Name <strong>of</strong> state Quantity Percent tocol. 15Total Sale <strong>of</strong> Ragi – Agencywise – Medium Category Cultivators(Triennium end<strong>in</strong>g 1998-99) (<strong>in</strong> ‘000 tonnes)AgencyConsumers Traders Co-operatives F.C.I. Money lenders OthersQuantity Percent to Quantity Percent to Quantity Percent to Quantity Percent tocol. 15col. 15col. 15col. 15Quantity Percent tocol. 151 2 3 4 5 6 7 8 9 10 11 12 13 14 151 Andhra Pradesh 0.00 0.00 47.26 100.00 0.00 0.00 0.00 0.00 0.00 0.00 0.00 0.00 47.262 Arunachal Pradesh 0.00 0.00 0.00 0.00 0.00 0.00 0.00 0.00 0.00 0.00 0.00 0.00 0.003 Assam 0.00 0.00 0.00 0.00 0.00 0.00 0.00 0.00 0.00 0.00 0.00 0.00 0.004 Bihar 0.00 0.00 0.00 0.00 0.00 0.00 0.00 0.00 0.00 0.00 0.00 0.00 0.005 Goa 0.00 0.00 0.00 0.00 0.00 0.00 0.00 0.00 0.00 0.00 0.00 0.00 0.006 Gujarat 0.10 6.25 1.50 93.75 0.00 0.00 0.00 0.00 0.00 0.00 0.00 0.00 1.607 Haryana 0.00 0.00 0.00 0.00 0.00 0.00 0.00 0.00 0.00 0.00 0.00 0.00 0.008 Himachal Pradesh 0.00 0.00 0.00 0.00 0.00 0.00 0.00 0.00 0.00 0.00 0.00 0.00 0.009 Jammu <strong>and</strong> Kashmir 0.00 0.00 0.00 0.00 0.00 0.00 0.00 0.00 0.00 0.00 0.00 0.00 0.0010 Karnataka 1.18 0.89 93.59 70.44 19.86 14.95 0.00 0.00 18.24 13.73 0.00 0.00 132.8711 Kerala 0.00 0.00 0.00 0.00 0.00 0.00 0.00 0.00 0.00 0.00 0.00 0.00 0.0012 Madhya Pradesh 0.03 100.00 0.00 0.00 0.00 0.00 0.00 0.00 0.00 0.00 0.00 0.00 0.0313 Maharashtra 0.42 4.29 9.37 95.71 0.00 0.00 0.00 0.00 0.00 0.00 0.00 0.00 9.7914 Manipur 0.00 0.00 0.00 0.00 0.00 0.00 0.00 0.00 0.00 0.00 0.00 0.00 0.0015 Meghalaya 0.00 0.00 0.00 0.00 0.00 0.00 0.00 0.00 0.00 0.00 0.00 0.00 0.0016 Mizoram 0.00 0.00 0.00 0.00 0.00 0.00 0.00 0.00 0.00 0.00 0.00 0.00 0.0017 Nagal<strong>and</strong> 0.00 0.00 0.00 0.00 0.00 0.00 0.00 0.00 0.00 0.00 0.00 0.00 0.0018 Orissa 0.98 19.72 3.99 80.28 0.00 0.00 0.00 0.00 0.00 0.00 0.00 0.00 4.9719 Punjab 0.00 0.00 0.00 0.00 0.00 0.00 0.00 0.00 0.00 0.00 0.00 0.00 0.0020 Rajasthan 0.00 0.00 0.00 0.00 0.00 0.00 0.00 0.00 0.00 0.00 0.00 0.00 0.0021 Sikkim 0.00 0.00 0.00 0.00 0.00 0.00 0.00 0.00 0.00 0.00 0.00 0.00 0.0022 Tamil Nadu 0.00 0.00 20.43 100.00 0.00 0.00 0.00 0.00 0.00 0.00 0.00 0.00 20.4323 Tripura 0.00 0.00 0.00 0.00 0.00 0.00 0.00 0.00 0.00 0.00 0.00 0.00 0.0024 Uttar Pradesh 7.86 91.22 0.24 2.78 0.00 0.00 0.00 0.00 0.52 5.99 0.00 0.00 8.6225 West Bengal 0.00 0.00 0.00 0.00 0.00 0.00 0.00 0.00 0.00 0.00 0.00 0.00 0.0026 ALL INDIA 10.57 4.69 176.38 78.19 19.86 8.80 0.00 0.00 18.76 8.32 0.00 0.00 225.57Totalsales
Annexure – XXXXVS.No.Name <strong>of</strong> stateSale <strong>of</strong> Ragi – Agencywise – Large Category Cultivators(Triennium end<strong>in</strong>g 1998-99) (<strong>in</strong> ‘000 tonnes)Name <strong>of</strong> agencyConsumers Traders Co-operatives F.C.I. Money lenders Others TotalQuantity Percent to Quantity Percent to Quantity Percent to Quantity Percent to Quantity Percent to Quantity Percent to salescol. 15col. 15col. 15col. 15col. 15col. 151 2 3 4 5 6 7 8 9 10 11 12 13 14 151 Andhra Pradesh 0.00 0.00 26.38 100.00 0.00 0.00 0.00 0.00 0.00 0.00 0.00 0.00 26.382 Arunachal Pradesh 0.00 0.00 0.00 0.00 0.00 0.00 0.00 0.00 0.00 0.00 0.00 0.00 0.003 Assam 0.00 0.00 0.00 0.00 0.00 0.00 0.00 0.00 0.00 0.00 0.00 0.00 0.004 Bihar 0.00 0.00 0.00 0.00 0.00 0.00 0.00 0.00 0.00 0.00 0.00 0.00 0.005 Goa 0.00 0.00 0.00 0.00 0.00 0.00 0.00 0.00 0.00 0.00 0.00 0.00 0.006 Gujarat 0.00 0.00 0.35 100.00 0.00 0.00 0.00 0.00 0.00 0.00 0.00 0.00 0.357 Haryana 0.00 0.00 0.00 0.00 0.00 0.00 0.00 0.00 0.00 0.00 0.00 0.00 0.008 Himachal Pradesh 0.00 0.00 0.00 0.00 0.00 0.00 0.00 0.00 0.00 0.00 0.00 0.00 0.009 Jammu <strong>and</strong> Kashmir 0.00 0.00 0.00 0.00 0.00 0.00 0.00 0.00 0.00 0.00 0.00 0.00 0.0010 Karnataka 3.47 2.16 140.74 87.72 0.57 0.36 0.00 0.00 14.45 9.01 1.22 0.76 160.4511 Kerala 0.00 0.00 0.00 0.00 0.00 0.00 0.00 0.00 0.00 0.00 0.00 0.00 0.0012 Madhya Pradesh 0.00 0.00 0.47 100.00 0.00 0.00 0.00 0.00 0.00 0.00 0.00 0.00 0.4713 Maharashtra 0.90 8.18 10.10 91.82 0.00 0.00 0.00 0.00 0.00 0.00 0.00 0.00 11.0014 Manipur 0.00 0.00 0.00 0.00 0.00 0.00 0.00 0.00 0.00 0.00 0.00 0.00 0.0015 Meghalaya 0.00 0.00 0.00 0.00 0.00 0.00 0.00 0.00 0.00 0.00 0.00 0.00 0.0016 Mizoram 0.00 0.00 0.00 0.00 0.00 0.00 0.00 0.00 0.00 0.00 0.00 0.00 0.0017 Nagal<strong>and</strong> 0.00 0.00 0.00 0.00 0.00 0.00 0.00 0.00 0.00 0.00 0.00 0.00 0.0018 Orissa 1.73 35.16 3.19 64.84 0.00 0.00 0.00 0.00 0.00 0.00 0.00 0.00 4.9219 Punjab 0.00 0.00 0.00 0.00 0.00 0.00 0.00 0.00 0.00 0.00 0.00 0.00 0.0020 Rajasthan 0.00 0.00 0.00 0.00 0.00 0.00 0.00 0.00 0.00 0.00 0.00 0.00 0.0021 Sikkim 0.00 0.00 0.00 0.00 0.00 0.00 0.00 0.00 0.00 0.00 0.00 0.00 0.0022 Tamil Nadu 0.00 0.00 21.43 100.00 0.00 0.00 0.00 0.00 0.00 0.00 0.00 0.00 21.4323 Tripura 0.00 0.00 0.00 0.00 0.00 0.00 0.00 0.00 0.00 0.00 0.00 0.00 0.0024 Uttar Pradesh 4.72 28.61 10.90 66.06 0.00 0.00 0.00 0.00 0.88 5.33 0.00 0.00 16.5025 West Bengal 0.00 0.00 0.00 0.00 0.00 0.00 0.00 0.00 0.00 0.00 0.00 0.00 0.0026 ALL INDIA 10.82 4.48 213.56 88.43 0.57 0.24 0.00 0.00 15.33 6.35 1.22 0.50 241.50
Annexure – XXXXVISale <strong>of</strong> Ragi – Agencywise – All Category Cultivators(Triennium end<strong>in</strong>g 1998-99) (<strong>in</strong> ‘000 tonnes)S.No.Name <strong>of</strong> AgencyName <strong>of</strong> stateConsumers Traders Co-operatives F.C.I. Money lenders Others TotalQuantity Percent to Quantity Percent to Quantity Percent to Quantity Percent to Quantity Percent to Quantity Percent to salescol. 15col. 15col. 15col. 15col. 15col. 151 2 3 4 5 6 7 8 9 10 11 12 13 14 151 Andhra Pradesh 0.00 0.00 84.05 100.00 0.00 0.00 0.00 0.00 0.00 0.00 0.00 0.00 84.052 Arunachal Pradesh 0.00 0.00 0.00 0.00 0.00 0.00 0.00 0.00 0.00 0.00 0.00 0.00 0.003 Assam 0.00 0.00 0.00 0.00 0.00 0.00 0.00 0.00 0.00 0.00 0.00 0.00 0.004 Bihar 0.00 0.00 0.00 0.00 0.00 0.00 0.00 0.00 0.00 0.00 0.00 0.00 0.005 Goa 0.00 0.00 0.00 0.00 0.00 0.00 0.00 0.00 0.00 0.00 0.00 0.00 0.006 Gujarat 0.37 10.51 3.15 89.49 0.00 0.00 0.00 0.00 0.00 0.00 0.00 0.00 3.527 Haryana 0.00 0.00 0.00 0.00 0.00 0.00 0.00 0.00 0.00 0.00 0.00 0.00 0.008 Himachal Pradesh 0.00 0.00 0.00 0.00 0.00 0.00 0.00 0.00 0.00 0.00 0.00 0.00 0.009 Jammu <strong>and</strong> Kashmir 0.00 0.00 0.00 0.00 0.00 0.00 0.00 0.00 0.00 0.00 0.00 0.00 0.0010 Karnataka 10.49 2.46 335.12 78.66 22.62 5.31 0.00 0.00 56.60 13.28 1.22 0.29 426.0511 Kerala 0.00 0.00 0.00 0.00 0.00 0.00 0.00 0.00 0.00 0.00 0.00 0.00 0.0012 Madhya Pradesh 0.03 4.92 0.58 95.08 0.00 0.00 0.00 0.00 0.00 0.00 0.00 0.00 0.6113 Maharashtra 1.45 5.35 25.67 94.65 0.00 0.00 0.00 0.00 0.00 0.00 0.00 0.00 27.1214 Manipur 0.00 0.00 0.00 0.00 0.00 0.00 0.00 0.00 0.00 0.00 0.00 0.00 0.0015 Meghalaya 0.00 0.00 0.00 0.00 0.00 0.00 0.00 0.00 0.00 0.00 0.00 0.00 0.0016 Mizoram 0.00 0.00 0.00 0.00 0.00 0.00 0.00 0.00 0.00 0.00 0.00 0.00 0.0017 Nagal<strong>and</strong> 0.00 0.00 0.00 0.00 0.00 0.00 0.00 0.00 0.00 0.00 0.00 0.00 0.0018 Orissa 2.71 17.42 12.85 82.58 0.00 0.00 0.00 0.00 0.00 0.00 0.00 0.00 15.5619 Punjab 0.00 0.00 0.00 0.00 0.00 0.00 0.00 0.00 0.00 0.00 0.00 0.00 0.0020 Rajasthan 0.00 0.00 0.00 0.00 0.00 0.00 0.00 0.00 0.00 0.00 0.00 0.00 0.0021 Sikkim 0.00 0.00 0.00 0.00 0.00 0.00 0.00 0.00 0.00 0.00 0.00 0.00 0.0022 Tamil Nadu 1.32 2.11 61.37 97.89 0.00 0.00 0.00 0.00 0.00 0.00 0.00 0.00 62.6923 Tripura 0.00 0.00 0.00 0.00 0.00 0.00 0.00 0.00 0.00 0.00 0.00 0.00 0.0024 Uttar Pradesh 18.83 55.83 13.50 40.02 0.00 0.00 0.00 0.00 1.40 4.15 0.00 0.00 33.7325 West Bengal 0.00 0.00 0.00 0.00 0.00 0.00 0.00 0.00 0.00 0.00 0.00 0.00 0.0026 ALL INDIA 35.20 5.39 536.29 82.09 22.62 3.46 0.00 0.00 58.00 8.88 1.22 0.18 653.33
Annexure – XXXXVIISale <strong>of</strong> Ragi – With<strong>in</strong> Village – Small Category Cultivators(Triennium end<strong>in</strong>g 1998-99)(<strong>in</strong> ‘000 tonnes)Quarter Of SaleI II III IVS.No. Name <strong>of</strong> state Qty. % to Production <strong>of</strong>categoryQty. % to Production<strong>of</strong> categoryQty. % to Production <strong>of</strong>categoryQty. % to Production<strong>of</strong> category1 2 3 4 5 6 7 8 9 101 Andhra Pradesh 0.00 0.00 0.00 0.00 0.00 0.00 0.00 0.002 Arunachal Pradesh 0.00 0.00 0.00 0.00 0.00 0.00 0.00 0.003 Assam 0.00 0.00 0.00 0.00 0.00 0.00 0.00 0.004 Bihar 0.00 0.00 0.00 0.00 0.00 0.00 0.00 0.005 Goa 0.00 0.00 0.00 0.00 0.00 0.00 0.00 0.006 Gujarat 0.00 0.00 0.00 0.00 0.00 0.00 0.00 0.007 Haryana 0.00 0.00 0.00 0.00 0.00 0.00 0.00 0.008 Himachal Pradesh 0.00 0.00 0.00 0.00 0.00 0.00 0.00 0.009 Jammu <strong>and</strong> Kashmir 0.00 0.00 0.00 0.00 0.00 0.00 0.00 0.0010 Karnataka 0.00 0.00 21.78 4.36 56.59 11.33 0.00 0.0011 Kerala 0.00 0.00 0.00 0.00 0.00 0.00 0.00 0.0012 Madhya Pradesh 0.00 0.00 0.00 0.00 0.00 0.00 0.00 0.0013 Maharashtra 0.00 0.00 0.00 0.00 0.00 0.00 0.00 0.0014 Manipur 0.00 0.00 0.00 0.00 0.00 0.00 0.00 0.0015 Meghalaya 0.00 0.00 0.00 0.00 0.00 0.00 0.00 0.0016 Mizoram 0.00 0.00 0.00 0.00 0.00 0.00 0.00 0.0017 Nagal<strong>and</strong> 0.00 0.00 0.00 0.00 0.00 0.00 0.00 0.0018 Orissa 0.00 0.00 0.00 0.00 0.08 0.40 0.13 0.6519 Punjab 0.00 0.00 0.00 0.00 0.00 0.00 0.00 0.0020 Rajasthan 0.00 0.00 0.00 0.00 0.00 0.00 0.00 0.0021 Sikkim 0.00 0.00 0.00 0.00 0.00 0.00 0.00 0.0022 Tamil Nadu 0.00 0.00 1.63 1.39 6.43 5.48 4.11 3.5023 Tripura 0.00 0.00 0.00 0.00 0.00 0.00 0.00 0.0024 Uttar Pradesh 0.00 0.00 5.95 6.92 0.00 0.00 0.00 0.0025 West Bengal 0.00 0.00 0.00 0.00 0.00 0.00 0.00 0.0026 ALL INDIA 0.00 0.00 29.36 3.48 63.10 7.48 4.24 0.50
Annexure – XXXXVIIISale <strong>of</strong> Ragi – With<strong>in</strong> Village – Medium Category Cultivators(Triennium end<strong>in</strong>g 1998-99)(<strong>in</strong> ‘000 tonnes)Quarter Of SaleI II III IVS.No. Name <strong>of</strong> state Qty. % to Production<strong>of</strong> categoryQty. % to Production<strong>of</strong> categoryQty. % to Production <strong>of</strong>categoryQty. % to Production<strong>of</strong> category1 2 3 4 5 6 7 8 9 101 Andhra Pradesh 0.00 0.00 0.00 0.00 0.00 0.00 0.00 0.002 Arunachal Pradesh 0.00 0.00 0.00 0.00 0.00 0.00 0.00 0.003 Assam 0.00 0.00 0.00 0.00 0.00 0.00 0.00 0.004 Bihar 0.00 0.00 0.00 0.00 0.00 0.00 0.00 0.005 Goa 0.00 0.00 0.00 0.00 0.00 0.00 0.00 0.006 Gujarat 0.00 0.00 0.00 0.00 0.00 0.00 0.00 0.007 Haryana 0.00 0.00 0.00 0.00 0.00 0.00 0.00 0.008 Himachal Pradesh 0.00 0.00 0.00 0.00 0.00 0.00 0.00 0.009 Jammu <strong>and</strong> Kashmir 0.00 0.00 0.00 0.00 0.00 0.00 0.00 0.0010 Karnataka 0.00 0.00 21.78 5.90 56.60 15.32 0.00 0.0011 Kerala 0.00 0.00 0.00 0.00 0.00 0.00 0.00 0.0012 Madhya Pradesh 0.00 0.00 0.00 0.00 0.00 0.00 0.00 0.0013 Maharashtra 0.00 0.00 0.00 0.00 0.00 0.00 0.00 0.0014 Manipur 0.00 0.00 0.00 0.00 0.00 0.00 0.00 0.0015 Meghalaya 0.00 0.00 0.00 0.00 0.00 0.00 0.00 0.0016 Mizoram 0.00 0.00 0.00 0.00 0.00 0.00 0.00 0.0017 Nagal<strong>and</strong> 0.00 0.00 0.00 0.00 0.00 0.00 0.00 0.0018 Orissa 0.00 0.00 0.00 0.00 0.08 0.38 3.24 15.3319 Punjab 0.00 0.00 0.00 0.00 0.00 0.00 0.00 0.0020 Rajasthan 0.00 0.00 0.00 0.00 0.00 0.00 0.00 0.0021 Sikkim 0.00 0.00 0.00 0.00 0.00 0.00 0.00 0.0022 Tamil Nadu 0.00 0.00 1.63 1.82 4.28 4.79 4.11 4.6023 Tripura 0.00 0.00 0.00 0.00 0.00 0.00 0.00 0.0024 Uttar Pradesh 0.00 0.00 7.29 15.84 0.00 0.00 0.00 0.0025 West Bengal 0.00 0.00 0.00 0.00 0.00 0.00 0.00 0.0026 ALL INDIA 0.00 0.00 30.70 4.57 60.96 9.08 7.35 1.10
Annexure – XXXXIXSale <strong>of</strong> Ragi – With<strong>in</strong> Village – Large Category Cultivators(Triennium end<strong>in</strong>g 1998-99)(<strong>in</strong> ‘000 tonnes)Quarter Of SaleI II III IVS.No. Name <strong>of</strong> state Qty. % to Production <strong>of</strong>categoryQty. % to Production<strong>of</strong> categoryQty. % to Production <strong>of</strong>categoryQty. % to Production<strong>of</strong> category1 2 3 4 5 6 7 8 9 101 Andhra Pradesh 0.00 0.00 10.45 31.35 0.00 0.00 0.18 0.542 Arunachal Pradesh 0.00 0.00 0.00 0.00 0.00 0.00 0.00 0.003 Assam 0.00 0.00 0.00 0.00 0.00 0.00 0.00 0.004 Bihar 0.00 0.00 0.00 0.00 0.00 0.00 0.00 0.005 Goa 0.00 0.00 0.00 0.00 0.00 0.00 0.00 0.006 Gujarat 0.00 0.00 0.00 0.00 0.23 12.50 0.00 0.007 Haryana 0.00 0.00 0.00 0.00 0.00 0.00 0.00 0.008 Himachal Pradesh 0.00 0.00 0.00 0.00 0.00 0.00 0.00 0.009 Jammu <strong>and</strong> Kashmir 0.00 0.00 0.00 0.00 0.00 0.00 0.00 0.0010 Karnataka 0.00 0.00 56.14 12.55 72.63 16.24 0.19 0.0411 Kerala 0.00 0.00 0.00 0.00 0.00 0.00 0.00 0.0012 Madhya Pradesh 0.00 0.00 0.00 0.00 0.47 18.65 0.00 0.0013 Maharashtra 0.00 0.00 0.00 0.00 7.33 13.47 0.00 0.0014 Manipur 0.00 0.00 0.00 0.00 0.00 0.00 0.00 0.0015 Meghalaya 0.00 0.00 0.00 0.00 0.00 0.00 0.00 0.0016 Mizoram 0.00 0.00 0.00 0.00 0.00 0.00 0.00 0.0017 Nagal<strong>and</strong> 0.00 0.00 0.00 0.00 0.00 0.00 0.00 0.0018 Orissa 0.00 0.00 0.00 0.00 4.15 21.44 0.49 2.5319 Punjab 0.00 0.00 0.00 0.00 0.00 0.00 0.00 0.0020 Rajasthan 0.00 0.00 0.00 0.00 0.00 0.00 0.00 0.0021 Sikkim 0.00 0.00 0.00 0.00 0.00 0.00 0.00 0.0022 Tamil Nadu 0.00 0.00 4.27 4.61 4.19 4.53 5.83 6.3023 Tripura 0.00 0.00 0.00 0.00 0.00 0.00 0.00 0.0024 Uttar Pradesh 0.02 0.02 5.85 7.24 0.00 0.00 10.63 13.1525 West Bengal 0.00 0.00 0.00 0.00 0.00 0.00 0.00 0.0026 ALL INDIA 0.02 0.003 76.71 9.99 89.00 11.59 17.32 2.26
Annexure – LSale <strong>of</strong> Ragi – With<strong>in</strong> Village – All Category Cultivators(Triennium end<strong>in</strong>g 1998-99) (<strong>in</strong> ‘000 tonnes)Quarter <strong>of</strong> saleI II III IVS.No. Name <strong>of</strong> state Qty. % to Production <strong>of</strong>categoryQty. % to Production<strong>of</strong> categoryQty. % to Production <strong>of</strong>categoryQty. % to Production<strong>of</strong> category1 2 3 4 5 6 7 8 9 101 Andhra Pradesh 0.00 0.00 10.45 7.76 0.00 0.00 0.18 0.132 Arunachal Pradesh 0.00 0.00 0.00 0.00 0.00 0.00 0.00 0.003 Assam 0.00 0.00 0.00 0.00 0.00 0.00 0.00 0.004 Bihar 0.00 0.00 0.00 0.00 0.00 0.00 0.00 0.005 Goa 0.00 0.00 0.00 0.00 0.00 0.00 0.00 0.006 Gujarat 0.00 0.00 0.00 0.00 0.23 0.00 0.00 0.007 Haryana 0.00 0.00 0.00 0.00 0.00 0.00 0.00 0.008 Himachal Pradesh 0.00 0.00 0.00 0.00 0.00 0.00 0.00 0.009 Jammu <strong>and</strong> Kashmir 0.00 0.00 0.00 0.00 0.00 0.00 0.00 0.0010 Karnataka 0.00 0.00 99.70 7.58 185.82 14.12 0.19 0.0111 Kerala 0.00 0.00 0.00 0.00 0.00 0.00 0.00 0.0012 Madhya Pradesh 0.00 0.00 0.00 0.00 0.47 12.74 0.00 0.0013 Maharashtra 0.00 0.00 0.00 0.00 7.33 4.62 0.00 0.0014 Manipur 0.00 0.00 0.00 0.00 0.00 0.00 0.00 0.0015 Meghalaya 0.00 0.00 0.00 0.00 0.00 0.00 0.00 0.0016 Mizoram 0.00 0.00 0.00 0.00 0.00 0.00 0.00 0.0017 Nagal<strong>and</strong> 0.00 0.00 0.00 0.00 0.00 0.00 0.00 0.0018 Orissa 0.00 0.00 0.00 0.00 4.31 7.13 3.86 6.3919 Punjab 0.00 0.00 0.00 0.00 0.00 0.00 0.00 0.0020 Rajasthan 0.00 0.00 0.00 0.00 0.00 0.00 0.00 0.0021 Sikkim 0.00 0.00 0.00 0.00 0.00 0.00 0.00 0.0022 Tamil Nadu 0.00 0.00 7.53 2.52 14.90 4.98 14.05 4.6923 Tripura 0.00 0.00 0.00 0.00 0.00 0.00 0.00 0.0024 Uttar Pradesh 0.02 0.01 19.09 8.97 0.00 0.00 10.63 4.9925 West Bengal 0.00 0.00 0.00 0.00 0.00 0.00 0.00 0.0026 ALL INDIA 0.02 0.001 136.77 5.99 213.06 9.33 28.91 1.27
Annexure – LISale <strong>of</strong> Ragi – Outside Village – Small Category Cultivators(Triennium end<strong>in</strong>g 1998-99)(<strong>in</strong> ‘000 tonnes)Quarter <strong>of</strong> saleS.No. Name <strong>of</strong> stateI II III IVQty. % to Production<strong>of</strong> categoryQty. % to Production <strong>of</strong>categoryQty. % to Production <strong>of</strong>categoryQty. % to Production <strong>of</strong>category1 2 3 4 5 6 7 8 9 101 Andhra Pradesh 0.00 0.00 10.41 25.72 0.00 0.00 0.00 0.002 Arunachal Pradesh 0.00 0.00 0.00 0.00 0.00 0.00 0.00 0.003 Assam 0.00 0.00 0.00 0.00 0.00 0.00 0.00 0.004 Bihar 0.00 0.00 0.00 0.00 0.00 0.00 0.00 0.005 Goa 0.00 0.00 0.00 0.00 0.00 0.00 0.00 0.006 Gujarat 0.00 0.00 0.00 0.00 1.57 15.53 0.00 0.007 Haryana 0.00 0.00 0.00 0.00 0.00 0.00 0.00 0.008 Himachal Pradesh 0.00 0.00 0.00 0.00 0.00 0.00 0.00 0.009 Jammu <strong>and</strong> Kashmir 0.00 0.00 0.00 0.00 0.00 0.00 0.00 0.0010 Karnataka 0.00 0.00 11.56 2.32 42.29 8.47 0.51 0.1011 Kerala 0.00 0.00 0.00 0.00 0.00 0.00 0.00 0.0012 Madhya Pradesh 0.00 0.00 0.00 0.00 0.11 11.96 0.00 0.0013 Maharashtra 0.00 0.00 0.00 0.00 6.33 12.13 0.00 0.0014 Manipur 0.00 0.00 0.00 0.00 0.00 0.00 0.00 0.0015 Meghalaya 0.00 0.00 0.00 0.00 0.00 0.00 0.00 0.0016 Mizoram 0.00 0.00 0.00 0.00 0.00 0.00 0.00 0.0017 Nagal<strong>and</strong> 0.00 0.00 0.00 0.00 0.00 0.00 0.00 0.0018 Orissa 0.00 0.00 0.06 0.30 5.40 27.08 0.00 0.0019 Punjab 0.00 0.00 0.00 0.00 0.00 0.00 0.00 0.0020 Rajasthan 0.00 0.00 0.00 0.00 0.00 0.00 0.00 0.0021 Sikkim 0.00 0.00 0.00 0.00 0.00 0.00 0.00 0.0022 Tamil Nadu 0.00 0.00 3.59 3.06 3.09 2.63 1.98 1.6923 Tripura 0.00 0.00 0.00 0.00 0.00 0.00 0.00 0.0024 Uttar Pradesh 0.00 0.00 2.66 3.09 0.00 0.00 0.00 0.0025 West Bengal 0.00 0.00 0.00 0.00 0.00 0.00 0.00 0.0026 ALL INDIA 0.00 0.00 28.28 3.35 58.79 6.97 2.49 0.30
Annexure – LIISale <strong>of</strong> Ragi – Outside Village – Medium Category Cultivators(Triennium end<strong>in</strong>g 1998-99)(<strong>in</strong> ‘000 tonnes)Quarter <strong>of</strong> saleI II III IVS.No. Name <strong>of</strong> state Qty. % to Production<strong>of</strong> categoryQty. % to Production <strong>of</strong>categoryQty. % to Production <strong>of</strong>categoryQty. % to Production <strong>of</strong>category1 2 3 4 5 6 7 8 9 101 Andhra Pradesh 0.00 0.00 18.49 30.40 25.72 42.28 3.05 5.012 Arunachal Pradesh 0.00 0.00 0.00 0.00 0.00 0.00 0.00 0.003 Assam 0.00 0.00 0.00 0.00 0.00 0.00 0.00 0.004 Bihar 0.00 0.00 0.00 0.00 0.00 0.00 0.00 0.005 Goa 0.00 0.00 0.00 0.00 0.00 0.00 0.00 0.006 Gujarat 0.00 0.00 0.00 0.00 1.60 18.10 0.00 0.007 Haryana 0.00 0.00 0.00 0.00 0.00 0.00 0.00 0.008 Himachal Pradesh 0.00 0.00 0.00 0.00 0.00 0.00 0.00 0.009 Jammu <strong>and</strong> Kashmir 0.00 0.00 0.00 0.00 0.00 0.00 0.00 0.0010 Karnataka 0.00 0.00 11.98 3.24 41.93 11.35 0.58 0.1611 Kerala 0.00 0.00 0.00 0.00 0.00 0.00 0.00 0.0012 Madhya Pradesh 0.00 0.00 0.00 0.00 0.03 12.00 0.00 0.0013 Maharashtra 0.00 0.00 0.00 0.00 9.79 18.74 0.00 0.0014 Manipur 0.00 0.00 0.00 0.00 0.00 0.00 0.00 0.0015 Meghalaya 0.00 0.00 0.00 0.00 0.00 0.00 0.00 0.0016 Mizoram 0.00 0.00 0.00 0.00 0.00 0.00 0.00 0.0017 Nagal<strong>and</strong> 0.00 0.00 0.00 0.00 0.00 0.00 0.00 0.0018 Orissa 0.00 0.00 0.04 0.19 1.55 7.33 0.06 0.2819 Punjab 0.00 0.00 0.00 0.00 0.00 0.00 0.00 0.0020 Rajasthan 0.00 0.00 0.00 0.00 0.00 0.00 0.00 0.0021 Sikkim 0.00 0.00 0.00 0.00 0.00 0.00 0.00 0.0022 Tamil Nadu 0.00 0.00 3.11 3.48 1.07 1.20 6.22 6.9623 Tripura 0.00 0.00 0.00 0.00 0.00 0.00 0.00 0.0024 Uttar Pradesh 0.00 0.00 1.33 2.89 0.00 0.00 0.00 0.0025 West Bengal 0.00 0.00 0.00 0.00 0.00 0.00 0.00 0.0026 ALL INDIA 0.00 0.00 34.95 5.21 81.69 12.17 9.91 1.48
Annexure – LIIISale <strong>of</strong> Ragi – Outside Village – Large Category Cultivators(Triennium end<strong>in</strong>g 1998-99)(<strong>in</strong> ‘000 tonnes)Quarter <strong>of</strong> saleI II III IVS.No. Name <strong>of</strong> state Qty. % to Production <strong>of</strong>categoryQty. % to Production<strong>of</strong> categoryQty. % to Production <strong>of</strong>categoryQty. % to Production <strong>of</strong>category1 2 3 4 5 6 7 8 9 101 Andhra Pradesh 0.00 0.00 15.66 46.98 0.00 0.00 0.09 0.272 Arunachal Pradesh 0.00 0.00 0.00 0.00 0.00 0.00 0.00 0.003 Assam 0.00 0.00 0.00 0.00 0.00 0.00 0.00 0.004 Bihar 0.00 0.00 0.00 0.00 0.00 0.00 0.00 0.005 Goa 0.00 0.00 0.00 0.00 0.00 0.00 0.00 0.006 Gujarat 0.00 0.00 0.00 0.00 0.12 6.52 0.00 0.007 Haryana 0.00 0.00 0.00 0.00 0.00 0.00 0.00 0.008 Himachal Pradesh 0.00 0.00 0.00 0.00 0.00 0.00 0.00 0.009 Jammu <strong>and</strong> Kashmir 0.00 0.00 0.00 0.00 0.00 0.00 0.00 0.0010 Karnataka 0.00 0.00 9.28 2.07 22.11 4.94 0.10 0.0211 Kerala 0.00 0.00 0.00 0.00 0.00 0.00 0.00 0.0012 Madhya Pradesh 0.00 0.00 0.00 0.00 0.00 0.00 0.00 0.0013 Maharashtra 0.00 0.00 0.00 0.00 3.67 6.74 0.00 0.0014 Manipur 0.00 0.00 0.00 0.00 0.00 0.00 0.00 0.0015 Meghalaya 0.00 0.00 0.00 0.00 0.00 0.00 0.00 0.0016 Mizoram 0.00 0.00 0.00 0.00 0.00 0.00 0.00 0.0017 Nagal<strong>and</strong> 0.00 0.00 0.00 0.00 0.00 0.00 0.00 0.0018 Orissa 0.00 0.00 0.00 0.00 0.04 0.21 0.24 1.2419 Punjab 0.00 0.00 0.00 0.00 0.00 0.00 0.00 0.0020 Rajasthan 0.00 0.00 0.00 0.00 0.00 0.00 0.00 0.0021 Sikkim 0.00 0.00 0.00 0.00 0.00 0.00 0.00 0.0022 Tamil Nadu 0.00 0.00 2.13 2.30 2.10 2.27 2.92 3.1623 Tripura 0.00 0.00 0.00 0.00 0.00 0.00 0.00 0.0024 Uttar Pradesh 0.00 0.00 0.00 0.00 0.00 0.00 0.00 0.0025 West Bengal 0.00 0.00 0.00 0.00 0.00 0.00 0.00 0.0026 ALL INDIA 0.00 0.00 27.07 3.53 28.04 3.65 3.35 0.44
Annexure – LIVSale <strong>of</strong> Ragi – Outside Village – All Category Cultivators(Triennium end<strong>in</strong>g 1998-99) (<strong>in</strong> ‘000 tonnes)Quarter Of SaleS.No. Name <strong>of</strong> stateI II III IVQty. % to Production<strong>of</strong> categoryQty. % to Production<strong>of</strong> categoryQty. % to Production <strong>of</strong>categoryQty. % to Production <strong>of</strong>category1 2 3 4 5 6 7 8 9 101 Andhra Pradesh 0.00 0.00 44.56 33.10 25.72 19.10 3.14 2.332 Arunachal Pradesh 0.00 0.00 0.00 0.00 0.00 0.00 0.00 0.003 Assam 0.00 0.00 0.00 0.00 0.00 0.00 0.00 0.004 Bihar 0.00 0.00 0.00 0.00 0.00 0.00 0.00 0.005 Goa 0.00 0.00 0.00 0.00 0.00 0.00 0.00 0.006 Gujarat 0.00 0.00 0.00 0.00 3.29 15.82 0.00 0.007 Haryana 0.00 0.00 0.00 0.00 0.00 0.00 0.00 0.008 Himachal Pradesh 0.00 0.00 0.00 0.00 0.00 0.00 0.00 0.009 Jammu <strong>and</strong> Kashmir 0.00 0.00 0.00 0.00 0.00 0.00 0.00 0.0010 Karnataka 0.00 0.00 32.82 2.49 106.33 8.08 1.19 0.0911 Kerala 0.00 0.00 0.00 0.00 0.00 0.00 0.00 0.0012 Madhya Pradesh 0.00 0.00 0.00 0.00 0.14 3.79 0.00 0.0013 Maharashtra 0.00 0.00 0.00 0.00 19.79 12.46 0.00 0.0014 Manipur 0.00 0.00 0.00 0.00 0.00 0.00 0.00 0.0015 Meghalaya 0.00 0.00 0.00 0.00 0.00 0.00 0.00 0.0016 Mizoram 0.00 0.00 0.00 0.00 0.00 0.00 0.00 0.0017 Nagal<strong>and</strong> 0.00 0.00 0.00 0.00 0.00 0.00 0.00 0.0018 Orissa 0.00 0.00 0.10 0.17 6.99 11.57 0.30 0.5019 Punjab 0.00 0.00 0.00 0.00 0.00 0.00 0.00 0.0020 Rajasthan 0.00 0.00 0.00 0.00 0.00 0.00 0.00 0.0021 Sikkim 0.00 0.00 0.00 0.00 0.00 0.00 0.00 0.0022 Tamil Nadu 0.00 0.00 8.83 2.95 6.26 2.09 11.12 3.7123 Tripura 0.00 0.00 0.00 0.00 0.00 0.00 0.00 0.0024 Uttar Pradesh 0.00 0.00 3.99 1.87 0.00 0.00 0.00 0.0025 West Bengal 0.00 0.00 0.00 0.00 0.00 0.00 0.00 0.0026 ALL INDIA 0.00 0.00 90.30 3.96 168.52 7.38 15.75 0.69
Annexure – LVS.No. Name <strong>of</strong> state TotalproductionMarketable Surplus – Small Category Cultivators(Triennium end<strong>in</strong>g 1998-99) (<strong>in</strong>‘000 tonnes)Type Of RetentionFamily Permanent Temporary Seed Feed K<strong>in</strong>d payment (PL)labours(PL) laboursQty. % Qty. % Qty. % Qty. % Qty. % Qty. %1 2 3 4 5 6 7 8 9 10 11 12 13 141 Andhra Pradesh 40.48 26.47 65.40 0.00 0.00 0.00 0.00 0.08 0.20 0.00 0.00 0.00 0.002 Arunachal Pradesh 0.00 0.00 0.00 0.00 0.00 0.00 0.00 0.00 0.00 0.00 0.00 0.00 0.003 Assam 0.00 0.00 0.00 0.00 0.00 0.00 0.00 0.00 0.00 0.00 0.00 0.00 0.004 Bihar 15.29 13.18 86.17 0.00 0.00 0.62 4.05 0.24 1.57 0.00 0.00 0.00 0.005 Goa 0.00 0.00 0.00 0.00 0.00 0.00 0.00 0.00 0.00 0.00 0.00 0.00 0.006 Gujarat 10.11 7.89 78.04 0.00 0.00 0.11 1.09 0.04 0.40 0.00 0.00 0.00 0.007 Haryana 0.00 0.00 0.00 0.00 0.00 0.00 0.00 0.00 0.00 0.00 0.00 0.00 0.008 Himachal Pradesh 2.47 2.19 88.48 0.00 0.00 0.06 2.43 0.03 1.21 0.00 0.00 0.00 0.009 Jammu <strong>and</strong> Kashmir 0.00 0.00 0.00 0.00 0.00 0.00 0.00 0.00 0.00 0.00 0.00 0.00 0.0010 Karnataka 499.29 303.40 60.77 0.00 0.00 22.08 4.42 11.93 2.39 0.00 0.00 0.00 0.0011 Kerala 0.00 0.00 0.00 0.00 0.00 0.00 0.00 0.00 0.00 0.00 0.00 0.00 0.0012 Madhya Pradesh 0.92 0.69 74.47 0.00 0.00 0.01 1.09 0.00 0.00 0.00 0.00 0.00 0.0013 Maharashtra 52.17 43.01 82.45 0.00 0.00 0.00 0.00 0.11 0.21 0.00 0.00 0.00 0.0014 Manipur 0.00 0.00 0.00 0.00 0.00 0.00 0.00 0.00 0.00 0.00 0.00 0.00 0.0015 Meghalaya 0.00 0.00 0.00 0.00 0.00 0.00 0.00 0.00 0.00 0.00 0.00 0.00 0.0016 Mizoram 0.00 0.00 0.00 0.00 0.00 0.00 0.00 0.00 0.00 0.00 0.00 0.00 0.0017 Nagal<strong>and</strong> 0.00 0.00 0.00 0.00 0.00 0.00 0.00 0.00 0.00 0.00 0.00 0.00 0.0018 Orissa 19.94 11.22 56.25 0.00 0.00 0.27 1.35 1.02 5.12 0.00 0.00 0.00 0.0019 Punjab 0.00 0.00 0.00 0.00 0.00 0.00 0.00 0.00 0.00 0.00 0.00 0.00 0.0020 Rajasthan 0.00 0.00 0.00 0.00 0.00 0.00 0.00 0.00 0.00 0.00 0.00 0.00 0.0021 Sikkim 0.00 0.00 60.81 0.00 0.00 0.00 0.00 0.00 0.00 0.00 0.00 0.00 0.0022 Tamil Nadu 117.38 77.54 66.06 0.00 0.00 0.00 0.00 3.14 2.68 0.00 0.00 0.00 0.0023 Tripura 0.00 0.00 0.00 0.00 0.00 0.00 0.00 0.00 0.00 0.00 0.00 0.00 0.0024 Uttar Pradesh 85.96 63.11 73.42 0.00 0.00 0.00 0.00 1.80 2.09 0.13 0.15 0.00 0.0025 West Bengal 0.00 0.00 0.00 0.00 0.00 0.00 0.00 0.00 0.00 0.00 0.00 0.00 0.0026 ALL INDIA 844.01 548.70 65.01 0.00 0.00 23.15 2.74 18.39 2.18 0.13 0.01 0.00 0.00Cont-2
--2--S.No.Name <strong>of</strong> stateType <strong>of</strong> retentionK<strong>in</strong>d payment(others)BarterTotal retention Total purchases.Total <strong>losses</strong>Farm familyrequirementMarketable<strong>surplus</strong>Qty. % Qty. % Qty. % Qty. % Qty. % Qty. % Qty. %1 2 16 17 18 19 20 21 22 23 24 25 26 27 28 291 Andhra Pradesh 1.09 2.69 0.00 0.00 27.64 68.28 0.00 0.00 2.27 5.61 29.91 73.89 10.57 26.112 Arunachal Pradesh 0.00 0.00 0.00 0.00 0.00 0.00 0.00 0.00 0.00 0.00 0.00 0.00 0.00 0.003 Assam 0.00 0.00 0.00 0.00 0.00 0.00 0.00 0.00 0.00 0.00 0.00 0.00 0.00 0.004 Bihar 0.14 0.92 0.00 0.00 14.18 92.74 0.00 0.00 0.93 6.08 15.11 98.82 0.18 1.185 Goa 0.00 0.00 0.00 0.00 0.00 0.00 0.00 0.00 0.00 0.00 0.00 0.00 0.00 0.006 Gujarat 0.00 0.00 0.00 0.00 8.04 79.53 0.00 0.00 0.41 4.06 8.45 83.58 1.66 16.427 Haryana 0.00 0.00 0.00 0.00 0.00 0.00 0.00 0.00 0.00 0.00 0.00 0.00 0.00 0.008 Himachal Pradesh 0.06 2.36 0.00 0.00 2.34 94.74 0.00 0.00 0.00 0.00 2.34 94.74 0.13 5.269 Jammu <strong>and</strong> Kashmir 0.00 0.00 0.00 0.00 0.00 0.00 0.00 0.00 0.00 0.00 0.00 0.00 0.00 0.0010 Karnataka 8.46 1.69 0.00 0.00 346.32 69.36 0.00 0.00 17.77 3.56 363.64 72.83 135.65 27.1711 Kerala 0.00 0.00 0.00 0.00 0.00 0.00 0.00 0.00 0.00 0.00 0.00 0.00 0.00 0.0012 Madhya Pradesh 0.00 0.00 0.00 0.00 0.70 76.09 0.00 0.00 0.10 10.87 0.80 86.96 0.12 13.0413 Maharashtra 0.00 0.00 0.00 0.00 43.12 82.65 0.00 0.00 2.22 4.26 45.34 86.91 6.83 13.0914 Manipur 0.00 0.00 0.00 0.00 0.00 0.00 0.00 0.00 0.00 0.00 0.00 0.00 0.00 0.0015 Meghalaya 0.00 0.00 0.00 0.00 0.00 0.00 0.00 0.00 0.00 0.00 0.00 0.00 0.00 0.0016 Mizoram 0.00 0.00 0.00 0.00 0.00 0.00 0.00 0.00 0.00 0.00 0.00 0.00 0.00 0.0017 Nagal<strong>and</strong> 0.00 0.00 0.00 0.00 0.00 0.00 0.00 0.00 0.00 0.00 0.00 0.00 0.00 0.0018 Orissa 0.56 2.81 0.00 0.00 13.07 65.55 0.00 0.00 1.15 5.77 14.22 71.31 5.72 28.6919 Punjab 0.00 0.00 0.00 0.00 0.00 0.00 0.00 0.00 0.00 0.00 0.00 0.00 0.00 0.0020 Rajasthan 0.00 0.00 0.00 0.00 0.00 0.00 0.00 0.00 0.00 0.00 0.00 0.00 0.00 0.0021 Sikkim 0.00 0.00 0.00 0.00 0.00 0.00 0.00 0.00 0.00 0.00 0.00 0.00 0.00 0.0022 Tamil Nadu 10.52 8.96 0.00 0.00 91.20 77.70 0.00 0.00 4.67 3.98 95.87 81.67 21.51 18.3323 Tripura 0.00 0.00 0.00 0.00 0.00 0.00 0.00 0.00 0.00 0.00 0.00 0.00 0.00 0.0024 Uttar Pradesh 4.76 5.54 0.00 0.00 69.80 81.20 0.00 0.00 3.11 3.62 72.91 84.82 13.05 15.1825 West Bengal 0.00 0.00 0.00 0.00 0.00 0.00 0.00 0.00 0.00 0.00 0.00 0.00 0.00 0.0026 ALL INDIA 25.59 3.03 0.00 0.00 615.96 72.98 0.00 0.00 32.63 3.87 648.59 76.85 195.42 23.15
Marketable Surplus – Medium Category Cultivators Annexure – LVI(Triennium end<strong>in</strong>g 1998-99) (<strong>in</strong> ‘000 tonnes)Type <strong>of</strong> retentionS.No.Total production Family Permanent Temporary Seed Feed K<strong>in</strong>d paymentName <strong>of</strong> statelabours(PL) labours(PL)Qty. % Qty. % Qty. % Qty. % Qty. % Qty. %1 2 3 4 5 6 7 8 9 10 11 12 13 14 151 Andhra Pradesh 60.83 9.50 15.62 0.00 0.00 0.00 0.00 0.07 0.12 0.00 0.00 0.00 0.002 Arunachal Pradesh 0.00 0.00 0.00 0.00 0.00 0.00 0.00 0.00 0.00 0.00 0.00 0.00 0.003 Assam 0.00 0.00 0.00 0.00 0.00 0.00 0.00 0.00 0.00 0.00 0.00 0.00 0.004 Bihar 20.69 16.76 80.99 0.00 0.00 1.15 5.56 0.68 3.29 0.00 0.00 0.00 0.005 Goa 0.00 0.00 0.00 0.00 0.00 0.00 0.00 0.00 0.00 0.00 0.00 0.00 0.006 Gujarat 8.84 6.64 75.14 0.00 0.00 0.13 1.47 0.01 0.11 0.00 0.00 0.00 0.007 Haryana 0.00 0.00 0.00 0.00 0.00 0.00 0.00 0.00 0.00 0.00 0.00 0.00 0.008 Himachal Pradesh 2.37 2.07 87.45 0.00 0.00 0.06 2.53 0.00 0.00 0.00 0.00 0.00 0.009 Jammu <strong>and</strong> Kashmir 0.00 0.00 0.00 0.00 0.00 0.00 0.00 0.00 0.00 0.00 0.00 0.00 0.0010 Karnataka 369.38 176.40 47.76 0.00 0.00 22.61 6.12 9.33 2.53 0.31 0.08 0.00 0.0011 Kerala 0.00 0.00 0.00 0.00 0.00 0.00 0.00 0.00 0.00 0.00 0.00 0.00 0.0012 Madhya Pradesh 0.25 0.18 72.07 0.00 0.00 0.00 0.00 0.02 8.00 0.00 0.00 0.00 0.0013 Maharashtra 52.23 40.42 77.38 0.00 0.00 0.00 0.00 0.17 0.33 0.00 0.00 0.00 0.0014 Manipur 0.00 0.00 0.00 0.00 0.00 0.00 0.00 0.00 0.00 0.00 0.00 0.00 0.0015 Meghalaya 0.00 0.00 0.00 0.00 0.00 0.00 0.00 0.00 0.00 0.00 0.00 0.00 0.0016 Mizoram 0.00 0.00 0.00 0.00 0.00 0.00 0.00 0.00 0.00 0.00 0.00 0.00 0.0017 Nagal<strong>and</strong> 0.00 0.00 0.00 0.00 0.00 0.00 0.00 0.00 0.00 0.00 0.00 0.00 0.0018 Orissa 21.14 13.07 61.81 0.00 0.00 0.33 1.56 1.00 4.73 0.04 0.18 0.00 0.0019 Punjab 0.00 0.00 0.00 0.00 0.00 0.00 0.00 0.00 0.00 0.00 0.00 0.00 0.0020 Rajasthan 0.00 0.00 0.00 0.00 0.00 0.00 0.00 0.00 0.00 0.00 0.00 0.00 0.0021 Sikkim 0.00 0.00 46.81 0.00 0.00 0.00 0.00 0.00 0.00 0.00 0.00 0.00 0.0022 Tamil Nadu 89.40 56.21 62.87 0.00 0.00 0.00 0.00 1.69 1.89 0.00 0.00 0.00 0.0023 Tripura 0.00 0.00 0.00 0.00 0.00 0.00 0.00 0.00 0.00 0.00 0.00 0.00 0.0024 Uttar Pradesh 46.01 27.07 58.84 0.00 0.00 1.75 3.80 1.37 2.98 0.07 0.16 0.00 0.0025 West Bengal 0.00 0.00 0.00 0.00 0.00 0.00 0.00 0.00 0.00 0.00 0.00 0.00 0.0026 ALL INDIA 671.14 348.32 51.90 0.00 0.00 26.03 3.88 14.34 2.14 0.42 0.06 0.00 0.00--2--Cont-2
S.No.Type <strong>of</strong> retentionTotal retention Total purchases. Total <strong>losses</strong> Farm familyrequirementMarketable<strong>surplus</strong>Name <strong>of</strong> stateK<strong>in</strong>d payment Barter(others)Qty. % Qty. % Qty. % Qty. % Qty. % Qty. % Qty. %1 2 16 17 18 19 20 21 22 23 24 25 26 27 28 291 Andhra Pradesh 1.54 2.53 0.00 0.00 11.11 18.26 0.00 0.00 2.08 3.42 13.19 21.68 47.64 78.322 Arunachal Pradesh 0.00 0.00 0.00 0.00 0.00 0.00 0.00 0.00 0.00 0.00 0.00 0.00 0.00 0.003 Assam 0.00 0.00 0.00 0.00 0.00 0.00 0.00 0.00 0.00 0.00 0.00 0.00 0.00 0.004 Bihar 0.70 3.38 0.00 0.00 19.29 93.23 0.00 0.00 1.29 6.23 20.58 99.47 0.11 0.535 Goa 0.00 0.00 0.00 0.00 0.00 0.00 0.00 0.00 0.00 0.00 0.00 0.00 0.00 0.006 Gujarat 0.00 0.00 0.00 0.00 6.78 76.70 0.00 0.00 0.37 4.19 7.15 80.88 1.69 19.127 Haryana 0.00 0.00 0.00 0.00 0.00 0.00 0.00 0.00 0.00 0.00 0.00 0.00 0.00 0.008 Himachal Pradesh 0.09 3.80 0.00 0.00 2.22 93.67 0.00 0.00 0.12 5.06 2.34 98.73 0.03 1.279 Jammu <strong>and</strong> Kashmir 0.00 0.00 0.00 0.00 0.00 0.00 0.00 0.00 0.00 0.00 0.00 0.00 0.00 0.0010 Karnataka 9.56 2.59 0.00 0.00 218.21 59.07 0.00 0.00 15.96 4.32 234.17 63.40 135.21 36.6011 Kerala 0.00 0.00 0.00 0.00 0.00 0.00 0.00 0.00 0.00 0.00 0.00 0.00 0.00 0.0012 Madhya Pradesh 0.00 0.00 0.00 0.00 0.20 80.00 0.00 0.00 0.02 8.00 0.22 88.00 0.03 12.0013 Maharashtra 0.00 0.00 0.00 0.00 40.59 77.71 0.00 0.00 1.59 3.04 42.18 80.76 10.05 19.2414 Manipur 0.00 0.00 0.00 0.00 0.00 0.00 0.00 0.00 0.00 0.00 0.00 0.00 0.00 0.0015 Meghalaya 0.00 0.00 0.00 0.00 0.00 0.00 0.00 0.00 0.00 0.00 0.00 0.00 0.00 0.0016 Mizoram 0.00 0.00 0.00 0.00 0.00 0.00 0.00 0.00 0.00 0.00 0.00 0.00 0.00 0.0017 Nagal<strong>and</strong> 0.00 0.00 0.00 0.00 0.00 0.00 0.00 0.00 0.00 0.00 0.00 0.00 0.00 0.0018 Orissa 0.52 2.46 0.00 0.00 14.96 70.77 0.00 0.00 1.11 5.25 16.07 76.02 5.07 23.9819 Punjab 0.00 0.00 0.00 0.00 0.00 0.00 0.00 0.00 0.00 0.00 0.00 0.00 0.00 0.0020 Rajasthan 0.00 0.00 0.00 0.00 0.00 0.00 0.00 0.00 0.00 0.00 0.00 0.00 0.00 0.0021 Sikkim 0.00 0.00 0.00 0.00 0.00 0.00 0.00 0.00 0.00 0.00 0.00 0.00 0.00 0.0022 Tamil Nadu 8.81 9.85 0.00 0.00 66.71 74.62 0.00 0.00 1.95 2.18 68.66 76.80 20.74 23.2023 Tripura 0.00 0.00 0.00 0.00 0.00 0.00 0.00 0.00 0.00 0.00 0.00 0.00 0.00 0.0024 Uttar Pradesh 4.22 9.17 0.00 0.00 34.48 74.94 0.00 0.00 2.70 5.87 37.18 80.81 8.83 19.1925 West Bengal 0.00 0.00 0.00 0.00 0.00 0.00 0.00 0.00 0.00 0.00 0.00 0.00 0.00 0.0026 ALL INDIA 25.44 3.79 0.00 0.00 414.55 61.77 0.00 0.00 27.19 4.05 441.74 65.82 229.40 34.18
S.No.TotalproductionMarketable Surplus – Large Category Cultivators Annexure – LVII(Triennium end<strong>in</strong>g 1998-99) (<strong>in</strong> ‘000 tonnes)Type <strong>of</strong> retentionTemporary labours Seed Feed K<strong>in</strong>d payment (PL)Name <strong>of</strong> stateFamily Permanentlabours(PL)Qty. % Qty. % Qty. % Qty. % Qty. % Qty. %1 2 3 4 5 6 7 8 9 10 11 12 13 141 Andhra Pradesh 33.33 4.60 13.79 0.00 0.00 0.00 0.00 0.05 0.15 0.00 0.00 0.00 0.002 Arunachal Pradesh 0.00 0.00 0.00 0.00 0.00 0.00 0.00 0.00 0.00 0.00 0.00 0.00 0.003 Assam 0.00 0.00 0.00 0.00 0.00 0.00 0.00 0.00 0.00 0.00 0.00 0.00 0.004 Bihar 33.90 27.40 80.84 0.00 0.00 1.63 4.81 1.43 4.22 0.00 0.00 0.00 0.005 Goa 0.00 0.00 0.00 0.00 0.00 0.00 0.00 0.00 0.00 0.00 0.00 0.00 0.006 Gujarat 1.84 1.36 74.01 0.00 0.00 0.02 1.09 0.00 0.00 0.00 0.00 0.00 0.007 Haryana 0.00 0.00 0.00 0.00 0.00 0.00 0.00 0.00 0.00 0.00 0.00 0.00 0.008 Himachal Pradesh 1.62 1.39 85.88 0.00 0.00 0.05 3.09 0.02 1.23 0.00 0.00 0.00 0.009 Jammu <strong>and</strong> Kashmir 0.00 0.00 0.00 0.00 0.00 0.00 0.00 0.00 0.00 0.00 0.00 0.00 0.0010 Karnataka 447.30 210.59 47.08 0.45 0.10 27.64 6.18 14.90 3.33 0.49 0.11 0.00 0.0011 Kerala 0.00 0.00 0.00 0.00 0.00 0.00 0.00 0.00 0.00 0.00 0.00 0.00 0.0012 Madhya Pradesh 2.52 1.75 69.55 0.00 0.00 0.00 0.00 0.19 7.54 0.00 0.00 0.00 0.0013 Maharashtra 54.42 40.75 74.88 0.00 0.00 0.00 0.00 0.66 1.21 0.00 0.00 0.00 0.0014 Manipur 0.00 0.00 0.00 0.00 0.00 0.00 0.00 0.00 0.00 0.00 0.00 0.00 0.0015 Meghalaya 0.00 0.00 0.00 0.00 0.00 0.00 0.00 0.00 0.00 0.00 0.00 0.00 0.0016 Mizoram 0.00 0.00 0.00 0.00 0.00 0.00 0.00 0.00 0.00 0.00 0.00 0.00 0.0017 Nagal<strong>and</strong> 0.00 0.00 0.00 0.00 0.00 0.00 0.00 0.00 0.00 0.00 0.00 0.00 0.0018 Orissa 19.36 11.60 59.94 0.00 0.00 0.00 0.00 1.02 5.27 0.16 0.84 0.00 0.0019 Punjab 0.00 0.00 0.00 0.00 0.00 0.00 0.00 0.00 0.00 0.00 0.00 0.00 0.0020 Rajasthan 0.00 0.00 0.00 0.00 0.00 0.00 0.00 0.00 0.00 0.00 0.00 0.00 0.0021 Sikkim 0.00 0.00 0.00 0.00 0.00 0.00 0.00 0.00 0.00 0.00 0.00 0.00 0.0022 Tamil Nadu 92.55 57.48 62.11 0.00 0.00 0.00 0.00 1.95 2.11 0.00 0.00 0.00 0.0023 Tripura 0.00 0.00 0.00 0.00 0.00 0.00 0.00 0.00 0.00 0.00 0.00 0.00 0.0024 Uttar Pradesh 80.85 48.29 59.73 0.00 0.00 3.37 4.17 3.82 4.72 0.12 0.15 0.00 0.0025 West Bengal 0.00 0.00 0.00 0.00 0.00 0.00 0.00 0.00 0.00 0.00 0.00 0.00 0.0026 ALL INDIA 767.69 405.21 52.78 0.45 0.06 32.71 4.26 24.04 3.13 0.77 0.10 0.00 0.00Cont-2
S.No.Name <strong>of</strong> stateType <strong>of</strong> retention--2--Total retention Total purchases. Total <strong>losses</strong> Farm familyrequirementMarketable<strong>surplus</strong>K<strong>in</strong>d payment Barter(others)Qty. % Qty. % Qty. % Qty. % Qty. % Qty. % Qty. %1 2 16 17 18 19 20 21 22 23 24 25 26 27 28 291 Andhra Pradesh 1.34 4.02 0.00 0.00 5.99 17.97 0.00 0.00 0.80 2.40 6.79 20.37 26.54 79.632 Arunachal Pradesh 0.00 0.00 0.00 0.00 0.00 0.00 0.00 0.00 0.00 0.00 0.00 0.00 0.00 0.003 Assam 0.00 0.00 0.00 0.00 0.00 0.00 0.00 0.00 0.00 0.00 0.00 0.00 0.00 0.004 Bihar 1.43 4.22 0.00 0.00 31.89 94.07 0.00 0.00 1.84 5.43 33.73 99.50 0.17 0.505 Goa 0.00 0.00 0.00 0.00 0.00 0.00 0.00 0.00 0.00 0.00 0.00 0.00 0.00 0.006 Gujarat 0.00 0.00 0.00 0.00 1.38 75.00 0.00 0.00 0.09 4.89 1.47 79.89 0.37 20.117 Haryana 0.00 0.00 0.00 0.00 0.00 0.00 0.00 0.00 0.00 0.00 0.00 0.00 0.00 0.008 Himachal Pradesh 0.06 3.70 0.00 0.00 1.52 93.83 0.00 0.00 0.08 4.94 1.60 98.77 0.02 1.239 Jammu <strong>and</strong> Kashmir 0.00 0.00 0.00 0.00 0.00 0.00 0.00 0.00 0.00 0.00 0.00 0.00 0.00 0.0010 Karnataka 13.95 3.12 0.00 0.00 268.02 59.92 0.00 0.00 16.64 3.72 284.66 63.64 162.64 36.3611 Kerala 0.00 0.00 0.00 0.00 0.00 0.00 0.00 0.00 0.00 0.00 0.00 0.00 0.00 0.0012 Madhya Pradesh 0.00 0.00 0.00 0.00 1.94 76.98 0.00 0.00 0.11 4.37 2.05 81.35 0.47 18.6513 Maharashtra 0.00 0.00 0.00 0.00 41.41 76.09 0.00 0.00 1.86 3.42 43.27 79.51 11.15 20.4914 Manipur 0.00 0.00 0.00 0.00 0.00 0.00 0.00 0.00 0.00 0.00 0.00 0.00 0.00 0.0015 Meghalaya 0.00 0.00 0.00 0.00 0.00 0.00 0.00 0.00 0.00 0.00 0.00 0.00 0.00 0.0016 Mizoram 0.00 0.00 0.00 0.00 0.00 0.00 0.00 0.00 0.00 0.00 0.00 0.00 0.00 0.0017 Nagal<strong>and</strong> 0.00 0.00 0.00 0.00 0.00 0.00 0.00 0.00 0.00 0.00 0.00 0.00 0.00 0.0018 Orissa 0.66 3.41 0.00 0.00 13.44 69.42 0.00 0.00 0.90 4.65 14.34 74.07 5.02 25.9319 Punjab 0.00 0.00 0.00 0.00 0.00 0.00 0.00 0.00 0.00 0.00 0.00 0.00 0.00 0.0020 Rajasthan 0.00 0.00 0.00 0.00 0.00 0.00 0.00 0.00 0.00 0.00 0.00 0.00 0.00 0.0021 Sikkim 0.00 0.00 0.00 0.00 0.00 0.00 0.00 0.00 0.00 0.00 0.00 0.00 0.00 0.0022 Tamil Nadu 8.09 8.74 0.00 0.00 67.52 72.96 0.00 0.00 3.05 3.30 70.57 76.25 21.98 23.7523 Tripura 0.00 0.00 0.00 0.00 0.00 0.00 0.00 0.00 0.00 0.00 0.00 0.00 0.00 0.0024 Uttar Pradesh 6.58 8.14 0.00 0.00 62.18 76.91 0.00 0.00 1.71 2.12 63.89 79.02 16.96 20.9825 West Bengal 0.00 0.00 0.00 0.00 0.00 0.00 0.00 0.00 0.00 0.00 0.00 0.00 0.00 0.0026 ALL INDIA 32.11 4.18 0.00 0.00 495.29 64.52 0.00 0.00 27.08 3.53 522.37 68.04 245.32 31.96
Annexure – LVIIIMarketable Surplus – All Category Cultivators(Triennium end<strong>in</strong>g 1998-99) (<strong>in</strong> ‘000 tonnes)Type <strong>of</strong> retentionS.No.Total production Family Permanent labours(PL) Temporary labours Seed Feed K<strong>in</strong>d payment (PL)Name <strong>of</strong> stateQty. % Qty. % Qty. % Qty. % Qty. % Qty. %1 2 3 4 5 6 7 8 9 10 11 12 13 141 Andhra Pradesh 134.64 40.57 30.13 0.00 0.00 0.00 0.00 0.20 0.15 0.00 0.00 0.00 0.002 Arunachal Pradesh 0.00 0.00 0.00 0.00 0.00 0.00 0.00 0.00 0.00 0.00 0.00 0.00 0.003 Assam 0.00 0.00 0.00 0.00 0.00 0.00 0.00 0.00 0.00 0.00 0.00 0.00 0.004 Bihar 69.88 57.34 82.05 0.00 0.00 3.40 4.87 2.35 3.36 0.00 0.00 0.00 0.005 Goa 0.00 0.00 0.00 0.00 0.00 0.00 0.00 0.00 0.00 0.00 0.00 0.00 0.006 Gujarat 20.79 15.89 76.43 0.00 0.00 0.26 1.25 0.05 0.24 0.00 0.00 0.00 0.007 Haryana 0.00 0.00 0.00 0.00 0.00 0.00 0.00 0.00 0.00 0.00 0.00 0.00 0.008 Himachal Pradesh 6.46 5.65 87.46 0.00 0.00 0.17 2.63 0.05 0.77 0.00 0.00 0.00 0.009 Jammu <strong>and</strong> Kashmir 0.00 0.00 0.00 0.00 0.00 0.00 0.00 0.00 0.00 0.00 0.00 0.00 0.0010 Karnataka 1315.97 690.39 52.46 0.45 0.03 72.33 5.50 36.16 2.75 0.80 0.06 0.00 0.0011 Kerala 0.00 0.00 0.00 0.00 0.00 0.00 0.00 0.00 0.00 0.00 0.00 0.00 0.0012 Madhya Pradesh 3.69 2.62 71.00 0.00 0.00 0.01 0.27 0.21 5.69 0.00 0.00 0.00 0.0013 Maharashtra 158.82 124.18 78.19 0.00 0.00 0.00 0.00 0.94 0.59 0.00 0.00 0.00 0.0014 Manipur 0.00 0.00 0.00 0.00 0.00 0.00 0.00 0.00 0.00 0.00 0.00 0.00 0.0015 Meghalaya 0.00 0.00 0.00 0.00 0.00 0.00 0.00 0.00 0.00 0.00 0.00 0.00 0.0016 Mizoram 0.00 0.00 0.00 0.00 0.00 0.00 0.00 0.00 0.00 0.00 0.00 0.00 0.0017 Nagal<strong>and</strong> 0.00 0.00 0.00 0.00 0.00 0.00 0.00 0.00 0.00 0.00 0.00 0.00 0.0018 Orissa 60.44 35.89 59.38 0.00 0.00 0.60 0.99 3.04 5.03 0.20 0.33 0.00 0.0019 Punjab 0.00 0.00 0.00 0.00 0.00 0.00 0.00 0.00 0.00 0.00 0.00 0.00 0.0020 Rajasthan 0.00 0.00 0.00 0.00 0.00 0.00 0.00 0.00 0.00 0.00 0.00 0.00 0.0021 Sikkim 0.00 0.00 0.00 0.00 0.00 0.00 0.00 0.00 0.00 0.00 0.00 0.00 0.0022 Tamil Nadu 299.33 191.23 63.89 0.00 0.00 0.00 0.00 6.78 2.27 0.00 0.00 0.00 0.0023 Tripura 0.00 0.00 0.00 0.00 0.00 0.00 0.00 0.00 0.00 0.00 0.00 0.00 0.0024 Uttar Pradesh 212.82 138.47 65.06 0.00 0.00 5.12 2.41 6.99 3.28 0.32 0.15 0.00 0.0025 West Bengal 0.00 0.00 0.00 0.00 0.00 0.00 0.00 0.00 0.00 0.00 0.00 0.00 0.0026 ALL INDIA 2282.84 1302.23 57.04 0.45 0.02 81.89 3.59 56.77 2.49 1.32 0.06 0.00 0.00--2--Cont-2
S. No. Name <strong>of</strong> stateType <strong>of</strong> retentionTotal retention Total purchases. Total <strong>losses</strong> Farm familyrequirementMarketable<strong>surplus</strong>K<strong>in</strong>d payment Barter(others)Qty. % Qty. % Qty. % Qty. % Qty. % Qty. % Qty. %1 2 16 17 18 19 20 21 22 23 24 25 26 27 28 291 Andhra Pradesh 3.97 2.95 0.00 0.00 44.74 33.23 0.00 0.00 5.15 3.83 49.89 37.05 84.75 62.952 Arunachal Pradesh 0.00 0.00 0.00 0.00 0.00 0.00 0.00 0.00 0.00 0.00 0.00 0.00 0.00 0.003 Assam 0.00 0.00 0.00 0.00 0.00 0.00 0.00 0.00 0.00 0.00 0.00 0.00 0.00 0.004 Bihar 2.27 3.25 0.00 0.00 65.36 93.53 0.00 0.00 4.06 5.81 69.42 99.34 0.46 0.665 Goa 0.00 0.00 0.00 0.00 0.00 0.00 0.00 0.00 0.00 0.00 0.00 0.00 0.00 0.006 Gujarat 0.00 0.00 0.00 0.00 16.20 77.92 0.00 0.00 0.87 4.18 17.07 82.11 3.72 17.897 Haryana 0.00 0.00 0.00 0.00 0.00 0.00 0.00 0.00 0.00 0.00 0.00 0.00 0.00 0.008 Himachal Pradesh 0.21 3.25 0.00 0.00 6.08 94.12 0.00 0.00 0.20 3.10 6.28 97.21 0.18 2.799 Jammu <strong>and</strong> Kashmir 0.00 0.00 0.00 0.00 0.00 0.00 0.00 0.00 0.00 0.00 0.00 0.00 0.00 0.0010 Karnataka 31.97 2.43 0.00 0.00 832.10 63.23 0.00 0.00 50.37 3.83 882.47 67.06 433.50 32.9411 Kerala 0.00 0.00 0.00 0.00 0.00 0.00 0.00 0.00 0.00 0.00 0.00 0.00 0.00 0.0012 Madhya Pradesh 0.00 0.00 0.00 0.00 2.84 76.96 0.00 0.00 0.23 6.23 3.01 81.57 0.62 16.8013 Maharashtra 0.00 0.00 0.00 0.00 125.12 78.78 0.00 0.00 5.67 3.57 130.79 82.35 28.03 17.6514 Manipur 0.00 0.00 0.00 0.00 0.00 0.00 0.00 0.00 0.00 0.00 0.00 0.00 0.00 0.0015 Meghalaya 0.00 0.00 0.00 0.00 0.00 0.00 0.00 0.00 0.00 0.00 0.00 0.00 0.00 0.0016 Mizoram 0.00 0.00 0.00 0.00 0.00 0.00 0.00 0.00 0.00 0.00 0.00 0.00 0.00 0.0017 Nagal<strong>and</strong> 0.00 0.00 0.00 0.00 0.00 0.00 0.00 0.00 0.00 0.00 0.00 0.00 0.00 0.0018 Orissa 1.74 2.88 0.00 0.00 41.47 68.61 0.00 0.00 3.16 5.23 44.63 73.84 15.81 26.1619 Punjab 0.00 0.00 0.00 0.00 0.00 0.00 0.00 0.00 0.00 0.00 0.00 0.00 0.00 0.0020 Rajasthan 0.00 0.00 0.00 0.00 0.00 0.00 0.00 0.00 0.00 0.00 0.00 0.00 0.00 0.0021 Sikkim 0.00 0.00 0.00 0.00 0.00 0.00 0.00 0.00 0.00 0.00 0.00 0.00 0.00 0.0022 Tamil Nadu 27.42 9.16 0.00 0.00 225.43 75.31 0.00 0.00 9.67 3.23 235.10 78.54 64.23 21.4623 Tripura 0.00 0.00 0.00 0.00 0.00 0.00 0.00 0.00 0.00 0.00 0.00 0.00 0.00 0.0024 Uttar Pradesh 15.56 7.31 0.00 0.00 166.46 78.22 0.00 0.00 7.52 3.53 173.98 81.75 38.84 18.2525 West Bengal 0.00 0.00 0.00 0.00 0.00 0.00 0.00 0.00 0.00 0.00 0.00 0.00 0.00 0.0026 ALL INDIA 83.14 3.64 0.00 0.00 1525.80 66.84 0.00 0.00 86.90 3.81 1612.70 70.64 670.14 29.36
Annexure – LIXMarketed Surplus Vis-à-vis Marketable Surplus– Small Category Cultivators(Triennium end<strong>in</strong>g 1998-99)(<strong>in</strong> ‘000 tonnes)Total production Total Qty.Marketed <strong>surplus</strong> Marketable <strong>surplus</strong> DifferenceS.No. Name <strong>of</strong> stateutilisedQty. % Qty. % Qty. % Qty. %1 2 3 4 5 6 7 8 9 10 111 Andhra Pradesh 40.48 29.91 73.89 10.41 25.72 10.57 26.11 0.16 0.402 Arunachal Pradesh 0.00 0.00 0.00 0 0.00 0.00 0.00 0.00 0.003 Assam 0.00 0.00 0.00 0 0.00 0.00 0.00 0.00 0.004 Bihar 15.29 15.11 98.82 0 0.00 0.18 1.18 0.18 1.185 Goa 0.00 0.00 0.00 0 0.00 0.00 0.00 0.00 0.006 Gujarat 10.11 8.45 83.58 1.57 15.53 1.66 16.42 0.09 0.897 Haryana 0.00 0.00 0.00 0 0.00 0.00 0.00 0.00 0.008 Himachal Pradesh 2.47 2.34 94.74 0 0.00 0.13 5.26 0.13 5.269 Jammu <strong>and</strong> Kashmir 0.00 0.00 0.00 0 0.00 0.00 0.00 0.00 0.0010 Karnataka 499.29 363.64 72.83 132.73 26.58 135.65 27.17 2.92 0.5811 Kerala 0.00 0.00 0.00 0 0.00 0.00 0.00 0.00 0.0012 Madhya Pradesh 0.92 0.80 86.96 0.11 11.96 0.12 13.04 0.01 1.0913 Maharashtra 52.17 45.34 86.91 6.33 12.13 6.83 13.09 0.50 0.9614 Manipur 0.00 0.00 0.00 0 0.00 0.00 0.00 0.00 0.0015 Meghalaya 0.00 0.00 0.00 0 0.00 0.00 0.00 0.00 0.0016 Mizoram 0.00 0.00 0.00 0 0.00 0.00 0.00 0.00 0.0017 Nagal<strong>and</strong> 0.00 0.00 0.00 0 0.00 0.00 0.00 0.00 0.0018 Orissa 19.94 14.22 71.31 5.67 28.44 5.72 28.69 0.05 0.2519 Punjab 0.00 0.00 0.00 0 0.00 0.00 0.00 0.00 0.0020 Rajasthan 0.00 0.00 0.00 0 0.00 0.00 0.00 0.00 0.0021 Sikkim 0.00 0.00 0.00 0 0.00 0.00 0.00 0.00 0.0022 Tamil Nadu 117.38 95.87 81.67 20.83 17.75 21.51 18.33 0.68 0.5823 Tripura 0.00 0.00 0.00 0 0.00 0.00 0.00 0.00 0.0024 Uttar Pradesh 85.96 72.91 84.82 8.61 10.02 13.05 15.18 4.44 5.1725 West Bengal 0.00 0.00 0.00 0 0.00 0.00 0.00 0.00 0.0026 ALL INDIA 844.01 648.59 76.15 186.26 22.07 195.42 23.15 9.16 1.09
Annexure – LXMarketed Surplus Vis-à-vis Marketable Surplus– Medium Category Cultivators(Triennium end<strong>in</strong>g 1998-99)(<strong>in</strong> ‘000 tonnes)Total productionTotal Qty.Marketed <strong>surplus</strong> Marketable <strong>surplus</strong> DifferenceS.No. StateutilisedQty. % Qty. % Qty. % Qty. %1 2 3 4 5 6 7 8 9 10 111 Andhra Pradesh 60.83 13.19 21.68 47.26 77.69 47.64 78.32 0.38 0.622 Arunachal Pradesh 0.00 0.00 0.00 0.00 0.00 0.00 0.00 0.00 0.003 Assam 0.00 0.00 0.00 0.00 0.00 0.00 0.00 0.00 0.004 Bihar 20.69 20.58 99.47 0.00 0.00 0.11 0.53 0.11 0.535 Goa 0.00 0.00 0.00 0.00 0.00 0.00 0.00 0.00 0.006 Gujarat 8.84 7.15 80.88 1.60 18.10 1.69 19.12 0.09 1.027 Haryana 0.00 0.00 0.00 0.00 0.00 0.00 0.00 0.00 0.008 Himachal Pradesh 2.37 2.34 98.73 0.00 0.00 0.03 1.27 0.03 1.279 Jammu <strong>and</strong> Kashmir 0.00 0.00 0.00 0.00 0.00 0.00 0.00 0.00 0.0010 Karnataka 369.38 234.17 63.40 132.87 35.97 135.21 36.60 2.34 0.6311 Kerala 0.00 0.00 0.00 0.00 0.00 0.00 0.00 0.00 0.0012 Madhya Pradesh 0.25 0.22 88.00 0.03 12.00 0.03 12.00 0.00 0.0013 Maharashtra 52.23 42.18 80.76 9.79 18.74 10.05 19.24 0.26 0.5014 Manipur 0.00 0.00 0.00 0.00 0.00 0.00 0.00 0.00 0.0015 Meghalaya 0.00 0.00 0.00 0.00 0.00 0.00 0.00 0.00 0.0016 Mizoram 0.00 0.00 0.00 0.00 0.00 0.00 0.00 0.00 0.0017 Nagal<strong>and</strong> 0.00 0.00 0.00 0.00 0.00 0.00 0.00 0.00 0.0018 Orissa 21.14 16.07 76.02 4.97 23.51 5.07 23.98 0.10 0.4719 Punjab 0.00 0.00 0.00 0.00 0.00 0.00 0.00 0.00 0.0020 Rajasthan 0.00 0.00 0.00 0.00 0.00 0.00 0.00 0.00 0.0021 Sikkim 0.00 0.00 0.00 0.00 0.00 0.00 0.00 0.00 0.0022 Tamil Nadu 89.40 68.66 76.80 20.42 22.84 20.74 23.20 0.32 0.3623 Tripura 0.00 0.00 0.00 0.00 0.00 0.00 0.00 0.00 0.0024 Uttar Pradesh 46.01 37.18 80.81 8.62 18.74 8.83 19.19 0.21 0.4625 West Bengal 0.00 0.00 0.00 0.00 0.00 0.00 0.00 0.00 0.0026 ALL INDIA 671.14 441.74 65.82 225.57 33.61 229.40 34.18 3.83 0.57
Annexure – LXIMarketed Surplus Vis-à-vis Marketable Surplus– Large Category Cultivators(Triennium end<strong>in</strong>g 1998-99)(<strong>in</strong> ‘000 tonnes)Total production Total Qty.Marketed <strong>surplus</strong> Marketable <strong>surplus</strong> DifferenceS.No. StateutilisedQty. % Qty. % Qty. % Qty. %1 2 3 4 5 6 7 8 9 10 111 Andhra Pradesh 33.33 6.79 20.37 26.38 79.15 26.54 79.63 0.16 0.482 Arunachal Pradesh 0.00 0.00 0.00 0.00 0.00 0.00 0.00 0.00 0.003 Assam 0.00 0.00 0.00 0.00 0.00 0.00 0.00 0.00 0.004 Bihar 33.90 33.73 99.50 0.00 0.00 0.17 0.50 0.17 0.505 Goa 0.00 0.00 0.00 0.00 0.00 0.00 0.00 0.00 0.006 Gujarat 1.84 1.47 79.89 0.35 19.02 0.37 20.11 0.02 1.097 Haryana 0.00 0.00 0.00 0.00 0.00 0.00 0.00 0.00 0.008 Himachal Pradesh 1.62 1.60 98.77 0.00 0.00 0.02 1.23 0.02 1.239 Jammu <strong>and</strong> Kashmir 0.00 0.00 0.00 0.00 0.00 0.00 0.00 0.00 0.0010 Karnataka 447.30 284.66 63.64 160.45 35.87 162.64 36.36 2.19 0.4911 Kerala 0.00 0.00 0.00 0.00 0.00 0.00 0.00 0.00 0.0012 Madhya Pradesh 2.52 2.05 81.35 0.47 18.65 0.47 18.65 0.00 0.0013 Maharashtra 54.42 43.27 79.51 11 20.21 11.15 20.49 0.15 0.2814 Manipur 0.00 0.00 0.00 0.00 0.00 0.00 0.00 0.00 0.0015 Meghalaya 0.00 0.00 0.00 0.00 0.00 0.00 0.00 0.00 0.0016 Mizoram 0.00 0.00 0.00 0.00 0.00 0.00 0.00 0.00 0.0017 Nagal<strong>and</strong> 0.00 0.00 0.00 0.00 0.00 0.00 0.00 0.00 0.0018 Orissa 19.36 14.34 74.07 4.92 25.41 5.02 25.93 0.10 0.5219 Punjab 0.00 0.00 0.00 0.00 0.00 0.00 0.00 0.00 0.0020 Rajasthan 0.00 0.00 0.00 0.00 0.00 0.00 0.00 0.00 0.0021 Sikkim 0.00 0.00 0.00 0.00 0.00 0.00 0.00 0.00 0.0022 Tamil Nadu 92.55 70.57 76.25 21.44 23.17 21.98 23.75 0.54 0.5823 Tripura 0.00 0.00 0.00 0.00 0.00 0.00 0.00 0.00 0.0024 Uttar Pradesh 80.85 63.89 79.02 16.5 20.41 16.96 20.98 0.46 0.5725 West Bengal 0.00 0.00 0.00 0.00 0.00 0.00 0.00 0.00 0.0026 ALL INDIA 767.69 522.37 68.04 241.51 31.46 245.32 31.96 3.81 0.50
Annexure – LXIIMarketed Surplus Vis-à-vis Marketable Surplus– All Category Cultivators(Triennium end<strong>in</strong>g 1998-99)(<strong>in</strong> ‘000 tonnes)Total production Total Qty. utilised Marketed <strong>surplus</strong> Marketable <strong>surplus</strong> DifferenceS.No. StateQty. % Qty. % Qty. % Qty. %1 2 3 4 5 6 7 8 9 10 111 Andhra Pradesh 134.64 49.89 37.05 84.05 62.43 84.75 62.95 0.70 0.522 Arunachal Pradesh 0.00 0.00 0.00 0.00 0.00 0.00 0.00 0.00 0.003 Assam 0.00 0.00 0.00 0.00 0.00 0.00 0.00 0.00 0.004 Bihar 69.88 69.42 99.34 0.00 0.00 0.46 0.66 0.46 0.665 Goa 0.00 0.00 0.00 0.00 0.00 0.00 0.00 0.00 0.006 Gujarat 20.79 17.07 82.11 3.52 16.93 3.72 17.89 0.20 0.967 Haryana 0.00 0.00 0.00 0.00 0.00 0.00 0.00 0.00 0.008 Himachal Pradesh 6.46 6.28 97.21 0.00 0.00 0.18 2.79 0.18 2.799 Jammu <strong>and</strong> Kashmir 0.00 0.00 0.00 0.00 0.00 0.00 0.00 0.00 0.0010 Karnataka 1315.97 882.47 67.06 426.05 32.38 433.50 32.94 7.45 0.5711 Kerala 0.00 0.00 0.00 0.00 0.00 0.00 0.00 0.00 0.0012 Madhya Pradesh 3.69 3.07 83.20 0.61 16.53 0.62 16.80 0.01 0.2713 Maharashtra 158.82 130.79 82.35 27.12 17.08 28.03 17.65 0.91 0.5714 Manipur 0.00 0.00 0.00 0.00 0.00 0.00 0.00 0.00 0.0015 Meghalaya 0.00 0.00 0.00 0.00 0.00 0.00 0.00 0.00 0.0016 Mizoram 0.00 0.00 0.00 0.00 0.00 0.00 0.00 0.00 0.0017 Nagal<strong>and</strong> 0.00 0.00 0.00 0.00 0.00 0.00 0.00 0.00 0.0018 Orissa 60.44 44.63 73.84 15.56 25.74 15.81 26.16 0.25 0.4119 Punjab 0.00 0.00 0.00 0.00 0.00 0.00 0.00 0.00 0.0020 Rajasthan 0.00 0.00 0.00 0.00 0.00 0.00 0.00 0.00 0.0021 Sikkim 0.00 0.00 0.00 0.00 0.00 0.00 0.00 0.00 0.0022 Tamil Nadu 299.33 235.10 78.54 62.69 20.94 64.23 21.46 1.54 0.5123 Tripura 0.00 0.00 0.00 0.00 0.00 0.00 0.00 0.00 0.0024 Uttar Pradesh 212.82 173.98 81.75 33.73 15.85 38.84 18.25 5.11 2.4025 West Bengal 0.00 0.00 0.00 0.00 0.00 0.00 0.00 0.00 0.0026 All India 2282.84 1612.70 70.64 653.34 28.62 670.14 29.36 16.80 0.74
Annexure-LXIIISt<strong>and</strong>ard Errors for Estimates <strong>of</strong> Marketable Surplus, Marketed Surplus <strong>and</strong>Post-<strong>harvest</strong> Losses <strong>of</strong> RagiS. No. State Marketable Surplus Marketed Surplus Total <strong>post</strong> <strong>harvest</strong> <strong>losses</strong>1 Andhra Pradesh 0.41 0.42 0.722 Arunachal Pradesh - - -3 Assam - - -4 Bihar 2.37 7.89 0.555 Goa - - -6 Gujarat 1.24 1.36 0.987 Haryana - - -8 Himachal Pradesh 1.48 1.66 0.879 Jammu & Kashmir - - -10 Karnataka 0.92 0.82 0.9611 Kerala - - -12 Madhya Pradesh 0.75 1.28 1.4413 Maharashtra - - -14 Manipur - - -15 Meghalaya - - -16 Mizoram - - -17 Nagal<strong>and</strong> - - -18 Orissa 1.23 1.72 0.4219 Punjab - - -20 Rajasthan - - -21 Sikkim - - -22 Tamil Nadu 1.36 1.20 0.8023 Tripura - - -24 Uttar Pradesh 1.67 1.46 0.9125 West Bengal - - -All India 1.17 1.18 0.82
CREDITSCHIEF PROJECT COORDINATOR1) Dr. G.R. BhatiaAddl. Agricultural Market<strong>in</strong>g Adviser(w.e.f. 14.01.2001)2) Shri h.p.s<strong>in</strong>ghJt. Agricultural Market<strong>in</strong>g Adviser(W.e.f.10 -11-2002)3) Shri R.J. Verma,Jt. Agricultural Market<strong>in</strong>g Adviser(upto 13.01.2002)4) Shri B.D.SherkarDy. Agricultural Market<strong>in</strong>g Adviser(w.e.f. 01-09-2002)5) Shri R.A. Khanorkar,Dy. Agricultural Market<strong>in</strong>g Adviser(Upto 31-08-2002)Project Coord<strong>in</strong>atorREGIONAL/SUB-OFFICE LEVEL PROJECT COORDINATORS1) Shri. Santri Prasad, Dy. Agricultural Market<strong>in</strong>g Adviser, New Delhi2) Shri D.P. S<strong>in</strong>gh, Dy. A.M.A., New Delhi3) Shri Har Prasad, Dy. A.M.A. Ch<strong>and</strong>igarh4) Dr. Jamanlal, Dy. A.M.A., Jaipur5) Shri R.M. Karpate, Dy. A.M.A., Calcutta6) Shri S.K. Malik, Dy. A.M.A., Calcutta7) Dr. B.K. S<strong>in</strong>ha, Dy. A.M.A., Guwahati8) Shri S.D. Phadke, Dy. A.M.A., Bhopal9) Dr. S.S.P. Rao, Dy. A.M.A., Bhopal10) Dr. Shanmugam, Dy. A.M.A., Chennai11) Dr. Nara<strong>in</strong> S<strong>in</strong>gh, Dy. A.M.A., Coch<strong>in</strong>12) Shri R.S. S<strong>in</strong>gh, Dy. A.M.A., Mumbai13) Shri K.P. S<strong>in</strong>gh, S.M.O., Jammu14) Shri Shfiq Ahmed, S.M.O.15) H.N. Abbassi, SMO Patna.16) Shri V.L. Vairagar, S.M.O.17) Shri E. Mohan Naidu, SMO Hyderabad18) Dr. Sajni Kumar, Bangalore19) Shri E.S. Paulose, S.M.O., Bangalore.20) Shri T.K. Ray, Senior Market<strong>in</strong>g Officer21) Shri N.L. S<strong>in</strong>gh, Market<strong>in</strong>g Officer22) Shri M.S. Bankar, Market<strong>in</strong>g Officer23) Shri S.D. Kathalkar, Market<strong>in</strong>g Officer24) Shri P.G. Choudhari, Market<strong>in</strong>g Officer25) Shri M.P. Parashar, Market<strong>in</strong>g Officer26) Shri Manoj Kumar, Market<strong>in</strong>g Officer
27) Shri Manish Chowdhary, Market<strong>in</strong>g Officer28) Shri Bhavesh Kumar Joshi, Market<strong>in</strong>g OfficerASSISTANT PROJECT COORDINATORS (STATE LEVEL)(REDEPLOYED OFFICERS)29) Shri C. N<strong>and</strong>aiah, Market<strong>in</strong>g Officer, Hyderabad30) Shri A.K. Das, Market<strong>in</strong>g Officer, Calcutta31) Shri N.G. Das, Market<strong>in</strong>g Officer, Calcutta32) Shri Jay Prakash, Market<strong>in</strong>g Officer Patna33) Shri M.K. Dwividi, Market<strong>in</strong>g Officer Patna34) Shri M. Jagan Mohan Rao, Market<strong>in</strong>g Officer Goa35) Shri H.C. Vatsal, Market<strong>in</strong>g Officer, Ahmedabad36) Shri R.K.Meena, Market<strong>in</strong>g Officer, Ch<strong>and</strong>igarh37) Shri K.C. Raut, Market<strong>in</strong>g Officer, Ch<strong>and</strong>igarh38) Shri R.R.S. Rathor, Market<strong>in</strong>g Officer, Ch<strong>and</strong>igarh39) Shri A.S. Sharma, Market<strong>in</strong>g Officer, Jammu Tawi40) Shri N.K. Mishra, Market<strong>in</strong>g Officer, Jammu Tawi41) Shri B. Purohit, Market<strong>in</strong>g Officer, Bangalore42) Shri S. Nuhu Kannu, Market<strong>in</strong>g Officer, Kerala43) Shri R.S. S<strong>in</strong>gh, Senior Market<strong>in</strong>g Officer, Bhopal44) Shri R.S. S<strong>in</strong>gh, Senior Market<strong>in</strong>g Officer, Pune45) Shri V.M. Hedaoo, Market<strong>in</strong>g Officer Mumbai46) Shri S.O. Ganorkar, Market<strong>in</strong>g Officer Nasik47) Shri P. P. Mukhopadhyay, Market<strong>in</strong>g Officer, Calcutta48) Shri G.B. D<strong>and</strong>i, Market<strong>in</strong>g Officer, Calcutta49) Shri R.C. P<strong>and</strong>a, Market<strong>in</strong>g Officer, Bhubaneshwar50) Shri C. Jena, Market<strong>in</strong>g Officer, Bhubaneshwar51) Shri M.L. Meena, Market<strong>in</strong>g Officer Jaipur52) Shri Raja Ram Rawat Market<strong>in</strong>g Officer Jaipur53) Shri K. Jayan<strong>and</strong>an, Market<strong>in</strong>g Officer, Chennai54) Shri R.B.S. Yadav, Market<strong>in</strong>g Officer, Lucknow55) Shri G.B. Rabbani, Market<strong>in</strong>gg Officer, Lucknow56) Shri H.N. Rai, Market<strong>in</strong>g Officer Lucknow57) Shri R.G. S<strong>in</strong>gh, Market<strong>in</strong>g Officer, New Delhi58) Shri H.C. Halder, Senior Market<strong>in</strong>g Officer, Calcutta.59) Smt. Premlata K. Chawla, Stenographer60) Shri S.L. Solanki, L.D.C.61) Smt. Indira Hedaoo, U.D.C.62) Smt. Asha Gotaphode, U.D.C.63) Smt. S.R. Pendam, U.D.C.64) Ku. Kalpana, Meshram, Statistical Assistant.65) Shri Viplav Meshram, Statistical Assistant66) Shri Vijay Kumbhare, L.D.C.67) Shri Shekhar Paunikar, L.D.C.68) Shri C.G.N<strong>in</strong>awe, L.D.C.Secretarial Assistance