Management of Remand Detainees in South Africa - DCS-Home
Management of Remand Detainees in South Africa - DCS-Home
Management of Remand Detainees in South Africa - DCS-Home

You also want an ePaper? Increase the reach of your titles
YUMPU automatically turns print PDFs into web optimized ePapers that Google loves.
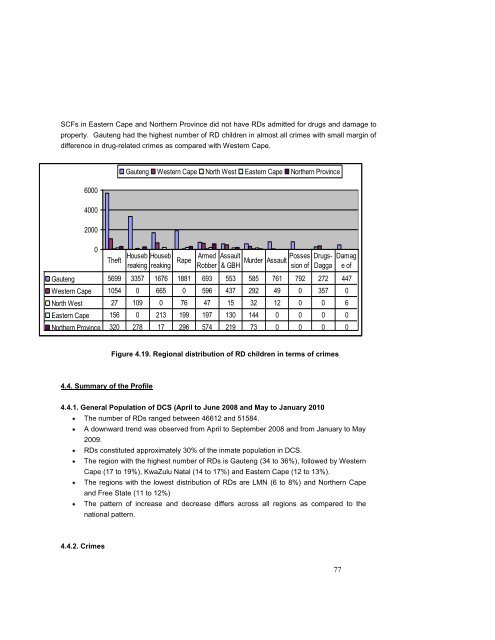
SCFs <strong>in</strong> Eastern Cape and Northern Prov<strong>in</strong>ce did not have RDs admitted for drugs and damage to<br />
property. Gauteng had the highest number <strong>of</strong> RD children <strong>in</strong> almost all crimes with small marg<strong>in</strong> <strong>of</strong><br />
difference <strong>in</strong> drug-related crimes as compared with Western Cape.<br />
6000<br />
4000<br />
2000<br />
0<br />
Gauteng Western Cape North West Eastern Cape Northern Prov<strong>in</strong>ce<br />
Theft Houseb Houseb<br />
reak<strong>in</strong>g reak<strong>in</strong>g<br />
Gauteng 5699 3357 1676 1881 693 553 585 761 792 272 447<br />
Western Cape 1054 0 665 0 596 437 292 49 0 357 0<br />
North West 27 109 0 76 47 15 32 12 0 0 6<br />
Eastern Cape 156 0 213 199 197 130 144 0 0 0 0<br />
Northern Prov<strong>in</strong>ce 320 278 17 296 574 219 73 0 0 0 0<br />
4.4. Summary <strong>of</strong> the Pr<strong>of</strong>ile<br />
Armed Assault<br />
Rape<br />
Robber & GBH<br />
Murder Assault Posses<br />
sion <strong>of</strong><br />
Drugs-<br />
Dagga<br />
Figure 4.19. Regional distribution <strong>of</strong> RD children <strong>in</strong> terms <strong>of</strong> crimes<br />
4.4.1. General Population <strong>of</strong> <strong>DCS</strong> (April to June 2008 and May to January 2010<br />
The number <strong>of</strong> RDs ranged between 46612 and 51584.<br />
Damag<br />
e <strong>of</strong><br />
A downward trend was observed from April to September 2008 and from January to May<br />
2009.<br />
4.4.2. Crimes<br />
RDs constituted approximately 30% <strong>of</strong> the <strong>in</strong>mate population <strong>in</strong> <strong>DCS</strong>.<br />
The region with the highest number <strong>of</strong> RDs is Gauteng (34 to 36%), followed by Western<br />
Cape (17 to 19%), KwaZulu Natal (14 to 17%) and Eastern Cape (12 to 13%).<br />
The regions with the lowest distribution <strong>of</strong> RDs are LMN (6 to 8%) and Northern Cape<br />
and Free State (11 to 12%)<br />
The pattern <strong>of</strong> <strong>in</strong>crease and decrease differs across all regions as compared to the<br />
national pattern.<br />
77