- Page 1 and 2:
Copyright Warning & RestrictionsThe
- Page 3 and 4:
ABSTRACTHEAVY METAL ADSORPTION ON I
- Page 5 and 6:
HEAVY METAL ADSORPTION ON IRON OXID
- Page 7 and 8:
APPROVAL PAGEHEAVY METAL ADSORPTION
- Page 9 and 10:
Fan, M.; Boonfueng, T.; Xu, Y.; Axe
- Page 11 and 12:
ACKNOWLEDGMENTI would like to expre
- Page 13 and 14:
TABLE OF CONTENTS(Continued)Chapter
- Page 15 and 16:
TABLE OF CONTENTS(Continued)Chapter
- Page 17 and 18:
LIST OF TABLES(Continued)TablePageB
- Page 19 and 20:
LIST OF FIGURES(Continued)FigurePag
- Page 21 and 22:
LIST OF FIGURES(Continued)FigurePag
- Page 23 and 24:
CHAPTER 1INTRODUCTIONHeavy<
- Page 25 and 26:
3and Sigg, 1992; Gunneriusson et al
- Page 27 and 28: CHAPTER 2OXIDES AND THEIR EFFECT ON
- Page 29 and 30: 7et al. 1996; Green-Pedersen et al.
- Page 31 and 32: 9identify components, distribution,
- Page 33 and 34: 11oxides. Because extraction method
- Page 35 and 36: 13Table 2.2 Some Coating Work and C
- Page 37 and 38: 15increasing the sorbate concentrat
- Page 39 and 40: 17mole Cu g-1 goethite (-1-7% of th
- Page 41 and 42: 19Overall, macroscopic adso
- Page 43 and 44: 21hematite (up to 9.9 limo' Pb ril-
- Page 45 and 46: 23concentration in their system was
- Page 47 and 48: 25Surface complexation modeling (SC
- Page 49 and 50: 27Overall, surface complexation mod
- Page 51 and 52: 29Spectroscopic techniques, especia
- Page 53 and 54: 31• Understand the effect of comp
- Page 55 and 56: 33existing in almost all soils and
- Page 57 and 58: CHAPTER 4EXPERIMENTAL METHODSIn thi
- Page 59 and 60: 37included coating temperature (T),
- Page 61 and 62: 39generated at 45 kV and 40 mA, sca
- Page 63 and 64: 41PZC include electrophoretic mobil
- Page 65 and 66: 43Lin-edge, from 8,133 to 8,884 eV
- Page 67 and 68: CHAPTER 5CHARACTERIZATION OF IRON O
- Page 69 and 70: 47measured by potentiometric titrat
- Page 71 and 72: Table 5.2 XRD Data of Alfa Aesar (A
- Page 73 and 74: 51Table 5.3 XRF Results for Alfa Ae
- Page 75 and 76: Figure 5.4 Particle size distributi
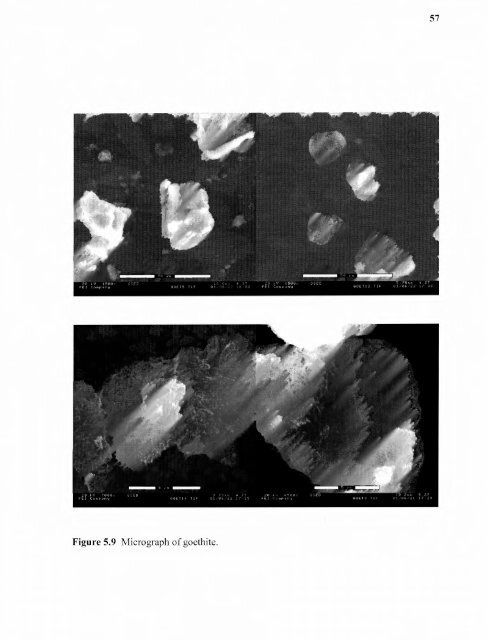
- Page 77: 55Figure 5.5 ESEM micrograph for Al
- Page 81 and 82: 59Table 5.4 Isoelectric Points of S
- Page 83 and 84: 615.3 SummaryFrom the results of XR
- Page 85 and 86: 63Table 6.1 Experimental Conditions
- Page 87 and 88: 65Extraction results after abrasion
- Page 89 and 90: Figure 6.3 XRD analysis of goethite
- Page 91 and 92: Figure 6.4 Effect of coating condit
- Page 93 and 94: Figure 6.5 FTIR spectra of a. silic
- Page 95 and 96: Figure 6.6 Optical micrograph of un
- Page 97 and 98: Figure 6.8 EDX results of goethite-
- Page 99 and 100: Figure 6.9 Pore size distribution (
- Page 101 and 102: 79(Figure 6.10). Schwarz et al. (19
- Page 103 and 104: 81Table 6.3 PZC Measured and Calcul
- Page 105 and 106: 83to silica was deducted from that
- Page 107 and 108: CHAPTER 7SURFACE COMPLEXATION OF PB
- Page 109 and 110: Figure 7.1 EXAFS spectra of Pb stan
- Page 111 and 112: Table 7.2 EXAFS Results of Pb Stand
- Page 113 and 114: 910.08 A. This octahedral structure
- Page 115 and 116: Figure 7.5 Fourier transform and fi
- Page 117 and 118: 95previous studies. Bargar et al. (
- Page 119 and 120: Figure 7.6 Fe K-edge XANES spectra
- Page 121 and 122: Figure 7.8 Fourier transform and fi
- Page 123 and 124: Table 7.4 EXAFS Results of Iron Oxi
- Page 125 and 126: Figure 7.9 Pb/HFO CBC study on 0.3
- Page 127 and 128: 105theoretically sorbed and the exp
- Page 129 and 130:
CHAPTER 8NI(II) COMPLEXATION TO AMO
- Page 131 and 132:
Figure 8.2 Ni adsorption</s
- Page 133 and 134:
Table 8.1 Preparation Conditions fo
- Page 135 and 136:
Table 8.2 EXAFS Results of Ni Stand
- Page 137 and 138:
115surface. Although the spectra ar
- Page 139 and 140:
Table 8.3 EXAFS Results of Ni/HFO S
- Page 141 and 142:
119pure boehmite (γ-A1OOH). Fundam
- Page 143 and 144:
Figure 8.6 )(k)•k3 spectra of HFO
- Page 145 and 146:
123stabilized by incorporating into
- Page 147 and 148:
125This reaction is also consistent
- Page 149 and 150:
127Goethite titration data were use
- Page 151 and 152:
129was highly correlated to site de
- Page 153 and 154:
131concentration is linearly relate
- Page 155 and 156:
133isotherm data (Figure 9.2). The
- Page 157 and 158:
Figure 9.4 Ni adsorption</s
- Page 159 and 160:
Figure 9.5 Zn adsorption</s
- Page 161 and 162:
Figure 9.7 Zn adsorption</s
- Page 163 and 164:
141Zn(II) (Figure 9.8). With a high
- Page 165 and 166:
143Ca competition on HFO; however,
- Page 167 and 168:
CHAPTER 10NI AND ZN SORPTION TO IRO
- Page 169 and 170:
147adsorption affi
- Page 171 and 172:
Figure 10.3 Comparison of Ni <stron
- Page 173 and 174:
151sites in the pH 6 and 7 isotherm
- Page 175 and 176:
Figure 10.5 Comparison of Zn <stron
- Page 177 and 178:
155M. Polymerization may occur at c
- Page 179 and 180:
157accounting for approximately 46%
- Page 181 and 182:
APPENDIX ASOLUBILITY AND SPECIATION
- Page 183 and 184:
Figure A.3 Pb solubility in open sy
- Page 185 and 186:
Figure A.5 Zn solubility in open sy
- Page 187 and 188:
APPENDIX BPOTENTIOMETRIC TITRATION
- Page 189 and 190:
167Table B.3 Potentiometric Titrati
- Page 191 and 192:
APPENDIX CADSORPTION STUDIES ON GOE
- Page 193 and 194:
171Table C.5 Ni Adsorption in Ni-Zn
- Page 195 and 196:
173Table D.3 Ni Adsorption Isotherm
- Page 197 and 198:
APPENDIX EADSORPTION STUDIES ON HFO
- Page 199 and 200:
APPENDIX FGOETHITE COATING RESULTSR
- Page 201 and 202:
179Next iFor i = 1 To nCBCfTime(i)
- Page 203 and 204:
181Next iCsDim fSorbCalc As Double,
- Page 205 and 206:
18314. Baes C. F. Jr. and Mesmer R.
- Page 207 and 208:
18538. Chao T. T. and Zhou L. (1983
- Page 209 and 210:
18763. De Kimpe C. R. (1993) Chaper
- Page 211 and 212:
18988. Fuller C. C., Davis J. A., C
- Page 213 and 214:
191113. Hiemstra T. and van Riemsdi
- Page 215 and 216:
193138. Kosmulski M. (1997) Standar
- Page 217 and 218:
195163. Manceau A., Tamura N., Cele
- Page 219 and 220:
197188. Ostergren J. D., Brown G. E
- Page 221 and 222:
199213. Ross G. J. and Wang C. (199
- Page 223 and 224:
201239. Singh B., Sherman D. M., Gi
- Page 225 and 226:
203266. Trivedi P., Axe L. and Dyer
- Page 227 and 228:
205290. Webster J. G., Swedlund P.