Aberdeen Global - Hozam Plaza
Aberdeen Global - Hozam Plaza
Aberdeen Global - Hozam Plaza

Create successful ePaper yourself
Turn your PDF publications into a flip-book with our unique Google optimized e-Paper software.
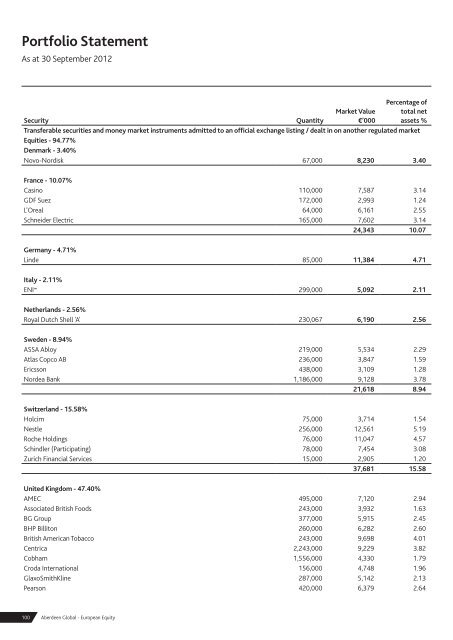
Portfolio StatementAs at 30 September 2012Percentage ofSecurityQuantityMarket Value€’000total netassets %Transferable securities and money market instruments admitted to an official exchange listing / dealt in on another regulated marketEquities - 94.77%Denmark - 3.40%Novo-Nordisk 67,000 8,230 3.40France - 10.07%Casino 110,000 7,587 3.14GDF Suez 172,000 2,993 1.24L'Oreal 64,000 6,161 2.55Schneider Electric 165,000 7,602 3.1424,343 10.07Germany - 4.71%Linde 85,000 11,384 4.71Italy - 2.11%ENI ∞ 299,000 5,092 2.11Netherlands - 2.56%Royal Dutch Shell 'A' 230,067 6,190 2.56Sweden - 8.94%ASSA Abloy 219,000 5,534 2.29Atlas Copco AB 236,000 3,847 1.59Ericsson 438,000 3,109 1.28Nordea Bank 1,186,000 9,128 3.7821,618 8.94Switzerland - 15.58%Holcim 75,000 3,714 1.54Nestle 256,000 12,561 5.19Roche Holdings 76,000 11,047 4.57Schindler (Participating) 78,000 7,454 3.08Zurich Financial Services 15,000 2,905 1.2037,681 15.58United Kingdom - 47.40%AMEC 495,000 7,120 2.94Associated British Foods 243,000 3,932 1.63BG Group 377,000 5,915 2.45BHP Billiton 260,000 6,282 2.60British American Tobacco 243,000 9,698 4.01Centrica 2,243,000 9,229 3.82Cobham 1,556,000 4,330 1.79Croda International 156,000 4,748 1.96GlaxoSmithKline 287,000 5,142 2.13Pearson 420,000 6,379 2.64100 <strong>Aberdeen</strong> <strong>Global</strong> - European Equity