Statement of Net AssetsAs at 30 September 2012US$’000AssetsInvestments in securities at market value (note 2.2) 141,651Cash at bank 4,144Interest and dividends receivable 409Subscriptions receivable 21Receivable for investments sold 227Other assets 42Total assets 146,494LiabilitiesPayable for investments purchased 1,058Taxes and expenses payable 264Redemptions payable 7Total liabilities 1,329Net assets at the end of the year 145,165Statement of Changes in Net AssetsFor the year from 1 October 2011 to 30 September 2012US$'000Net assets at the beginning of the year 123,745Net gains from investments 2,288Net realised losses (3,653)Net unrealised gains 24,106Proceeds from shares issued 41,214Payments for shares redeemed (42,151)Net equalisation paid (note 10) (384)Net assets at the end of the year 145,165Statement of OperationsFor the year from 1 October 2011 to 30 September 2012US$'000IncomeInvestment income 4,846Other income 92Total income 4,938ExpensesManagement fees (note 4.6) 2,342Administration fees (note 4.1) 69Custodian fees (note 4.2) 38Domiciliary agent, registrar, paying and transfer agentfees (note 4.4) 63Management Company fees (note 4.5) 16Operational expenses (note 4.7) 42Annual tax (note 4.9) 77Bank interest 3Total expenses 2,650Net gains from investments 2,288Realised losses on investments (3,573)Currency exchange losses (80)Net realised losses (3,653)Decrease in unrealised depreciation on investments 24,083Unrealised currency exchange gains 23Net unrealised gains 24,106Net increase in assets as a result of operations 22,741Share TransactionsFor the year from 1 October 2011 to 30 September 2012A-2Shares outstanding at the beginning of the year 14,210,392Shares issued during the year 4,265,265Shares redeemed during the year (4,272,188)Shares outstanding at the end of the year 14,203,469Net asset value per share 10.2204The accompanying notes form an integral part of these financial statements.94 <strong>Aberdeen</strong> <strong>Global</strong> - Ethical World Equity
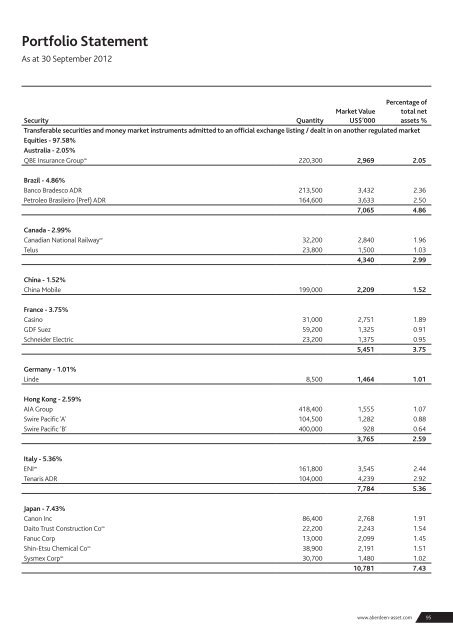
Portfolio StatementAs at 30 September 2012Percentage ofSecurityQuantityMarket ValueUS$’000total netassets %Transferable securities and money market instruments admitted to an official exchange listing / dealt in on another regulated marketEquities - 97.58%Australia - 2.05%QBE Insurance Group ∞ 220,300 2,969 2.05Brazil - 4.86%Banco Bradesco ADR 213,500 3,432 2.36Petroleo Brasileiro (Pref) ADR 164,600 3,633 2.507,065 4.86Canada - 2.99%Canadian National Railway ∞ 32,200 2,840 1.96Telus 23,800 1,500 1.034,340 2.99China - 1.52%China Mobile 199,000 2,209 1.52France - 3.75%Casino 31,000 2,751 1.89GDF Suez 59,200 1,325 0.91Schneider Electric 23,200 1,375 0.955,451 3.75Germany - 1.01%Linde 8,500 1,464 1.01Hong Kong - 2.59%AIA Group 418,400 1,555 1.07Swire Pacific 'A' 104,500 1,282 0.88Swire Pacific 'B' 400,000 928 0.643,765 2.59Italy - 5.36%ENI ∞ 161,800 3,545 2.44Tenaris ADR 104,000 4,239 2.927,784 5.36Japan - 7.43%Canon Inc 86,400 2,768 1.91Daito Trust Construction Co ∞ 22,200 2,243 1.54Fanuc Corp 13,000 2,099 1.45Shin-Etsu Chemical Co ∞ 38,900 2,191 1.51Sysmex Corp ∞ 30,700 1,480 1.0210,781 7.43www.aberdeen-asset.com95