Chinese EquityFor the year ended 30 September 2012PerformanceFor the year ended 30 September 2012, the value of the Chinese Equity- A Accumulation shares increased by 14.29% compared to an increaseof 21.44% in the benchmark, the MSCI Zhong Hua Index.Source: Lipper, Basis: total return, NAV to NAV, net of annual charges, gross incomereinvested, USD.Manager’s reviewChina and Hong Kong stock markets maintained a general uptrendand posted double-digit gains over the year under review. Investorsentiment was mainly lifted by hopes of looser monetary policy inlight of benign inflation data; the central bank lowered lenders’ reserverequirement ratio by 150 basis points and cut interest rates twice overthe period. Growth anxieties were persistent, however. Second-quarterGDP growth hit a three year-low of 7.6% as the property sectorweakened alongside exports. Apart from domestic concerns, riskappetite was also dampened by Europe’s debt crisis and the US’stenuous recovery. However, markets responded enthusiastically onthe back of aggressive central bank action towards the period-end.The European Central Bank unveiled a radical bond-buying programme,while the US Federal Reserve pressed ahead with an open-ended thirdround of quantitative easing. Notable political developments over theyear included the expulsion of former Chongqing party chief Bo Xilaifrom the Communist Party; he will face criminal charges. Separately,a longstanding territorial dispute with Japan escalated, leading toanti-Japan protests across China.On the other hand, conglomerate Swire Pacific and propertydeveloper Yanlord Land were key contributors to relative return.China’s move to ease monetary policy fuelled anticipation of looseningof property sector controls, bolstering Yanlord Land’s share price. SwirePacific was underpinned by its expansion into property and consumerbusinesses on the mainland, while significant recurring rental incomefrom its Hong Kong investment properties buffered it from short-termswings in China’s growth expectations. In addition, our lack of exposureto telecom operator China Unicom, which reported dull operatingnumbers, proved positive.In portfolio activity, we divested ENN Energy on concerns over itsjoint bid with Sinopec for China Gas. We also sold sportswear companyLi Ning, which posted disappointing results because of restructuringefforts and challenging industry conditions. Against this, we introducedsuitcase manufacturer Samsonite International, a globally recognisedbrand with clear growth prospects in emerging markets,particularly Asia.OutlookSluggish economic data have reinforced concerns about China’sgrowth outlook, raising pressure on Beijing to introduce newstimulus. But aggressive measures are unlikely given the authorities’determination to keep a lid on property prices. Fear of bad debts inthe banking system and industrial overcapacity will limit policymakers’options further.Portfolio reviewAt the stock level, the main laggards were textile company Texwincaas well as Hong Kong and Shanghai Hotels. Texwinca was weigheddown by higher operating costs, notably cotton prices, while HongKong and Shanghai Hotels underperformed amid worries that theglobal downturn would hurt travel-related businesses. Not holdingTencent also detracted from performance. The Internet companyposted good results but we remain doubtful over the sustainabilityof its business model.54 <strong>Aberdeen</strong> <strong>Global</strong> - Chinese Equity
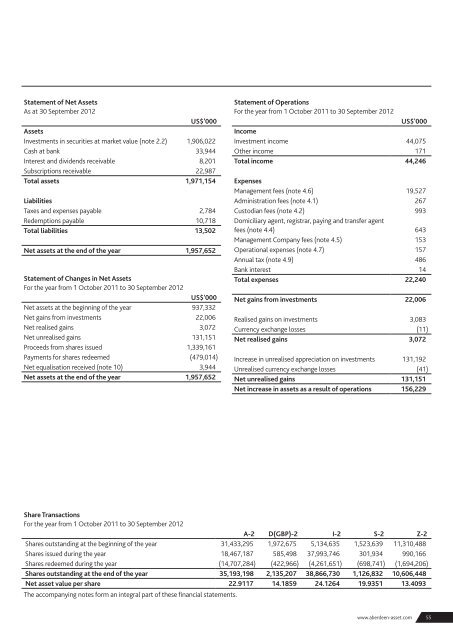
Statement of Net AssetsAs at 30 September 2012US$’000AssetsInvestments in securities at market value (note 2.2) 1,906,022Cash at bank 33,944Interest and dividends receivable 8,201Subscriptions receivable 22,987Total assets 1,971,154LiabilitiesTaxes and expenses payable 2,784Redemptions payable 10,718Total liabilities 13,502Net assets at the end of the year 1,957,652Statement of Changes in Net AssetsFor the year from 1 October 2011 to 30 September 2012US$'000Net assets at the beginning of the year 937,332Net gains from investments 22,006Net realised gains 3,072Net unrealised gains 131,151Proceeds from shares issued 1,339,161Payments for shares redeemed (479,014)Net equalisation received (note 10) 3,944Net assets at the end of the year 1,957,652Statement of OperationsFor the year from 1 October 2011 to 30 September 2012US$'000IncomeInvestment income 44,075Other income 171Total income 44,246ExpensesManagement fees (note 4.6) 19,527Administration fees (note 4.1) 267Custodian fees (note 4.2) 993Domiciliary agent, registrar, paying and transfer agentfees (note 4.4) 643Management Company fees (note 4.5) 153Operational expenses (note 4.7) 157Annual tax (note 4.9) 486Bank interest 14Total expenses 22,240Net gains from investments 22,006Realised gains on investments 3,083Currency exchange losses (11)Net realised gains 3,072Increase in unrealised appreciation on investments 131,192Unrealised currency exchange losses (41)Net unrealised gains 131,151Net increase in assets as a result of operations 156,229Share TransactionsFor the year from 1 October 2011 to 30 September 2012A-2 D(GBP)-2 I-2 S-2 Z-2Shares outstanding at the beginning of the year 31,433,295 1,972,675 5,134,635 1,523,639 11,310,488Shares issued during the year 18,467,187 585,498 37,993,746 301,934 990,166Shares redeemed during the year (14,707,284) (422,966) (4,261,651) (698,741) (1,694,206)Shares outstanding at the end of the year 35,193,198 2,135,207 38,866,730 1,126,832 10,606,448Net asset value per share 22.9117 14.1859 24.1264 19.9351 13.4093The accompanying notes form an integral part of these financial statements.www.aberdeen-asset.com55