Statement of Net AssetsAs at 30 September 2012US$’000AssetsInvestments in securities at market value (note 2.2) 13,338,782Cash at bank 400,517Interest and dividends receivable 29,360Subscriptions receivable 79,262Unrealised gains on forward currency exchangecontracts (note 2.6) 1,744Other assets 1,301Total assets 13,850,966LiabilitiesPayable for investments purchased 51,013Taxes and expenses payable 22,177Redemptions payable 35,634Other liabilities 266Total liabilities 109,090Net assets at the end of the year 13,741,876Statement of Changes in Net AssetsFor the year from 1 October 2011 to 30 September 2012US$'000Net assets at the beginning of the year 8,880,476Net gains from investments 100,101Net realised gains 43,693Net unrealised gains 2,054,163Proceeds from shares issued 6,685,604Payments for shares redeemed (4,023,863)Net equalisation received (note 10) 1,968Dividends paid (note 5) (266)Net assets at the end of the year 13,741,876Statement of OperationsFor the year from 1 October 2011 to 30 September 2012US$'000IncomeInvestment income 287,756Bank interest 485Other income 165Total income 288,406ExpensesGross management fees 162,273Less: Management fee cross holdings (402)Net Management fees (note 4.6) 161,871Administration fees (note 4.1) 1,368Custodian fees (note 4.2) 13,229Distribution fees (note 4.3) 375Domiciliary agent, registrar, paying and transfer agentfees (note 4.4) 4,964Management Company fees (note 4.5) 1,196Operational expenses (note 4.7) 1,102Annual tax (note 4.9) 4,200Total expenses 188,305Net gains from investments 100,101Realised gains on investments 57,081Currency exchange losses (13,467)Realised gains on forward currency exchange contracts 79Net realised gains 43,693Decrease in unrealised depreciation on investments 2,049,323Unrealised currency exchange gains 362Decrease in unrealised depreciation on forwardcurrency exchange contracts 4,478Net unrealised gains 2,054,163Net increase in assets as a result of operations 2,197,957Share TransactionsFor the year from 1 October 2011 to 30 September 2012A-1 A-2 A(CHF)-2^ B-2 C-2Shares outstanding at the beginning of the year 2,179,585 86,698,148 6,096,009 15,901 2,547,534Shares issued during the year 4,428,630 49,210,503 5,737,650 - 362,037Shares redeemed during the year (287,801) (33,892,022) (1,598,188) (15,901) (658,061)Shares outstanding at the end of the year 6,320,414 102,016,629 10,235,471 - 2,251,510Net asset value per share 10.1449 65.1365 12.9154 - 16.8589D(GBP)-2 E(EUR)-2 I-2 S-2 Z-2Shares outstanding at the beginning of the year 6,250,048 45,566,262 40,010,276 42,872 69,643,427Shares issued during the year 1,817,989 31,883,334 44,340,110 10,478 12,179,697Shares redeemed during the year (1,235,266) (14,783,991) (23,321,878) (19,830) (13,063,096)Shares outstanding at the end of the year 6,832,771 62,665,605 61,028,508 33,520 68,760,028Net asset value per share 40.5108 13.1228 68.2305 2,274.4470 16.1274^Hedge Share ClassThe accompanying notes form an integral part of these financial statements.70 <strong>Aberdeen</strong> <strong>Global</strong> - Emerging Markets Equity
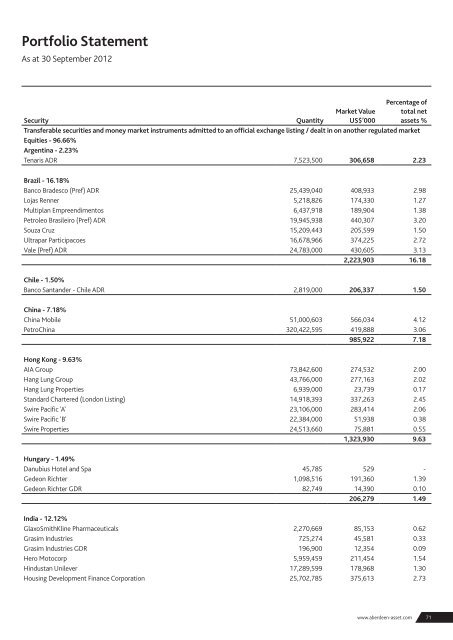
Portfolio StatementAs at 30 September 2012Percentage ofSecurityQuantityMarket ValueUS$’000total netassets %Transferable securities and money market instruments admitted to an official exchange listing / dealt in on another regulated marketEquities - 96.66%Argentina - 2.23%Tenaris ADR 7,523,500 306,658 2.23Brazil - 16.18%Banco Bradesco (Pref) ADR 25,439,040 408,933 2.98Lojas Renner 5,218,826 174,330 1.27Multiplan Empreendimentos 6,437,918 189,904 1.38Petroleo Brasileiro (Pref) ADR 19,945,938 440,307 3.20Souza Cruz 15,209,443 205,599 1.50Ultrapar Participacoes 16,678,966 374,225 2.72Vale (Pref) ADR 24,783,000 430,605 3.132,223,903 16.18Chile - 1.50%Banco Santander - Chile ADR 2,819,000 206,337 1.50China - 7.18%China Mobile 51,000,603 566,034 4.12PetroChina 320,422,595 419,888 3.06985,922 7.18Hong Kong - 9.63%AIA Group 73,842,600 274,532 2.00Hang Lung Group 43,766,000 277,163 2.02Hang Lung Properties 6,939,000 23,739 0.17Standard Chartered (London Listing) 14,918,393 337,263 2.45Swire Pacific 'A' 23,106,000 283,414 2.06Swire Pacific 'B' 22,384,000 51,938 0.38Swire Properties 24,513,660 75,881 0.551,323,930 9.63Hungary - 1.49%Danubius Hotel and Spa 45,785 529 -Gedeon Richter 1,098,516 191,360 1.39Gedeon Richter GDR 82,749 14,390 0.10206,279 1.49India - 12.12%GlaxoSmithKline Pharmaceuticals 2,270,669 85,153 0.62Grasim Industries 725,274 45,581 0.33Grasim Industries GDR 196,900 12,354 0.09Hero Motocorp 5,959,459 211,454 1.54Hindustan Unilever 17,289,599 178,968 1.30Housing Development Finance Corporation 25,702,785 375,613 2.73www.aberdeen-asset.com71