Statement of Net AssetsAs at 30 September 2012€’000AssetsInvestments in securities at market value (note 2.2) 37,655Cash at bank 601Interest and dividends receivable 78Subscriptions receivable 12Receivable for investments sold 106Total assets 38,452LiabilitiesTaxes and expenses payable 107Redemptions payable 358Total liabilities 465Net assets at the end of the year 37,987Statement of Changes in Net AssetsFor the year from 1 October 2011 to 30 September 2012€’000Net assets at the beginning of the year 44,102Net losses from investments (73)Net realised losses (2,495)Net unrealised gains 10,337Proceeds from shares issued 10,414Payments for shares redeemed (24,298)Net assets at the end of the year 37,987Statement of OperationsFor the year from 1 October 2011 to 30 September 2012€’000IncomeInvestment income 928Bank interest 1Other income 2Total income 931ExpensesManagement fees (note 4.6) 736Administration fees (note 4.1) 38Custodian fees (note 4.2) 159Domiciliary agent, registrar, paying and transfer agentfees (note 4.4) 16Management Company fees (note 4.5) 4Operational expenses (note 4.7) 33Annual tax (note 4.9) 18Total expenses 1,004Net losses from investments (73)Realised losses on investments (2,494)Currency exchange losses (1)Net realised losses (2,495)Decrease in unrealised depreciation on investments 10,337Unrealised currency exchange gains 2Decrease in unrealised appreciationon forward currency exchange contracts (2)Net unrealised gains 10,337Net increase in assets as a result of operations 7,769Share TransactionsFor the year from 1 October 2011 to 30 September 2012A-2 I-2 S-2Shares outstanding at the beginning of the year 2,030,173 12,851 2,872,959Shares issued during the year 294,986 7,666 282,719Shares redeemed during the year (726,046) (16,619) (828,927)Shares outstanding at the end of the year 1,599,113 3,898 2,326,751Net asset value per share 8.9715 729.5616 8.9381The accompanying notes form an integral part of these financial statements.140 <strong>Aberdeen</strong> <strong>Global</strong> - Russian Equity
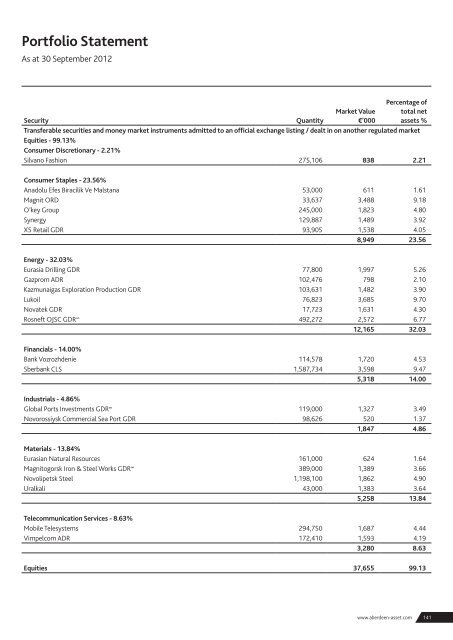
Portfolio StatementAs at 30 September 2012Percentage ofSecurityQuantityMarket Value€’000total netassets %Transferable securities and money market instruments admitted to an official exchange listing / dealt in on another regulated marketEquities - 99.13%Consumer Discretionary - 2.21%Silvano Fashion 275,106 838 2.21Consumer Staples - 23.56%Anadolu Efes Biracilik Ve Malstana 53,000 611 1.61Magnit ORD 33,637 3,488 9.18O’key Group 245,000 1,823 4.80Synergy 129,887 1,489 3.92X5 Retail GDR 93,905 1,538 4.058,949 23.56Energy - 32.03%Eurasia Drilling GDR 77,800 1,997 5.26Gazprom ADR 102,476 798 2.10Kazmunaigas Exploration Production GDR 103,631 1,482 3.90Lukoil 76,823 3,685 9.70Novatek GDR 17,723 1,631 4.30Rosneft OJSC GDR ∞ 492,272 2,572 6.7712,165 32.03Financials - 14.00%Bank Vozrozhdenie 114,578 1,720 4.53Sberbank CLS 1,587,734 3,598 9.475,318 14.00Industrials - 4.86%<strong>Global</strong> Ports Investments GDR ∞ 119,000 1,327 3.49Novorossiysk Commercial Sea Port GDR 98,626 520 1.371,847 4.86Materials - 13.84%Eurasian Natural Resources 161,000 624 1.64Magnitogorsk Iron & Steel Works GDR ∞ 389,000 1,389 3.66Novolipetsk Steel 1,198,100 1,862 4.90Uralkali 43,000 1,383 3.645,258 13.84Telecommunication Services - 8.63%Mobile Telesystems 294,750 1,687 4.44Vimpelcom ADR 172,410 1,593 4.193,280 8.63Equities 37,655 99.13www.aberdeen-asset.com141