Portfolio StatementAs at 30 September 2012Percentage ofSecurity Coupon (%) Maturity NominalMarket ValueUS$’000total netassets %Transferable securities and money market instruments admitted to an official exchange listing / dealt in on another regulated marketGovernment Bonds - 93.78%China - 6.21%China (Peoples Republic of) 0.6000 18/08/14 50,000,000 7,678 0.71China (Peoples Republic of) 1.4000 18/08/16 230,500,000 34,756 3.23China (Peoples Republic of) 1.8000 01/12/15 98,000,000 15,146 1.41China (Peoples Republic of) 1.9400 18/08/18 20,500,000 3,059 0.28China (Peoples Republic of) 2.5600 29/06/17 40,000,000 6,216 0.5866,855 6.21India - 2.78%India (Government of) 7.0200 17/08/16 350,000,000 6,398 0.59India (Government of) 7.5900 12/04/16 1,260,000,000 23,588 2.1929,986 2.78Indonesia - 4.06%Indonesia (Republic of) 12.5000 15/03/13 62,650,000,000 6,783 0.63Indonesia (Republic of) 9.5000 15/06/15 169,390,000,000 19,530 1.81Indonesia (Republic of) 11.0000 15/10/14 44,340,000,000 5,151 0.48Indonesia (Republic of) 11.0000 15/12/12 62,300,000,000 6,602 0.61Indonesia (Republic of) 9.0000 15/09/13 53,000,000,000 5,754 0.5343,820 4.06Malaysia - 22.41%Malaysia (Government of) 4.2620 15/09/16 39,220,000 13,313 1.24Malaysia (Government of) 3.3140 31/10/17 26,000,000 8,511 0.79Malaysia (Government of) 5.0940 30/04/14 139,500,000 47,105 4.37Malaysia (Government of) 3.5800 28/09/18 23,700,000 7,820 0.73Malaysia (Government of) 3.2100 31/05/13 79,470,000 26,040 2.42Malaysia (Government of) 3.7410 27/02/15 92,140,000 30,565 2.84Malaysia (Government of) 3.4610 31/07/13 131,450,000 43,175 4.01Malaysia (Government of) 3.1970 15/10/15 52,800,000 17,300 1.62Malaysia (Government of) 3.4340 15/08/14 143,500,000 47,289 4.39241,118 22.41Philippines - 6.93%Philippine (Republic of) 5.8750 31/01/18 75,000,000 1,921 0.18Philippine (Republic of) 8.7500 03/03/13 35,000,000 867 0.08Philippine (Republic of) 9.1250 04/09/16 280,000,000 7,907 0.73Philippine (Republic of) 6.2500 27/01/14 688,500,000 17,473 1.62Philippine (Republic of) 5.2500 07/01/13 52,000,000 1,262 0.12Philippine (Republic of) 5.8750 19/08/15 60,000,000 1,548 0.14Philippine (Republic of) 7.0000 27/01/16 1,646,700,000 43,708 4.0674,686 6.9330 <strong>Aberdeen</strong> <strong>Global</strong> - Asian Local Currency Short Duration Bond
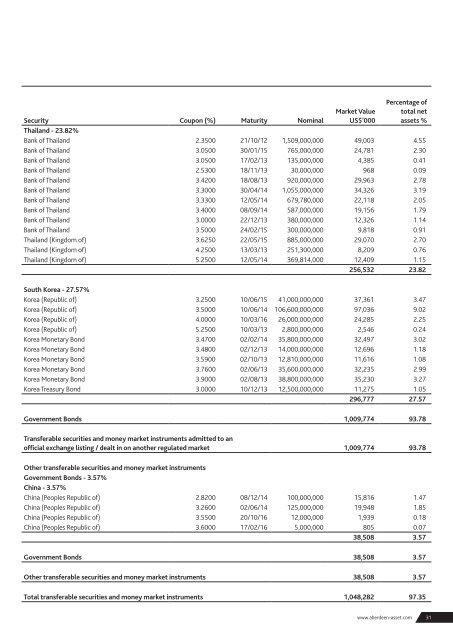
Market ValueUS$’000Percentage oftotal netassets %Security Coupon (%) Maturity NominalThailand - 23.82%Bank of Thailand 2.3500 21/10/12 1,509,000,000 49,003 4.55Bank of Thailand 3.0500 30/01/15 765,000,000 24,781 2.30Bank of Thailand 3.0500 17/02/13 135,000,000 4,385 0.41Bank of Thailand 2.5300 18/11/13 30,000,000 968 0.09Bank of Thailand 3.4200 18/08/13 920,000,000 29,963 2.78Bank of Thailand 3.3000 30/04/14 1,055,000,000 34,326 3.19Bank of Thailand 3.3300 12/05/14 679,780,000 22,118 2.05Bank of Thailand 3.4000 08/09/14 587,000,000 19,156 1.79Bank of Thailand 3.0000 22/12/13 380,000,000 12,326 1.14Bank of Thailand 3.5000 24/02/15 300,000,000 9,818 0.91Thailand (Kingdom of) 3.6250 22/05/15 885,000,000 29,070 2.70Thailand (Kingdom of) 4.2500 13/03/13 251,300,000 8,209 0.76Thailand (Kingdom of) 5.2500 12/05/14 369,814,000 12,409 1.15256,532 23.82South Korea - 27.57%Korea (Republic of) 3.2500 10/06/15 41,000,000,000 37,361 3.47Korea (Republic of) 3.5000 10/06/14 106,600,000,000 97,036 9.02Korea (Republic of) 4.0000 10/03/16 26,000,000,000 24,285 2.25Korea (Republic of) 5.2500 10/03/13 2,800,000,000 2,546 0.24Korea Monetary Bond 3.4700 02/02/14 35,800,000,000 32,497 3.02Korea Monetary Bond 3.4800 02/12/13 14,000,000,000 12,696 1.18Korea Monetary Bond 3.5900 02/10/13 12,810,000,000 11,616 1.08Korea Monetary Bond 3.7600 02/06/13 35,600,000,000 32,235 2.99Korea Monetary Bond 3.9000 02/08/13 38,800,000,000 35,230 3.27Korea Treasury Bond 3.0000 10/12/13 12,500,000,000 11,275 1.05296,777 27.57Government Bonds 1,009,774 93.78Transferable securities and money market instruments admitted to anofficial exchange listing / dealt in on another regulated market 1,009,774 93.78Other transferable securities and money market instrumentsGovernment Bonds - 3.57%China - 3.57%China (Peoples Republic of) 2.8200 08/12/14 100,000,000 15,816 1.47China (Peoples Republic of) 3.2600 02/06/14 125,000,000 19,948 1.85China (Peoples Republic of) 3.5500 20/10/16 12,000,000 1,939 0.18China (Peoples Republic of) 3.6000 17/02/16 5,000,000 805 0.0738,508 3.57Government Bonds 38,508 3.57Other transferable securities and money market instruments 38,508 3.57Total transferable securities and money market instruments 1,048,282 97.35www.aberdeen-asset.com31
- Page 2 and 3: ContentsIncorporation..............
- Page 5: Investment Manager’s ReviewInvest
- Page 8: NET ASSET VALUE HISTORY (CONTINUED)
- Page 13: FundBaseCurrency30.09.12%30.09.11%3
- Page 16: American EquityFor the year ended 3
- Page 19 and 20: Market ValueUS$’000Percentage oft
- Page 21 and 22: Statement of Net AssetsAs at 30 Sep
- Page 23: Market ValueUS$’000Percentage oft
- Page 26 and 27: Statement of Net AssetsAs at 30 Sep
- Page 28 and 29: Market ValueUS$’000Percentage oft
- Page 30 and 31: Asian Local Currency Short Duration
- Page 34 and 35: Financial derivative instruments -
- Page 36: Asian Property ShareFor the year en
- Page 40 and 41: Asian Smaller CompaniesFor the year
- Page 42: Portfolio StatementAs at 30 Septemb
- Page 45 and 46: Australasian EquityFor the year end
- Page 47 and 48: Portfolio StatementAs at 30 Septemb
- Page 49 and 50: Brazil BondFor the period from 15 J
- Page 52: Brazil EquityFor the period from 15
- Page 55 and 56: Market ValueUS$’000Percentage oft
- Page 57 and 58: Statement of Net AssetsAs at 30 Sep
- Page 59 and 60: Percentage ofSecurityQuantityMarket
- Page 61 and 62: Statement of Net AssetsAs at 30 Sep
- Page 63 and 64: Market Value€’000Percentage oft
- Page 65 and 66: Statement of Net AssetsAs at 30 Sep
- Page 67 and 68: Market ValueUS$’000Percentage oft
- Page 69 and 70: Percentage ofSecurity Coupon (%) Ma
- Page 71 and 72: Emerging Markets EquityFor the year
- Page 73 and 74: Portfolio StatementAs at 30 Septemb
- Page 75 and 76: Market ValueUS$’000Percentage oft
- Page 77 and 78: Emerging Markets Infrastructure Equ
- Page 79 and 80: Portfolio StatementAs at 30 Septemb
- Page 81 and 82: Market ValueUS$’000Percentage oft
- Page 83 and 84:
Emerging Markets Local Currency Bon
- Page 85 and 86:
Portfolio StatementAs at 30 Septemb
- Page 87 and 88:
Market ValueUS$’000Percentage oft
- Page 89 and 90:
UnrealisedGains/(Losses)US$’000Pe
- Page 91 and 92:
Statement of Net AssetsAs at 30 Sep
- Page 93 and 94:
Market ValueUS$’000Percentage oft
- Page 95 and 96:
Ethical World EquityFor the year en
- Page 97 and 98:
Portfolio StatementAs at 30 Septemb
- Page 99 and 100:
Percentage ofSecurityQuantityMarket
- Page 101 and 102:
Statement of Net AssetsAs at 30 Sep
- Page 103 and 104:
Percentage ofSecurityQuantityMarket
- Page 105 and 106:
Statement of Net AssetsAs at 30 Sep
- Page 107 and 108:
Percentage ofSecurityQuantityMarket
- Page 109 and 110:
Statement of Net AssetsAs at 30 Sep
- Page 111 and 112:
Market Value€’000Percentage oft
- Page 113 and 114:
Statement of Net AssetsAs at 30 Sep
- Page 115 and 116:
Market ValueUS$’000Percentage oft
- Page 117 and 118:
Statement of Net AssetsAs at 30 Sep
- Page 119 and 120:
Market ValueUS$’000Percentage oft
- Page 121 and 122:
Statement of Net AssetsAs at 30 Sep
- Page 123 and 124:
Market ValueJP¥’000Percentage of
- Page 125 and 126:
Japanese Smaller CompaniesFor the y
- Page 127 and 128:
Portfolio StatementAs at 30 Septemb
- Page 129 and 130:
Latin American EquityFor the year e
- Page 131 and 132:
Portfolio StatementAs at 30 Septemb
- Page 133 and 134:
Multi-Manager World EquityFor the p
- Page 135 and 136:
Portfolio StatementAs at 30 Septemb
- Page 137 and 138:
Statement of Net AssetsAs at 30 Sep
- Page 139 and 140:
Market ValueUS$’000Percentage oft
- Page 141 and 142:
Russian EquityFor the year ended 30
- Page 143 and 144:
Portfolio StatementAs at 30 Septemb
- Page 145 and 146:
Select Emerging Markets BondFor the
- Page 147 and 148:
Portfolio StatementAs at 30 Septemb
- Page 149 and 150:
Percentage ofSecurity Coupon (%) Ma
- Page 151 and 152:
Market ValueUS$’000Percentage oft
- Page 153 and 154:
Financial derivative instruments -
- Page 155 and 156:
Statement of Net AssetsAs at 30 Sep
- Page 157 and 158:
Percentage ofSecurity Coupon (%) Ma
- Page 159 and 160:
Market Value€’000Percentage oft
- Page 161 and 162:
UnrealisedGains/(Losses)€’000Pe
- Page 163 and 164:
Statement of Net AssetsAs at 30 Sep
- Page 165 and 166:
Market Value£’000Percentage ofto
- Page 167 and 168:
Market Value£’000Percentage ofto
- Page 169 and 170:
Market Value£’000Percentage ofto
- Page 171 and 172:
Financial derivative instruments -
- Page 173 and 174:
Statement of Net AssetsAs at 30 Sep
- Page 175 and 176:
Market Value£’000Percentage ofto
- Page 177 and 178:
Market Value£’000Percentage ofto
- Page 179 and 180:
Select Sterling Financials BondFor
- Page 181 and 182:
Portfolio StatementAs at 30 Septemb
- Page 183 and 184:
Technology EquityFor the year ended
- Page 185 and 186:
Portfolio StatementAs at 30 Septemb
- Page 187 and 188:
UK EquityFor the year ended 30 Sept
- Page 189 and 190:
Portfolio StatementAs at 30 Septemb
- Page 191 and 192:
Market Value£’000Percentage ofto
- Page 193 and 194:
Statement of Net AssetsAs at 30 Sep
- Page 195 and 196:
Market ValueUS$’000Percentage oft
- Page 197 and 198:
World Equity IncomeFor the year end
- Page 199 and 200:
Portfolio StatementAs at 30 Septemb
- Page 201 and 202:
Percentage ofSecurityQuantityMarket
- Page 203 and 204:
Statement of Net AssetsAs at 30 Sep
- Page 205 and 206:
SecurityQuantityMarket ValueUS$’0
- Page 207 and 208:
Statement of Net AssetsAs at 30 Sep
- Page 209 and 210:
Market ValueUS$’000Percentage oft
- Page 211 and 212:
Notes to the Financial Statements1
- Page 213 and 214:
3.3 B share classClass B shares are
- Page 215 and 216:
4.4 Domiciliary agent, registrar, p
- Page 217 and 218:
4.7 Operational expensesOperational
- Page 219 and 220:
Brazil Bond (expressed in USD unles
- Page 221 and 222:
Emerging Markets Smaller Companies
- Page 223 and 224:
Frontier Markets Equity (expressed
- Page 225 and 226:
Date Class D-2 Equalisation Distrib
- Page 227 and 228:
Fund Amount on Loan US$ Counterpart
- Page 229:
Fund Name ‘000Latin American Equi
- Page 232 and 233:
RISK MANAGEMENT CONTINUEDAberdeen G
- Page 234 and 235:
RISK MANAGEMENT CONTINUEDModel assu
- Page 236 and 237:
MANAGEMENT AND ADMINISTRATION CONTI
- Page 238 and 239:
General InformationFurther Informat
- Page 240:
Further InformationAberdeen GlobalA