Asian Local Currency Short Duration BondFor the year ended 30 September 2012PerformanceFor the year ended 30 September 2012, the value of the Asian LocalCurrency Short Duration Bond A – Income shares increased by 3.55%compared to an increase of 5.95% in the benchmark, the iBoxx Asia exJapan Sovereign 1-3 years Index.Source: Markit, Lipper, Mellon, Basis: total return, NAV to NAV, net of annual charges, grossincome reinvested, USD.Manager’s reviewShort-dated bonds registered gains in most local currency bondmarkets during the year under review, against the backdrop of anintensifying Eurozone crisis and anaemic US recovery. Central banks inAsia shifted focus towards cushioning economies from stiff globalheadwinds, as inflation concerns appeared to dissipate in the face ofmoderating growth. The export and manufacturing sectors, inparticular, came under pressure from waning demand in the West. Amarked deterioration in China’s data was also disconcerting, given theregion’s increasing reliance on mainland demand for not just rawcommodities but also intermediate products. Towards the period end,major central banks delivered long-awaited stimulus measures amid arapidly worsening global backdrop, with the US launching its thirdround of quantitative easing.During the period, Korean short-dated bonds and the wonoutperformed their regional counterparts as sentiment was supportedby the central bank’s easing bias. Fitch and Standard & Poor’s upgradedthe country’s long-term debt ratings, citing a favourable fiscal outlookand robust structural fundamentals. Elsewhere, markets in Indonesia,China, Thailand and India posted solid gains but bonds in Hong Kongand Singapore weakened in line with the flat performance of shortdatedUS Treasuries.Portfolio reviewThe Fund underperformed the benchmark. Our currency positioningdetracted from relative return, driven by the underweight to the won,overweight to the rupiah and lack of exposure to the Taiwan dollar. Thelosses outweighed the positive contribution from the overweight to theyuan. In contrast, our interest rate allocation boosted performance,particularly our overweight to Indonesia, Malaysia and Thailand.In portfolio activity, we sold out of Hong Kong and Singapore bonds,as yields had approached historical lows, and added to CNH bonds(offshore renminbi bonds), which offered better returns. Elsewhere,we cut exposure to Indonesian and Philippine bonds, preferring SouthKorea, Thailand and Malaysia. We also trimmed our rupiah holdings,along with the Philippine peso, rupee and Singapore dollar, in favourof the Hong Kong dollar, baht and won.OutlookPolicymakers’ short-term liquidity fixes have not addressedlonger-term structural flaws in major developed economies.In Spain, widespread protests and the threat of a Catalonianbreakaway underscore the risks in implementing tough austeritymeasures amid economic distress. Consumer demand in the Westcould remain weak for some time to come, and hence, we are unlikelyto see any meaningful recovery in Asian exports and industrialproduction over the short term. While China’s data have improved,we expect soft growth till the end of the year. With quantitative easingin the West, liquidity is fast returning to Asia, driven by yield-seekinginvestors. The volatile capital inflows could compound policychallenges for central banks, which are grappling with slowing growth.Most Asian currencies rose against the US dollar, driven by liquidityflows into regional equity markets. Aside from the won, the ringgit andpeso also outperformed owing to supportive macroeconomicfundamentals. But the rupiah lagged on concerns over a deterioratingcurrent account deficit. Indonesia’s central bank appeared to prefercurrency weakness, rather than policy rate adjustments, to address thetrade deficit.28 <strong>Aberdeen</strong> <strong>Global</strong> - Asian Local Currency Short Duration Bond
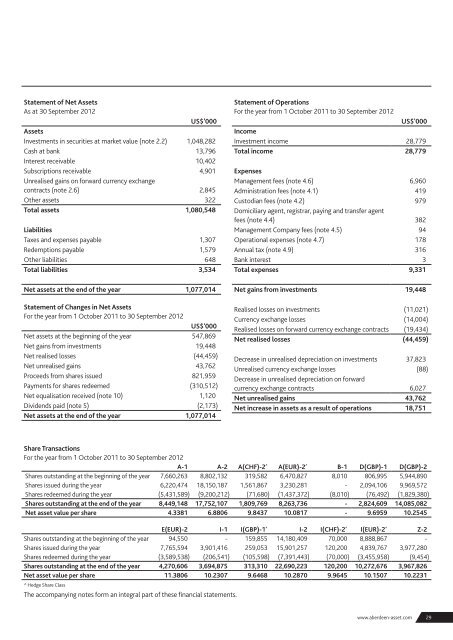
Statement of Net AssetsAs at 30 September 2012US$’000AssetsInvestments in securities at market value (note 2.2) 1,048,282Cash at bank 13,796Interest receivable 10,402Subscriptions receivable 4,901Unrealised gains on forward currency exchangecontracts (note 2.6) 2,845Other assets 322Total assets 1,080,548LiabilitiesTaxes and expenses payable 1,307Redemptions payable 1,579Other liabilities 648Total liabilities 3,534Net assets at the end of the year 1,077,014Statement of Changes in Net AssetsFor the year from 1 October 2011 to 30 September 2012US$'000Net assets at the beginning of the year 547,869Net gains from investments 19,448Net realised losses (44,459)Net unrealised gains 43,762Proceeds from shares issued 821,959Payments for shares redeemed (310,512)Net equalisation received (note 10) 1,120Dividends paid (note 5) (2,173)Net assets at the end of the year 1,077,014Statement of OperationsFor the year from 1 October 2011 to 30 September 2012US$'000IncomeInvestment income 28,779Total income 28,779ExpensesManagement fees (note 4.6) 6,960Administration fees (note 4.1) 419Custodian fees (note 4.2) 979Domiciliary agent, registrar, paying and transfer agentfees (note 4.4) 382Management Company fees (note 4.5) 94Operational expenses (note 4.7) 178Annual tax (note 4.9) 316Bank interest 3Total expenses 9,331Net gains from investments 19,448Realised losses on investments (11,021)Currency exchange losses (14,004)Realised losses on forward currency exchange contracts (19,434)Net realised losses (44,459)Decrease in unrealised depreciation on investments 37,823Unrealised currency exchange losses (88)Decrease in unrealised depreciation on forwardcurrency exchange contracts 6,027Net unrealised gains 43,762Net increase in assets as a result of operations 18,751Share TransactionsFor the year from 1 October 2011 to 30 September 2012A-1 A-2 A(CHF)-2^ A(EUR)-2^ B-1 D(GBP)-1 D(GBP)-2Shares outstanding at the beginning of the year 7,660,263 8,802,132 319,582 6,470,827 8,010 806,995 5,944,890Shares issued during the year 6,220,474 18,150,187 1,561,867 3,230,281 - 2,094,106 9,969,572Shares redeemed during the year (5,431,589) (9,200,212) (71,680) (1,437,372) (8,010) (76,492) (1,829,380)Shares outstanding at the end of the year 8,449,148 17,752,107 1,809,769 8,263,736 - 2,824,609 14,085,082Net asset value per share 4.3381 6.8806 9.8437 10.0817 - 9.6959 10.2545E(EUR)-2 I-1 I(GBP)-1^ I-2 I(CHF)-2^ I(EUR)-2^ Z-2Shares outstanding at the beginning of the year 94,550 - 159,855 14,180,409 70,000 8,888,867 -Shares issued during the year 7,765,594 3,901,416 259,053 15,901,257 120,200 4,839,767 3,977,280Shares redeemed during the year (3,589,538) (206,541) (105,598) (7,391,443) (70,000) (3,455,958) (9,454)Shares outstanding at the end of the year 4,270,606 3,694,875 313,310 22,690,223 120,200 10,272,676 3,967,826Net asset value per share 11.3806 10.2307 9.6468 10.2870 9.9645 10.1507 10.2231^ Hedge Share ClassThe accompanying notes form an integral part of these financial statements.www.aberdeen-asset.com29
- Page 2 and 3: ContentsIncorporation..............
- Page 5: Investment Manager’s ReviewInvest
- Page 8: NET ASSET VALUE HISTORY (CONTINUED)
- Page 13: FundBaseCurrency30.09.12%30.09.11%3
- Page 16: American EquityFor the year ended 3
- Page 19 and 20: Market ValueUS$’000Percentage oft
- Page 21 and 22: Statement of Net AssetsAs at 30 Sep
- Page 23: Market ValueUS$’000Percentage oft
- Page 26 and 27: Statement of Net AssetsAs at 30 Sep
- Page 28 and 29: Market ValueUS$’000Percentage oft
- Page 32 and 33: Portfolio StatementAs at 30 Septemb
- Page 34 and 35: Financial derivative instruments -
- Page 36: Asian Property ShareFor the year en
- Page 40 and 41: Asian Smaller CompaniesFor the year
- Page 42: Portfolio StatementAs at 30 Septemb
- Page 45 and 46: Australasian EquityFor the year end
- Page 47 and 48: Portfolio StatementAs at 30 Septemb
- Page 49 and 50: Brazil BondFor the period from 15 J
- Page 52: Brazil EquityFor the period from 15
- Page 55 and 56: Market ValueUS$’000Percentage oft
- Page 57 and 58: Statement of Net AssetsAs at 30 Sep
- Page 59 and 60: Percentage ofSecurityQuantityMarket
- Page 61 and 62: Statement of Net AssetsAs at 30 Sep
- Page 63 and 64: Market Value€’000Percentage oft
- Page 65 and 66: Statement of Net AssetsAs at 30 Sep
- Page 67 and 68: Market ValueUS$’000Percentage oft
- Page 69 and 70: Percentage ofSecurity Coupon (%) Ma
- Page 71 and 72: Emerging Markets EquityFor the year
- Page 73 and 74: Portfolio StatementAs at 30 Septemb
- Page 75 and 76: Market ValueUS$’000Percentage oft
- Page 77 and 78: Emerging Markets Infrastructure Equ
- Page 79 and 80: Portfolio StatementAs at 30 Septemb
- Page 81 and 82:
Market ValueUS$’000Percentage oft
- Page 83 and 84:
Emerging Markets Local Currency Bon
- Page 85 and 86:
Portfolio StatementAs at 30 Septemb
- Page 87 and 88:
Market ValueUS$’000Percentage oft
- Page 89 and 90:
UnrealisedGains/(Losses)US$’000Pe
- Page 91 and 92:
Statement of Net AssetsAs at 30 Sep
- Page 93 and 94:
Market ValueUS$’000Percentage oft
- Page 95 and 96:
Ethical World EquityFor the year en
- Page 97 and 98:
Portfolio StatementAs at 30 Septemb
- Page 99 and 100:
Percentage ofSecurityQuantityMarket
- Page 101 and 102:
Statement of Net AssetsAs at 30 Sep
- Page 103 and 104:
Percentage ofSecurityQuantityMarket
- Page 105 and 106:
Statement of Net AssetsAs at 30 Sep
- Page 107 and 108:
Percentage ofSecurityQuantityMarket
- Page 109 and 110:
Statement of Net AssetsAs at 30 Sep
- Page 111 and 112:
Market Value€’000Percentage oft
- Page 113 and 114:
Statement of Net AssetsAs at 30 Sep
- Page 115 and 116:
Market ValueUS$’000Percentage oft
- Page 117 and 118:
Statement of Net AssetsAs at 30 Sep
- Page 119 and 120:
Market ValueUS$’000Percentage oft
- Page 121 and 122:
Statement of Net AssetsAs at 30 Sep
- Page 123 and 124:
Market ValueJP¥’000Percentage of
- Page 125 and 126:
Japanese Smaller CompaniesFor the y
- Page 127 and 128:
Portfolio StatementAs at 30 Septemb
- Page 129 and 130:
Latin American EquityFor the year e
- Page 131 and 132:
Portfolio StatementAs at 30 Septemb
- Page 133 and 134:
Multi-Manager World EquityFor the p
- Page 135 and 136:
Portfolio StatementAs at 30 Septemb
- Page 137 and 138:
Statement of Net AssetsAs at 30 Sep
- Page 139 and 140:
Market ValueUS$’000Percentage oft
- Page 141 and 142:
Russian EquityFor the year ended 30
- Page 143 and 144:
Portfolio StatementAs at 30 Septemb
- Page 145 and 146:
Select Emerging Markets BondFor the
- Page 147 and 148:
Portfolio StatementAs at 30 Septemb
- Page 149 and 150:
Percentage ofSecurity Coupon (%) Ma
- Page 151 and 152:
Market ValueUS$’000Percentage oft
- Page 153 and 154:
Financial derivative instruments -
- Page 155 and 156:
Statement of Net AssetsAs at 30 Sep
- Page 157 and 158:
Percentage ofSecurity Coupon (%) Ma
- Page 159 and 160:
Market Value€’000Percentage oft
- Page 161 and 162:
UnrealisedGains/(Losses)€’000Pe
- Page 163 and 164:
Statement of Net AssetsAs at 30 Sep
- Page 165 and 166:
Market Value£’000Percentage ofto
- Page 167 and 168:
Market Value£’000Percentage ofto
- Page 169 and 170:
Market Value£’000Percentage ofto
- Page 171 and 172:
Financial derivative instruments -
- Page 173 and 174:
Statement of Net AssetsAs at 30 Sep
- Page 175 and 176:
Market Value£’000Percentage ofto
- Page 177 and 178:
Market Value£’000Percentage ofto
- Page 179 and 180:
Select Sterling Financials BondFor
- Page 181 and 182:
Portfolio StatementAs at 30 Septemb
- Page 183 and 184:
Technology EquityFor the year ended
- Page 185 and 186:
Portfolio StatementAs at 30 Septemb
- Page 187 and 188:
UK EquityFor the year ended 30 Sept
- Page 189 and 190:
Portfolio StatementAs at 30 Septemb
- Page 191 and 192:
Market Value£’000Percentage ofto
- Page 193 and 194:
Statement of Net AssetsAs at 30 Sep
- Page 195 and 196:
Market ValueUS$’000Percentage oft
- Page 197 and 198:
World Equity IncomeFor the year end
- Page 199 and 200:
Portfolio StatementAs at 30 Septemb
- Page 201 and 202:
Percentage ofSecurityQuantityMarket
- Page 203 and 204:
Statement of Net AssetsAs at 30 Sep
- Page 205 and 206:
SecurityQuantityMarket ValueUS$’0
- Page 207 and 208:
Statement of Net AssetsAs at 30 Sep
- Page 209 and 210:
Market ValueUS$’000Percentage oft
- Page 211 and 212:
Notes to the Financial Statements1
- Page 213 and 214:
3.3 B share classClass B shares are
- Page 215 and 216:
4.4 Domiciliary agent, registrar, p
- Page 217 and 218:
4.7 Operational expensesOperational
- Page 219 and 220:
Brazil Bond (expressed in USD unles
- Page 221 and 222:
Emerging Markets Smaller Companies
- Page 223 and 224:
Frontier Markets Equity (expressed
- Page 225 and 226:
Date Class D-2 Equalisation Distrib
- Page 227 and 228:
Fund Amount on Loan US$ Counterpart
- Page 229:
Fund Name ‘000Latin American Equi
- Page 232 and 233:
RISK MANAGEMENT CONTINUEDAberdeen G
- Page 234 and 235:
RISK MANAGEMENT CONTINUEDModel assu
- Page 236 and 237:
MANAGEMENT AND ADMINISTRATION CONTI
- Page 238 and 239:
General InformationFurther Informat
- Page 240:
Further InformationAberdeen GlobalA