- Page 2:
Gene Function Analysis
- Page 6:
METHODS IN MOLECULAR BIOLOGYGene Fu
- Page 12:
PrefaceThis volume of Methods in Mo
- Page 16:
Prefaceixcolleagues demonstrate how
- Page 20:
xiiContentsPART III EXPERIMENTAL ME
- Page 26:
ICOMPUTATIONAL METHODS I
- Page 34:
4 BidautTable 1Input File Format Us
- Page 38:
6 BidautTable 2Folder Layout to Use
- Page 42:
8 Bidaut• alphaA: this is the num
- Page 46:
10 Bidautcomputing the maximum corr
- Page 50:
12 BidautFig. 3. The complete Clutr
- Page 54:
Table 3Some Identified Patterns (5,
- Page 58:
16 BidautFig. 4. This is a comparis
- Page 62:
18 BidautReferences1. Hughes, T. R.
- Page 66:
20 Kirov et al.way to associate gen
- Page 70:
22 Kirov et al.based on a study ass
- Page 74:
24 Kirov et al.1. Retrieve the gene
- Page 78:
26Fig. 1. Functional associations f
- Page 82:
28 Kirov et al.Fig. 2. Pathway anal
- Page 86:
30 Kirov et al.3. Gene symbols usag
- Page 90:
32 Kirov et al.9. OBO_Team, Open Bi
- Page 94:
3Estimating Gene Function With Leas
- Page 98:
Estimating Gene Function With LS-NM
- Page 102:
Estimating Gene Function With LS-NM
- Page 106:
Estimating Gene Function With LS-NM
- Page 110:
Estimating Gene Function With LS-NM
- Page 114:
Estimating Gene Function With LS-NM
- Page 118:
Estimating Gene Function With LS-NM
- Page 122:
50 Gonye et al.activity and problem
- Page 126:
52 Gonye et al.Currently, PAINT can
- Page 130:
54 Gonye et al.dynamic nature of th
- Page 136:
Prediction Using PAINT 57represente
- Page 140:
Prediction Using PAINT 59In PAINT,
- Page 144:
Prediction Using PAINT 6114. On the
- Page 148:
Prediction Using PAINT 634.2. Size
- Page 152:
65Fig. 4. Localization of enrichmen
- Page 156:
Prediction Using PAINT 673. Okubo,
- Page 160:
5Prediction of Intrinsic Disorder a
- Page 164:
Prediction of ID and Its Use in Fun
- Page 168:
Table 1Summary of the Web Servers O
- Page 172:
Prediction of ID and Its Use in Fun
- Page 176:
Prediction of ID and Its Use in Fun
- Page 180:
Prediction of ID and Its Use in Fun
- Page 184:
Prediction of ID and Its Use in Fun
- Page 188:
Prediction of ID and Its Use in Fun
- Page 192:
Prediction of ID and Its Use in Fun
- Page 196:
Prediction of ID and Its Use in Fun
- Page 200:
Prediction of ID and Its Use in Fun
- Page 204:
Prediction of ID and Its Use in Fun
- Page 208:
IICOMPUTATIONAL METHODS II
- Page 212:
94 Crabtree et al.genomes, which is
- Page 216:
96 Crabtree et al.Fig. 2. Sybil pro
- Page 220:
98 Crabtree et al.Fig. 3. Computing
- Page 224:
100 Crabtree et al.3.1.5.1. FILTER
- Page 228:
102 Crabtree et al.3. For the sake
- Page 232:
104 Crabtree et al.Fig. 5. Best bid
- Page 236:
106 Crabtree et al.17. Some cluster
- Page 240:
108 Crabtree et al.19. Chado—The
- Page 244:
110 Dateproducts prevents the under
- Page 248:
112 DateDetails of these tasks are
- Page 252:
114 DateThis step creates additiona
- Page 256:
116 Date>hsapiens|gi|20093443 >hsap
- Page 260:
118 DateBLAST score from the match
- Page 264:
Table 1A Sample of Results From Pro
- Page 268:
122 DateFig. 1. A network of functi
- Page 272:
124 Datedescribed by Verjovsky Marc
- Page 276:
126 Dateor contracts put forth by t
- Page 280:
8Bioinformatics Tools for Modeling
- Page 284:
Modeling Transcription Factor Targe
- Page 288:
VISTA Program to search for TFBSs H
- Page 292:
Modeling Transcription Factor Targe
- Page 296:
Modeling Transcription Factor Targe
- Page 300:
Modeling Transcription Factor Targe
- Page 304:
Modeling Transcription Factor Targe
- Page 308:
Ac 0 0 0 1 0 1 0 1 0 1 1 0 0 0 0 0
- Page 312: Modeling Transcription Factor Targe
- Page 316: Modeling Transcription Factor Targe
- Page 320: Modeling Transcription Factor Targe
- Page 324: Modeling Transcription Factor Targe
- Page 328: 154 Osborne et al.are included in t
- Page 332: 156 Osborne et al.Fig. 2. Flowchart
- Page 336: 158 Osborne et al.UMLS source abbre
- Page 340: 160 Osborne et al.Fig. 3. Querying
- Page 344: 162 Osborne et al.3.4.2. Installati
- Page 348: 164 Osborne et al.amount of filteri
- Page 352: 166 Osborne et al.public class MMTx
- Page 356: 168 Osborne et al.Fig. 4. Input tes
- Page 360: 10Statistical Methods for Identifyi
- Page 366: 174 Ho et al.allowing for cases whe
- Page 370: 176 Ho et al.A different measure is
- Page 374: 178 Ho et al.3.1.3. LA and Generali
- Page 378: 180 Ho et al.The ECF-statistic can
- Page 382: 182 Ho et al.In the special case of
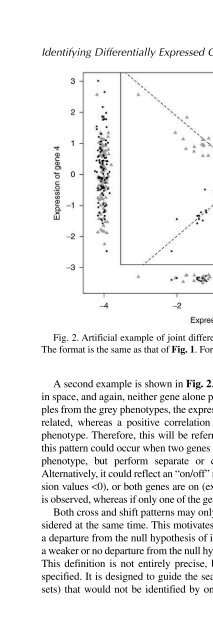
- Page 386: 184 Ho et al.Fig. 5. An illustratio
- Page 390: 186 Ho et al.Fig. 7. The power curv
- Page 394: 188 Ho et al.this section were not
- Page 398: 190 Ho et al.References1. Schena, M
- Page 402: IIIEXPERIMENTAL METHODS
- Page 406: 194 Caldwell et al.for sequences th
- Page 410: 196 Caldwell et al.query because it
- Page 414:
198 Caldwell et al.Fig. 1. (A) Prot
- Page 418:
200 Caldwell et al.outside primer o
- Page 422:
202 Caldwell et al.5. Targeting scr
- Page 426:
204 Caldwell et al.will allow the s
- Page 430:
206 Caldwell et al.3.1.6. Plasmid P
- Page 434:
208 Caldwell et al.PCR amplify the
- Page 438:
210 Caldwell et al.8. Thawing cells
- Page 442:
212 Zhang et al.Going one step beyo
- Page 446:
214 Zhang et al.Fig. 2. Generation
- Page 450:
216 Zhang et al.Perform PCR cycles,
- Page 454:
218 Zhang et al.Fig. 4. Schematic m
- Page 458:
220 Zhang et al.Fig. 5. Replacement
- Page 462:
13Construction of Simple and Effici
- Page 466:
DNA Vector-Based shRNA-Expression S
- Page 470:
DNA Vector-Based shRNA-Expression S
- Page 474:
DNA Vector-Based shRNA-Expression S
- Page 478:
DNA Vector-Based shRNA-Expression S
- Page 482:
DNA Vector-Based shRNA-Expression S
- Page 486:
DNA Vector-Based shRNA-Expression S
- Page 490:
DNA Vector-Based shRNA-Expression S
- Page 494:
DNA Vector-Based shRNA-Expression S
- Page 498:
DNA Vector-Based shRNA-Expression S
- Page 502:
244 Hust et al.overcome by two appr
- Page 506:
246 Hust et al.Fig. 1. Schematic de
- Page 510:
248 Hust et al.interaction during p
- Page 514:
250 Hust et al.3.4. Titering1. Inoc
- Page 518:
252 Hust et al.10. Shortly before u
- Page 522:
254 Hust et al.activity by preservi
- Page 526:
15A Bacterial/Yeast Merged Two-Hybr
- Page 530:
Screening in Yeast With a Bacterial
- Page 534:
Screening in Yeast With a Bacterial
- Page 538:
Screening in Yeast With a Bacterial
- Page 542:
Screening in Yeast With a Bacterial
- Page 546:
Screening in Yeast With a Bacterial
- Page 550:
Screening in Yeast With a Bacterial
- Page 554:
Screening in Yeast With a Bacterial
- Page 558:
Screening in Yeast With a Bacterial
- Page 562:
Screening in Yeast With a Bacterial
- Page 566:
Screening in Yeast With a Bacterial
- Page 570:
Screening in Yeast With a Bacterial
- Page 574:
Screening in Yeast With a Bacterial
- Page 578:
Screening in Yeast With a Bacterial
- Page 582:
Screening in Yeast With a Bacterial
- Page 586:
Screening in Yeast With a Bacterial
- Page 590:
Screening in Yeast With a Bacterial
- Page 594:
16A Bacterial/Yeast Merged Two-Hybr
- Page 598:
Dual Bait-Compatible Bacterial Two-
- Page 602:
Dual Bait-Compatible Bacterial Two-
- Page 606:
Dual Bait-Compatible Bacterial Two-
- Page 610:
Dual Bait-Compatible Bacterial Two-
- Page 614:
Dual Bait-Compatible Bacterial Two-
- Page 618:
Dual Bait-Compatible Bacterial Two-
- Page 622:
Dual Bait-Compatible Bacterial Two-
- Page 626:
Dual Bait-Compatible Bacterial Two-
- Page 630:
Dual Bait-Compatible Bacterial Two-
- Page 634:
Dual Bait-Compatible Bacterial Two-
- Page 638:
Dual Bait-Compatible Bacterial Two-
- Page 642:
Dual Bait-Compatible Bacterial Two-
- Page 646:
318 Thibodeau-Beganny and Joungbeen
- Page 650:
320 Thibodeau-Beganny and JoungFig.
- Page 654:
322 Thibodeau-Beganny and JoungFig.
- Page 658:
324 Thibodeau-Beganny and JoungTypi
- Page 662:
326 Thibodeau-Beganny and JoungFig.
- Page 666:
328 Thibodeau-Beganny and JoungPCR
- Page 670:
330 Thibodeau-Beganny and Joung16-1
- Page 674:
332 Thibodeau-Beganny and Joung2. P
- Page 678:
334 Thibodeau-Beganny and Joung11.
- Page 682:
336 IndexKknockin (gene knockin) 19