Sandra Hopkins Final Report.pdf - University of Surrey
Sandra Hopkins Final Report.pdf - University of Surrey
Sandra Hopkins Final Report.pdf - University of Surrey

Create successful ePaper yourself
Turn your PDF publications into a flip-book with our unique Google optimized e-Paper software.
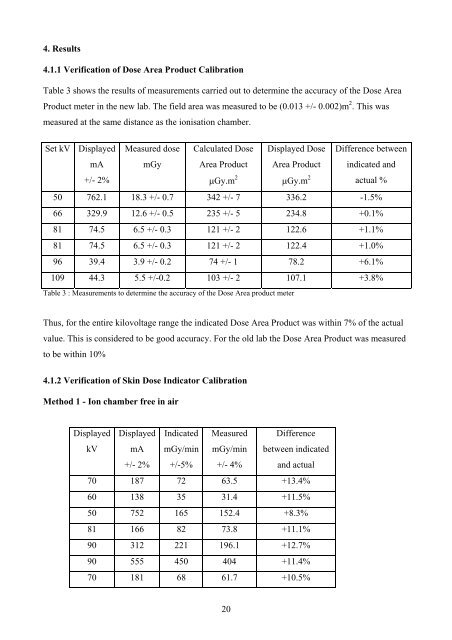
4. Results4.1.1 Verification <strong>of</strong> Dose Area Product CalibrationTable 3 shows the results <strong>of</strong> measurements carried out to determine the accuracy <strong>of</strong> the Dose AreaProduct meter in the new lab. The field area was measured to be (0.013 +/- 0.002)m 2 . This wasmeasured at the same distance as the ionisation chamber.Set kV DisplayedmA+/- 2%Measured dosemGyCalculated DoseArea ProductµGy.m 2Displayed DoseArea ProductµGy.m 2Difference betweenindicated andactual %50 762.1 18.3 +/- 0.7 342 +/- 7 336.2 -1.5%66 329.9 12.6 +/- 0.5 235 +/- 5 234.8 +0.1%81 74.5 6.5 +/- 0.3 121 +/- 2 122.6 +1.1%81 74.5 6.5 +/- 0.3 121 +/- 2 122.4 +1.0%96 39.4 3.9 +/- 0.2 74 +/- 1 78.2 +6.1%109 44.3 5.5 +/-0.2 103 +/- 2 107.1 +3.8%Table 3 : Measurements to determine the accuracy <strong>of</strong> the Dose Area product meterThus, for the entire kilovoltage range the indicated Dose Area Product was within 7% <strong>of</strong> the actualvalue. This is considered to be good accuracy. For the old lab the Dose Area Product was measuredto be within 10%4.1.2 Verification <strong>of</strong> Skin Dose Indicator CalibrationMethod 1 - Ion chamber free in airDisplayedkVDisplayedmA+/- 2%IndicatedmGy/min+/-5%MeasuredmGy/min+/- 4%Differencebetween indicatedand actual70 187 72 63.5 +13.4%60 138 35 31.4 +11.5%50 752 165 152.4 +8.3%81 166 82 73.8 +11.1%90 312 221 196.1 +12.7%90 555 450 404 +11.4%70 181 68 61.7 +10.5%20