Sandra Hopkins Final Report.pdf - University of Surrey
Sandra Hopkins Final Report.pdf - University of Surrey
Sandra Hopkins Final Report.pdf - University of Surrey

You also want an ePaper? Increase the reach of your titles
YUMPU automatically turns print PDFs into web optimized ePapers that Google loves.
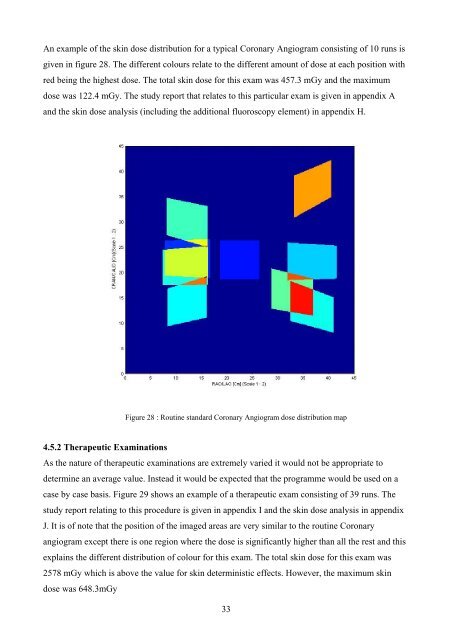
An example <strong>of</strong> the skin dose distribution for a typical Coronary Angiogram consisting <strong>of</strong> 10 runs isgiven in figure 28. The different colours relate to the different amount <strong>of</strong> dose at each position withred being the highest dose. The total skin dose for this exam was 457.3 mGy and the maximumdose was 122.4 mGy. The study report that relates to this particular exam is given in appendix Aand the skin dose analysis (including the additional fluoroscopy element) in appendix H.Figure 28 : Routine standard Coronary Angiogram dose distribution map4.5.2 Therapeutic ExaminationsAs the nature <strong>of</strong> therapeutic examinations are extremely varied it would not be appropriate todetermine an average value. Instead it would be expected that the programme would be used on acase by case basis. Figure 29 shows an example <strong>of</strong> a therapeutic exam consisting <strong>of</strong> 39 runs. Thestudy report relating to this procedure is given in appendix I and the skin dose analysis in appendixJ. It is <strong>of</strong> note that the position <strong>of</strong> the imaged areas are very similar to the routine Coronaryangiogram except there is one region where the dose is significantly higher than all the rest and thisexplains the different distribution <strong>of</strong> colour for this exam. The total skin dose for this exam was2578 mGy which is above the value for skin deterministic effects. However, the maximum skindose was 648.3mGy33