Tracking Financial Performance Standards of ... - Sa-Dhan
Tracking Financial Performance Standards of ... - Sa-Dhan
Tracking Financial Performance Standards of ... - Sa-Dhan
- No tags were found...

You also want an ePaper? Increase the reach of your titles
YUMPU automatically turns print PDFs into web optimized ePapers that Google loves.
TECHNICAL TOOL SERIES 1TRACKING FINANCIALPERFORMANCE STANDARDS OFMICROFINANCE INSTITUTIONS :AN OPERATIONAL MANNUAL<strong>Sa</strong>-<strong>Dhan</strong>The Association <strong>of</strong>Community DevelopmentFinance Institutions
© Copyright reserved <strong>Sa</strong>-<strong>Dhan</strong>August2003Published by :<strong>Sa</strong>-<strong>Dhan</strong> - The Association <strong>of</strong> Community Development Finance Institutions12 & 13, 2nd Floor, Special Institutional AreaShaheed Jeet Singh Marg, New Delhi-110 067e-mail : sa_dhan@mantraonline.comWebsite : www.sa-dhan.orgTypeset by :<strong>Sa</strong>hara RenewalPrinted in India by :<strong>Sa</strong>hara RenewalJacket Design by :Neelima Rao
INTRODUCTION TOMICROFINANCE STANDARDS
CONTENTSFOREWORD _________________________________________________________________________ IACKNOWLEDGEMENT _______________________________________________________________ IPREFACE ___________________________________________________________________________IIISTRUCTURE OF THE MANUAL _______________________________________________________ IV1. INTRODUCTION TO MICROFINANCE STANDARDS _______________________________ 11.1 BACKGROUND ____________________________________________________________ 11.2 WHY IS THERE SO MUCH TALK ABOUT STANDARDS? ______________________________________ 11.3 HOW ARE MICROFINANCE STANDARDS DEVELOPED? _____________________________________ 31.3.1 Donor-led efforts ______________________________________________________ 31.3.2 Private sector-led efforts _________________________________________________ 31.3.3 MFI-led efforts _______________________________________________________ 41.4 SA-DHAN’S APPROACH TOWARDS BUILDING STANDARDS __________________________________ 51.4.1 Process Governing the Development <strong>of</strong> <strong>Standards</strong> _______________________________ 51.4.2 Strategy for Development <strong>of</strong> <strong>Standards</strong> _______________________________________ 51.4.3 Process Agreed for the Introduction <strong>of</strong> <strong>Standards</strong> for Indian MFIs ___________________ 61.5 CONCLUSION ________________________________________________________________ 62. FINANCIAL PERFORMANCE STANDARDS ________________________________________ 92.1 SPECIFIC FINANCIAL ASPECTS THAT TOGETHER DEFINE FINANCIAL PERFORMANCE _________________ 92.2 FINANCIAL PERFORMANCE INDICATORS _____________________________________________ 102.3 UNIFORM METHODOLOGY FOR CALCULATING INDICATORS _______________________________ 112.4 BENCHMARKS FOR FINANCIAL PERFORMANCE INDICATORS, LEADING TO STANDARDS _____________ 112.5 SA-DHAN RECOMMENDED MINIMUM FINANCIAL PERFORMANCE STANDARDS __________________ 123 FINANCIAL STATEMENTS OF A MICROFINANCE INSTITUTION ___________________ 173.1 INTRODUCTION ___________________________________________________________ 173.2 INCOME AND EXPENDITURE STATEMENT - KEY DEFINITIONS & INTERPRETATIONS ______________ 213.2.1 Income ___________________________________________________________ 213.2.2 Expenses ___________________________________________________________ 233.2.3 Treatment <strong>of</strong> Donor Grants ______________________________________________ 263.3 BALANCE SHEET - KEY DEFINITIONS AND INTERPRETATIONS ______________________________ 283.3.1 Source <strong>of</strong> Fund - Liabilities and Net Worth __________________________________ 283.3.2 Application <strong>of</strong> Fund - Assets _____________________________________________ 303.4 COST ALLOCATION - KEY ISSUES FOR PREPARING FINANCIAL STATEMNETS ____________________ 354. CONSTRUCTING LOAN REPAYMENT SCHEDULE, AGING SCHEDULE AND LOANPORTFOLIO REPORT FOR AN MFI_______________________________________________ 414.1 LOAN LEDGER AND REPAYMENT SCHEDULE __________________________________________ 414.2 ACCOUNTING FOR LOAN LOSSES - KEY ISSUES FOR STANDARD SETTING ______________________ 504.2.1 Allowances for Loan Losses ______________________________________________ 504.2.2 Calculating Loan Loss using Aging Analysis __________________________________ 514.2.3 Accounting Entries for Loan Loss Provision, Loan Loss Reserve and Write-<strong>of</strong>fs __________ 534.3 LOAN PORTFOLIO REPORT - KEY DEFINITIONS & INTERPRETATIONS ________________________ 57
5. PERFORMANCE STANDARDS - CONCEPT, DEFINITIONS, CALCULATION ANDMETHODOLOGICAL ISSUES ____________________________________________________635.1. ASSET QUALITY STANDARDS _____________________________________________________ 635.1.1 Portfolio At Risk ______________________________________________________ 645.1.2 Current Repayment Rate ________________________________________________ 765.2 EFFCIENCY AND PRODUCTIVITY STANDARDS __________________________________________ 795.2.1. Operating Cost Ratio __________________________________________________ 805.2.2 Total Cost Raio_______________________________________________________ 835.2.3 Active Borrowers Per Credit Officer ________________________________________ 875.3 FINANCIAL VIABILITY STANDARDS _________________________________________________ 90LIST OF ANNEXURES5.3.1 Operating Self-Sufficiency _______________________________________________ 911 PERFORMANCE INDICATORS FOR MICROFINANCE INSTITUTIONS :SOME POPULAR TOOLS USED WORLDWIDE __________________________________________ 972 GLOSSARY OF FINANCIAL TERMS _________________________________________________ 105REFERENCES ______________________________________________________________________133LIST OF TABLESTABLE 1 : COMMON MEASURES OF FINANCIAL PERFORMANCE USED BY DIFFERENT AGENCIES _________ 10TABLE 2 : MICRO BANKING BULLETIN PEER GROUP CRITERIA______________________________ 11TABLE 3 : SOME ILLUSTRATIVE PERFORMANCE BENCHMARKS _______________________________ 12TABLE 4 : SA-DHAN’S MINIMUM STANDARDS WITH INDICATORS AND VALUES ___________________ 13TABLE 5 : FINANCIAL STATEMENTS AND WHAT DOES IT CONVEYS ____________________________ 17TABLE 6 : FINANCIAL STATEMENTS AND POSSIBLE ANALYSIS ________________________________ 18TABLE 7(A) : CONVENTIONAL INCOME & EXPENSE STATEMENT OF AN MFI ____________________ 19TABLE 7(B) : CONVENTIONAL BALANCE SHEET OF AN MFI _______________________________ 19TABLE 8(A) : SAMPLE INCOME & EXPENDITURE STATEMENT OF AN MFI ______________________ 20TABLE 8(B) : SAMPLE INCOME & BALANCE SHEET OF AN MFI _____________________________ 27TABLE 9 : LOAN REPAYMENT SCHEDULE WITH FLAT RATE OF INTEREST _______________________ 42TABLE 10 : LOAN REPAYMENT SCHEDULE WITH DECLINING INTEREST ________________________ 48TABLE 11 : LOAN REPAYMENT SCHEDULE USING EMI METHOD ____________________________ 48TABLE 12 : SUMMARY FORMAT OF REPAYMENT SCHEDULE ________________________________ 49TABLE 13 : SAMPLE PORTFOLIO REPORT_____________________________________________ 57TABLE 14 : PROCESS FOR COMPUTING AVERAGE LOAN OUTSTANDING ________________________ 82
FOREWORDThe recent emerging trend in the Micr<strong>of</strong>inance industry in India has led to a greater emphasis ontransparency and financial viability <strong>of</strong> Micr<strong>of</strong>inance Institutions (MFIs). This trend is not uncommonfor any nascent and growing industry. An important aspect <strong>of</strong> this trend has been greater focus onfinancial and institutional indicators to measure the impact and performance <strong>of</strong> MFIs. However, it is hardto achieve transparency and viability sans standard (uniform) measures to assess financial condition, impactand performance. It is also recoginsed that the development <strong>of</strong> standards also contributes in building groundto take the sector towards self-regulation.A variety <strong>of</strong> measurements have been used globally to measure MFIs’ performance, many <strong>of</strong> which havebeen recognized as standard indicators. A closer look at these measures reveal that these indicators arebeing calculated and applied in many different ways. To overcome this issue, <strong>Sa</strong>-<strong>Dhan</strong> – The Association<strong>of</strong> Community Development Finance Institutions initiated the process <strong>of</strong> development <strong>of</strong> minimumsectoral standards for the Indian Micr<strong>of</strong>inance industry, ever since its inception (1998). <strong>Sa</strong>-<strong>Dhan</strong>, throughits sub-group on standards has finally arrived at financial performance standards for Indian MFIs, througha series <strong>of</strong> consultative meetings.Setting standard indicators and procedures is quite a complex and uphill task, especially when it comes toarriving at standards through the consensus mode. Much <strong>of</strong> that had been experienced by <strong>Sa</strong>-<strong>Dhan</strong>, whichhad followed the same route <strong>of</strong> consensus building to get wider acceptability. Given the diversity in operatingmodels, geographical features, local economy & infrastructure and over the top – the ideologue, allthese factors combined, provide an even more strong reason, to develop common indicators among differentstakeholders through the consensus building process.Though establishing minimum financial performance standards by <strong>Sa</strong>-<strong>Dhan</strong>, is a path breaking movetowards promoting transparency in MFI reporting and making comparisons between MFIs more meaningful,however, appropriate skills set and information gap among micr<strong>of</strong>inance practitioners remains amajor roadblock towards wide scale use <strong>of</strong> standards by MFIs.The preparation <strong>of</strong> this operational manual is certainly a great attempt towards addressing the skill andinformation gap among practitioners. It will be <strong>of</strong> great help in building awareness and adoption <strong>of</strong>standards as more and more MFIs are going for commercial funding sources and investments to supporttheir growth. Within its carefully defined purpose, I trust this manual will make valuable contribution tothe Indian Micr<strong>of</strong>inance sector in moving towards transparency and self-regulation.M. Udaia Kumar(Chair <strong>Standards</strong> Sub-Group, <strong>Sa</strong>-<strong>Dhan</strong>)Managing Director, SHARE Micr<strong>of</strong>in Ltd.August 2003I
ACKNOWLEDGMENTSThe need <strong>of</strong> the operational manual to track financial performance <strong>of</strong> Micr<strong>of</strong>inance Institutions (MFIs)was triggered during the field-testing <strong>of</strong> financial performance standards suggested by <strong>Sa</strong>-<strong>Dhan</strong> <strong>Standards</strong>Sub-Group. It was found that state <strong>of</strong> data management system and understanding <strong>of</strong> financial conceptsamong MFIs is rather poor and hence, objective <strong>of</strong> building large number <strong>of</strong> strong MFIs will not beachieved until and unless financial systems <strong>of</strong> MFIs are not in place. The issue was taken-up before the<strong>Standards</strong> Sub-Group, which suggested to develop an operational manual to facilitate Micr<strong>of</strong>inance practitionersin adopting financial standards in their respective organisations.This first draft <strong>of</strong> the manual was prepared by Mr. Ramesh S. Arunachalam (Micr<strong>of</strong>inance ConsultingGroup, Chennai) under a specific task assigned by <strong>Sa</strong>-<strong>Dhan</strong>. We wish to place on records our sincerethanks to him for compiling the manual. We would also like to acknowledge that many <strong>of</strong> the conceptualand operational definitions <strong>of</strong> financial terms and concepts in the manual were taken from several documents<strong>of</strong> CGAP, SEEP Network and other publications that are mentioned at the end <strong>of</strong> this manual.The contributions <strong>of</strong> the <strong>Sa</strong>-<strong>Dhan</strong> <strong>Standards</strong> Sub-Group (headed by Mr. Udaia Kumar and equally supportedby key members – Mr. <strong>Sa</strong>njay Sinha, Pr<strong>of</strong>. David Gibbons, Mr. R. K. Mukherjee and Mr. V.<strong>Sa</strong>tyamurti) are gratefully acknowledged for the strategic guidance provided by them during the course <strong>of</strong>development <strong>of</strong> this manual.Our special thanks are due to all who had generously contributed their comments on the draft that helpedin further refinement <strong>of</strong> the manual. Among them, Mr. R. K. Mukherjee, and Mr. B. C. S. Baliga hadworked further on the manual to enrich its presentation by incorporating the comments received on thedraft version.We owe sincere gratitude to Mrs. <strong>Sa</strong>myukta Rao, Mr. Bikram Duggal and Ms. Bindu Ananth at ICICIBank for providing their generous moral and financial support for the process <strong>of</strong> development <strong>of</strong>Micr<strong>of</strong>inance standards in India and more specifically for the production <strong>of</strong> this manual.Last but not the least, a lot <strong>of</strong> appreciation to <strong>Sa</strong>-<strong>Dhan</strong> team – Mrs. Achla <strong>Sa</strong>vyasachi, Mr. L. T. Mate,Mr. Nilesh Arya, and Mr. Niraj Kumar who provided their valuable support in various forms in givingthe final shape to the manual.We encourage readers to share their comments and suggestions on any aspect <strong>of</strong> this manual.Mathew TitusExecutive Director<strong>Sa</strong>-<strong>Dhan</strong>August 2003II
PREFACEThe financial sector has been a pioneer in evolving good practices and standards. Micr<strong>of</strong>inance has emergedas a sector in its own standing. In only a couple <strong>of</strong> decades, the micr<strong>of</strong>inance sector has attracted internationalattention, largely driven by the uniqueness <strong>of</strong> its approach, focus and perhaps part-failure <strong>of</strong> othersectors to operate in consonance to the complex challenges <strong>of</strong> poverty.While the financial sector as a whole has financial practices and standards in place, the micr<strong>of</strong>inance sectorwithin, remain an uncharted domain in this aspect. <strong>Sa</strong>-<strong>Dhan</strong> - The Association <strong>of</strong> Community DevelopmentFinance Institutions in India, found it justified to take the lead in taking up the challenge – <strong>of</strong> suggesting thebroadly accepted global standards, testing contextual applicability and suitability <strong>of</strong> the standards through alongitudinal process, and finally this operational manual as one significant contribution to pr<strong>of</strong>essional development<strong>of</strong> the sector.This manual is intended for micr<strong>of</strong>inance practitioners having some basic familiarity with accounting termsand financial statements. The primary objective <strong>of</strong> this document is to put forward recommended financialstandards, keeping in mind the pr<strong>of</strong>essionals in the sector who may need introduction to the depth andimplications <strong>of</strong> standards.Finally, it is important to clarify upfront what the manual isn’t or doesn’t do. It isn’t intended to be a completehow to manual for appraising micr<strong>of</strong>inance institutions. Further it doesn’t discuss financial adjustments fordistinct accounting practices, subsidies and inflation. To make it clear, this manual should not be used as asubstitute for a chart <strong>of</strong> accounts or accounting policies. It is also not intended to be a financial analysis guide,as analysts normally use additional financial indicators and information beyond what is contained in thismanual. There are many reference materials for MFIs and analysts, several <strong>of</strong> which are listed at the end <strong>of</strong> thismanual.The scope <strong>of</strong> the manual is therefore limited to <strong>Sa</strong>-<strong>Dhan</strong> recommended <strong>Financial</strong> <strong>Performance</strong> <strong>Standards</strong> forself-administration purpose for MFIs.Focus <strong>of</strong> the manual is to:1) Conceptually define the various generic financial performance constructs like asset quality, viability andsustainability, productivity, efficiency, and related aspects.2) Identify reliable and valid indicators for measuring these and to provide operational definitions for theseindicators.3) Document procedures by which these indicators could be calculated including records required, methodologicalaspects and the like.4) Provide illustrative calculations <strong>of</strong> these indicators using a hand book type approach, and5) To suggest a minimum set <strong>of</strong> performance standard for <strong>Sa</strong>-<strong>Dhan</strong>’s members and the Indian micr<strong>of</strong>inancesector.<strong>Sa</strong>-<strong>Dhan</strong> believes that pr<strong>of</strong>essional horizons are wide and a continuous process. This manual is the first attemptto broaden the objective to bring forth practitioner-led best practices and standards as the reference point forall concerned.III
<strong>Tracking</strong> <strong>Financial</strong> <strong>Performance</strong> <strong>Standards</strong> <strong>of</strong> Micr<strong>of</strong>inance InstitutionsSTRUCTURE OF THE MANUALUnderstanding <strong>of</strong> financial performance standards is essential for every Micr<strong>of</strong>inance manager irrespective<strong>of</strong> their institutional priority. The best way to bring them in the fold <strong>of</strong> financial standards is to unveil itsutility/application in most basic form. The attempt to demystifying financial standards contributes both to thelength <strong>of</strong> this manual and to the order in which the things are presented.CHAPTER 1 provides a basic introduction to importance <strong>of</strong> standards and how they are developed with aspecific mention <strong>of</strong> <strong>Sa</strong>-<strong>Dhan</strong>’s approach towards building standards.CHAPTER 2 describes the characteristics & components <strong>of</strong> <strong>Financial</strong> <strong>Performance</strong> <strong>Standards</strong> and at the endit provides summary <strong>of</strong> financial performance standards suggested by <strong>Sa</strong>-<strong>Dhan</strong>.The technical contents <strong>of</strong> the manual are structured as follows:CHAPTER 3 provides a basic introduction to financial statements for Micr<strong>of</strong>inance Institutions - their categories,utilities, components, conceptual definition <strong>of</strong> terms, construction (only Balance Sheet and Income Statement)and finally it deals with key issues in cost allocation while preparing financial statements.CHAPTER 4 goes into specific step-by-step details to prepare loan repayment schedule and calculating age <strong>of</strong>loans from it, concepts & rationale <strong>of</strong> loan loss allowances, its calculation based on aging analysis <strong>of</strong> loans andrelated accounting entries. Finally, construction <strong>of</strong> portfolio report with conceptual definition <strong>of</strong> terms associatedwith itChapter 3 & 4 come early in the technical section <strong>of</strong> the manual because the following chapter is based on clearunderstanding <strong>of</strong> financial statements, repayment schedule, aging analysis and portfolio report. The data required forcalculation <strong>of</strong> different ratios dealt in subsequent chapter, come from these three financial statements viz. Balancesheet, Income statement and Portfolio Report.CHAPTER 5 provides the conceptual framework where the broad standards/constructs <strong>of</strong> Asset (Portfolio)Quality, Efficiency, Productivity, and Viability are discussed with specific indicators. It further goes into detailsfor each indicator, providing conceptual definition along with a discussion on their utility/limitations andidentification <strong>of</strong> key methodological issues with regard to their calculation. For each indicator, the details arestructured as:1. Formula with numerator and denominator2. Trends and the interpretation3. <strong>Sa</strong>-<strong>Dhan</strong> suggested Benchmark4. What the indicator means? – Simple Definition5. What the ratio measures?6. Minimum records to be maintained7. Step-by-step illustration <strong>of</strong> how to calculate each indicator8. What events/activities distort the indicator9. Some examples, where required and appropriateThe Technical Appendix containing annexes, given below:Annex 1Annex 2<strong>Financial</strong> <strong>Performance</strong> Assessment for MFIs: Some Popular Tools used worldwideGlossary <strong>of</strong> <strong>Financial</strong> Terms10 IV
Introduction to Micr<strong>of</strong>inance <strong>Standards</strong>Chapter1INTRODUCTION TO MICROFINANCE STANDARDS1.1 BACKGROUNDAfter more than a decade <strong>of</strong> experimentation, the Micr<strong>of</strong>inance sector in India has graduated to take-<strong>of</strong>fstage and has begun to scale up rapidly, attracting substantial attention and resources. In the context <strong>of</strong>sustained growth <strong>of</strong> Micr<strong>of</strong>inance in India and given the twin imperatives <strong>of</strong> enhanced sustainability andexpanded outreach, there is growing emphasis on pr<strong>of</strong>essional growth <strong>of</strong> the sector. ‘<strong>Standards</strong> setting’ is one <strong>of</strong>the tested means to achieve pr<strong>of</strong>essionalism. Several global initiatives have been undertaken to promotedevelopment <strong>of</strong> reliable financial standards (including performance, accounting and governance standards) tocompare Micr<strong>of</strong>inance Institutions (MFIs) operating in different environments and across the world. Inaddition, MFIs themselves have together attempted (especially, on a regional and/or national basis) to define aconceptual framework for assessment – using commonly agreed indicators and standards.1.2 WHY IS THERE SO MUCH TALK ABOUT STANDARDS?In the recent few years, micro-finance has experienced a significant shift from being an “intervention” made up<strong>of</strong> short-term development programmes to being a full-fledged “industry” composed <strong>of</strong> permanent institutions.This push, by donors, bankers and practitioners alike, towards organisational sustainability has led topr<strong>of</strong>essionalisation <strong>of</strong> the sector, wherein micro-finance institutions strive to apply commercial principles totheir context and uniqueness <strong>of</strong> operations in order to become sustainable and self-sufficient.Earlier impact and outreach (i.e. disbursing credit to large numbers <strong>of</strong> poor) used to be the main goals for aMicr<strong>of</strong>inance programme, but now-a-days portfolio quality and institutional viability have also gained dueimportance as indicators <strong>of</strong> success. Micr<strong>of</strong>inance is now being seen as an industry whose objective is toprovide a wide range <strong>of</strong> financial services to poor households, the informal sector, micro-enterprises, andothers with no or little access to the formal banking system.Consequently, wholesale bank/donor-funded projects are increasingly geared towards strengthening thefoundation and infrastructure <strong>of</strong> the overall industry, in addition to the traditional provision <strong>of</strong> one-on-onetechnical assistance to the Micr<strong>of</strong>inance institution itself. These “industry-wide” initiatives usually have twoend goals:1. To increase transparency in the system through information sharing and reporting mechanisms includingdevelopment <strong>of</strong> standards and their use by MFIs; and2. To integrate Micr<strong>of</strong>inance institutions into the overall financial system.The second reason for the importance <strong>of</strong> standards comes from the institutional level. Despite the fact thatmicro-finance has evolved to a greater level <strong>of</strong> sophistication and experienced constant growth, a simple factremains—there still exists a wide gap between the number <strong>of</strong> clients served by MFIs and the potential market<strong>of</strong> poor people lacking access to credit, savings and other financial services. To start bridging this gap, MFIswould need to do two things:• Make better (optimal) use <strong>of</strong> the resources at hand (i.e. become more efficient and reach more people withthe same amount <strong>of</strong> resources/funding);• Attract other (eclectic) sources <strong>of</strong> funding besides traditional donor funds in order to be able to growfurther and expand outreach.11
<strong>Tracking</strong> <strong>Financial</strong> <strong>Performance</strong> <strong>Standards</strong> <strong>of</strong> Micr<strong>of</strong>inance InstitutionsAs outlined below, Micr<strong>of</strong>inance performance standards provide a critical tool in helping MFIs achieve both <strong>of</strong>these goals.1. First <strong>of</strong> all, by providing across- industry common performance measures, standards initiatives canprovide micro-finance institutions with a cheap and readily available tool to see how their institutionscompare with peers within the industry. (Comparative Analysis).2. <strong>Standards</strong> initiatives such as the ‘Micr<strong>of</strong>inance Information Exchange’ 1 (MIX) give MFIs a one-stopaccess to a wide range <strong>of</strong> comparative performance indicators, based on figures from a peer group <strong>of</strong>leading international MFIs using common calculation methods and accounting principles.3. MFIs can utilise this data not only to monitor their institution’s progress against the rest <strong>of</strong> the industry,but also to identify key areas <strong>of</strong> their operations that require attention or need improvement. (Self-Assessment and Diagnosis)4. Micr<strong>of</strong>inance standards can facilitate MFIs’ access to new sources <strong>of</strong> funds by providing objectiveevidence to lenders, investors, and donors that particular MFIs are in consonance with internationaland national standards. (Rating Benefits)5. As donors focus on the initial phases <strong>of</strong> institutional sustainability, MFIs need to access commercialfunds as a logical step forward. Accessing the market- sources <strong>of</strong> funds requires more than justdemonstrating an ability to <strong>of</strong>fer services to the poor. Commercial bankers and private investors basetheir financing decision not only on “social criteria” but also on the level <strong>of</strong> return and their riskexposure. Thus, MFIs must demonstrate that they are earning a rate <strong>of</strong> return on their operationswhere they are able to pay for the real cost <strong>of</strong> commercial funds (financial self-sufficiency).6. The MFIs need to demonstrate their ability to manage their lending portfolio systematically andeffectively by keeping delinquency and portfolio at risk within an acceptable level.7. Many donors are increasingly adopting emphasis on MFI sustainability in making funding decisions.The Consulting Group on Assistance to the Poorest (CGAP) at the World Bank, for example, requiresthat MFIs who apply for funding present financial statements using a common framework that includesissues <strong>of</strong> effect <strong>of</strong> in-kind subsidies, below-market rate refinancing and reductions in the real value <strong>of</strong>equity through inflation.8. Some other international standards efforts <strong>of</strong>fer MFI evaluations that are not linked to any specificfinancing request, but are made public to enhance the confidence levels <strong>of</strong> potential donors and investors.The fact that a variety <strong>of</strong> actors are involved in this standardisation process—MFIs, networks, donors, privatesector—clearly highlights the extent <strong>of</strong> “buy-in” to the process and aspect <strong>of</strong> having comparable (standard)measures <strong>of</strong> performance.1See Micr<strong>of</strong>inance Information Exchange web site at http://www.mixmbb.org. It should be noted that its publication - Micro-Banking Bulletin publishes only aggregate statistics and not information on specific MFIs.12
Introduction to Micr<strong>of</strong>inance <strong>Standards</strong>1.3 HOW ARE MICROFINANCE STANDARDS DEVELOPED?The process for developing micr<strong>of</strong>inance standards depends on the type <strong>of</strong> institution that spearheads theeffort, the overall objective <strong>of</strong> the exercise, and the ways in which the standards will be used. Current standardsinitiatives can be broken down into three major categories - those led by donor organisations, those led byprivate sector companies, and those led by MFIs.1.3.1 Donor-led effortsDonor-led multi-country comparative standards efforts, such as the Micro-Banking Bulletin and Women’sWorld Banking (WWB) are essentially defined by the sponsoring organisation who then seek to convinceMFIs to participate and supply functional data for feedback and wider dissemination. The Micro-BankingBulletin was constituted on a pro-bono basis and has always been fully funded by donors, with CGAP beingthe primary funder at this date. Institutions send in questionnaires, evaluations and audited financial statements.In return, they receive a detailed financial performance report from the Micro-Banking Bulleting team at nocost. WWB and NCCA use the data also to periodically assess the partner-MFIs.1.3.2 Private sector-led effortsPrivate sector standards initiatives resemble donor efforts in that the MFIs are being rated or evaluated on apre-selected set <strong>of</strong> indicators. The main difference, however, lies in the fact that the organisations involved inthese efforts are striving to become a commercial rating company similar to Standard & Poor’s or Moody’s,where institutions willingly pay a fee to be included in a formal network <strong>of</strong> certified institutions. The ratingsthat are given by Standard & Poor’s or Moody’s tend to be the barometer by which private investors judge thesoundness and quality <strong>of</strong> a company. Because the data reported in the MicroBanking Bulletin are self-reported,with less than 20 percent <strong>of</strong> respondents submitting information that have been independently analysed andverified, a niche market exists for the development <strong>of</strong> an autonomous rating company to whom potentialinvestors in micr<strong>of</strong>inance could turn to as an arbiter <strong>of</strong> quality. Among the principal actors currently in thismarket are – M-CRIL, ACCION, Planet Finance and MicroRate.Planet Finance, through its programme Planet Rating, provides evaluation and rating services to micr<strong>of</strong>inanceinstitutions using the GIRAFE methodology. The GIRAFE evaluation examines six major institutional areasand includes a total <strong>of</strong> 26 quantitative and qualitative indicators. The six areas are governance and decisionmaking process; information and management tools; risk analysis and control; activities and loan portfolio;financing (liabilities and equity); and efficiency and pr<strong>of</strong>itability. The evaluator utilises a grid to rank eachindicator, from which a final score is derived based on the weighting that is assigned to that indicatorMicroRate’s methodology is “risk driven,” focusing on enterprise-critical risk factors such as portfolio at risk, returnon equity, and debt to equity ratio. MicroRate’s evaluation and supervision missions examine the followingcategories <strong>of</strong> performance measure: portfolio quality, information systems, internal controls, market environment,financial health <strong>of</strong> the MFI, and operational efficiency.Based on the conceptual framework <strong>of</strong> the original CAMEL, ACCION developed its own instrument, although itreviews the same five areas as the original CAMEL. ACCION use its CAMEL primarily as an internal assessmenttool, which has contributed to setting performance standards both for the ACCION Network and for themicr<strong>of</strong>inance industry as a whole. The ACCION CAMEL analyzes and rates 21 key indicators, with eachindicator given an individual weighting. Eight quantitative indicators account for 47% <strong>of</strong> the rating, and 13qualitative indicators make up the remaining 53%. The final CAMEL composite rating is a number on a scale<strong>of</strong> zero to five, with five as the measure <strong>of</strong> excellence.13
<strong>Tracking</strong> <strong>Financial</strong> <strong>Performance</strong> <strong>Standards</strong> <strong>of</strong> Micr<strong>of</strong>inance Institutions1.3.3 MFI-led efforts<strong>Standards</strong> initiatives that are led by MFIs usually aim to establish prescriptive norms and a common vision.These standards are arrived at through a lengthy and reiterative consultation process at the international levelamong MFIs adhering to a common network (such as Women’s World Banking) or at the national level. Thefollowing examples show how two different organisations have approached the standard setting process.The Philippine Micr<strong>of</strong>inance Coalition for <strong>Standards</strong> (PMCS), a group <strong>of</strong> NGOs came together in 1996 tobegin the process <strong>of</strong> developing nation-wide micr<strong>of</strong>inance standards. The impetus for this initiative came froma core group <strong>of</strong> MFI directors from two different Philippine networks, who saw that Philippine MFIs were notachieving significant impact in terms <strong>of</strong> outreach or poverty alleviation.The standards development process used by the PMCS consisted <strong>of</strong> four key steps: (1) formation <strong>of</strong> theCoalition itself, which ultimately brought together 69 MFIs, the Central Bank, several commercial banks,research organisations and donors; (2) conducting a national inventory <strong>of</strong> micr<strong>of</strong>inance institutions along withan in-depth survey <strong>of</strong> a smaller number <strong>of</strong> selected MFIs in order to build a database for benchmarking andstandards definition; (3) having working groups develop proposals for standards based on international bestpractices and the results <strong>of</strong> the PMCS’s investigations; and (4) meetings to discuss the propositions and arriveat an overall consensus. In August 1998, this two-year process culminated in the adoption <strong>of</strong> a basic standardframework.The framework adopted by the PMCS has two levels. The first is comprised <strong>of</strong> “Minimum <strong>Standards</strong>” towhich all members must adhere in order to join the Coalition. These are not meant to rate or compare differentMFIs but are meant to be the minimum prerequisites for being considered a “serious micr<strong>of</strong>inance NGO.”The second level consists <strong>of</strong> a series <strong>of</strong> eight performance indicators for which a scoring system is applied toassign numerical scores and attribute weights to arrive at a single overall institutional rating.During the past few years, the Small Enterprise Education and Promotion Network (SEEP), a network <strong>of</strong> USbasedNGOs working in enterprise development and micr<strong>of</strong>inance, has been working with three MFI networksto develop, test, and produce a toolkit for MFI data collection and benchmarking. The purpose <strong>of</strong> the toolkitis to facilitate MFI networks in their efforts to establish performance standards and benchmarking tools fortheir members.Development <strong>of</strong> the toolkit will contribute to building the supervisory capacity <strong>of</strong> MFI networks by providingthem with a management tool for evaluating strengths and weaknesses, and a roadmap for improving MFIperformance.Three networks are involved in this initiative: Ghana Micr<strong>of</strong>inance Institutions Network (GHAMFIN) inGhana, Credit and Development Forum (CDF) in Bangladesh, and the Center for Micr<strong>of</strong>inance for NIS/CEE 1 in Poland. With the technical assistance <strong>of</strong> the Micro-Banking Bulletin and the USAID MicroenterpriseBest Practices project, the following tools are being developed:• A standardized format for financial statements;• A questionnaire for collecting data on performance; and• A database that contains forms for data input, enables automatic adjustments <strong>of</strong> financialstatements, and produces a variety <strong>of</strong> reports.2Newly Independent States/Central and Eastern Europe.14
Introduction to Micr<strong>of</strong>inance <strong>Standards</strong>1.4 SA-DHAN’S APPROACH TOWARDS BUILDING STANDARDSIn India, <strong>Sa</strong>-<strong>Dhan</strong>, The Association <strong>of</strong> Community Development Finance Institutions, has been involved inestablishing standards for the Micr<strong>of</strong>inance sector in India. To take this task forward, <strong>Sa</strong>-<strong>Dhan</strong> has adopted aseminal approach towards standards setting.1.4.1 Process Governing the Development <strong>of</strong> <strong>Standards</strong>Given the diversity <strong>of</strong> operating models, legal forms, regional features and cultural aspects, <strong>Sa</strong>-<strong>Dhan</strong> has, aspart <strong>of</strong> the standard setting process, strategically focused on providing platforms for collective action that arerequired in a nascent but growing sector. <strong>Sa</strong>-<strong>Dhan</strong> has adopted the participatory diagnostic process to safeguardthe interests <strong>of</strong> all stakeholders and develop camaraderie within the Micr<strong>of</strong>inance sector. It also brings clarity,transparency and ownership in the very process <strong>of</strong> formalising standards.To steer the task <strong>of</strong> development <strong>of</strong> standards, a core-group <strong>of</strong> key <strong>Sa</strong>-<strong>Dhan</strong> members was then formed and thisgroup periodically met to take stock <strong>of</strong> progress made by the <strong>Sa</strong>-<strong>Dhan</strong> Secretariat and also to provide futuredirection. The primary task <strong>of</strong> the <strong>Sa</strong>-<strong>Dhan</strong> Secretariat is to build consensus among the diverse set <strong>of</strong> stakeholderson common minimum standards and facilitate the adoption <strong>of</strong> practices that promote good governance, effectivemanagement, transparent reporting and enhanced accountability within the Micr<strong>of</strong>inance sector in India.To begin with, <strong>Sa</strong>-<strong>Dhan</strong> held a series <strong>of</strong> consultative workshops, involving wider stakeholders to develop abroad framework <strong>of</strong> standards for Micro-finance sector. Thereafter, a series <strong>of</strong> workshops were organisedacross regions to define and arrive at broader agreement on the specifics. Simultaneously, Educative and AwarenessGeneration workshops on <strong>Standards</strong> were also held by <strong>Sa</strong>-<strong>Dhan</strong> covering different regions (zones).1.4.2 Strategy for Development <strong>of</strong> <strong>Standards</strong>F Identifying basic thematic areas <strong>of</strong> standards that are neutral, relevant/appropriate and objectively verifiableF Undertaking confidence building measures to establish an open and constructive environment to facilitateexamination <strong>of</strong> controversial issuesF Adopting a twin track approach whereby, at this stage, a minimum set <strong>of</strong> standards (irrespective <strong>of</strong> MFIage, model and scale <strong>of</strong> operations) will be used for the entire sector; further a comprehensive set <strong>of</strong>standards could be developed as the sector maturesF While MFIs should be given a reasonable time frame to adopt standards as an inherent part <strong>of</strong> theirorganisational systems and procedures, they should show consistent and substantial improvement inperformance during the gestation periodF To continue the consultation process with other stakeholders as well to enhance the credibility <strong>of</strong> the sectorF <strong>Standards</strong> building process to be supplemented by the enforcement processF Helping MFIs to adopt standards through transfer <strong>of</strong> knowledge, skills and various capacity buildinginitiatives15
<strong>Tracking</strong> <strong>Financial</strong> <strong>Performance</strong> <strong>Standards</strong> <strong>of</strong> Micr<strong>of</strong>inance Institutions1.4.3 Process Agreed for the Introduction <strong>of</strong> <strong>Standards</strong> for Indian MFIs1. Draft Minimum <strong>Standards</strong> at Sub-Group meeting2. Ask for response from stakeholders3. Field-testing <strong>of</strong> draft standards4. Based on the result <strong>of</strong> field-testing and responses from the stakeholders, finalize the standards5. Introduce standards on a trial basis6. Request six-monthly report on progress towards achieving the standards7. After one year, review the standards and make changes (if required) based on the experience <strong>of</strong> the past yearAfter the first round <strong>of</strong> field-testing the minimum standards for financial performance measures are beingfinalised now by the Sub-Group on <strong>Standards</strong>.1.5 CONCLUSIONOne <strong>of</strong> the interesting aspects <strong>of</strong> evolution <strong>of</strong> Micr<strong>of</strong>inance in India or elsewhere is that it has not evolved frommainstream financial sector, neither the majority <strong>of</strong> institutions providing such services are structured as financialinstitutions. The sector originated from development sector and still it is dominated by Non-GovernmentalOrganisations (NGOs). These set <strong>of</strong> institutions are largely run by managers with no or little background <strong>of</strong>finance.However, the emergence <strong>of</strong> Micr<strong>of</strong>inance standards as a major topic <strong>of</strong> discussion reflects the evolution <strong>of</strong>micr<strong>of</strong>inance into a more sophisticated and formalised industry, composed <strong>of</strong> institutions committed to operatealong principles consistent with those governing formal financial institutions, without losing the focus thatthey have to serve the financial need <strong>of</strong> poor. The fact that a variety <strong>of</strong> actors are involved in this standardisationprocess - MFIs, networks, donors, private sector - seems to underscore the extent to which "buy-in" about theimportance <strong>of</strong> having comparable measures <strong>of</strong> performance has been spread.A major challenge for standards initiatives seems to lie at the practical level <strong>of</strong> data collection. As the PhilippineCoalition found out through their efforts, it was easier to get philosophical agreement on the value <strong>of</strong> standardsthan to generate the information necessary to rate the MFIs. For the majority <strong>of</strong> institutions, some substantial"housecleaning" will need to be done before reliable data could be gathered and made available to the public.In addition, the existence <strong>of</strong> standards is also expected to facilitate MFIs to access to capital markets. Anincreasing number <strong>of</strong> MFIs are beginning to access non-donor private financing and are paying the marketrate. However, very few MFIs are ready to access international capital markets. Having access to performanceinformation may reduce some <strong>of</strong> the transaction uncertainty.Nevertheless, the first big step has been made and there is now widespread recognition that the industry isheading towards more standardisation, transparency, and openness. The foundation has been laid and it is nowup to the individual MFIs to build on the existing structure.16
FINANCIAL PERFORMANCESTANDARDS17
<strong>Tracking</strong> <strong>Financial</strong> <strong>Performance</strong> <strong>Standards</strong> <strong>of</strong> Micr<strong>of</strong>inance Institutions18
<strong>Financial</strong> <strong>Performance</strong> <strong>Standards</strong>Chapter2FINANCIAL PERFORMANCE STANDARDSAn MFI can deduce its financial performance in terms <strong>of</strong> ratios and indicators from its operations andfinancial position. “<strong>Standards</strong>’’ is a step forward; it represents the ideal level for each indicator.<strong>Financial</strong> <strong>Performance</strong> <strong>Standards</strong> are drawn from experience <strong>of</strong> analysing the indicators that are derived fromfinancial ratios. Analysis <strong>of</strong> indicators are done in two ways (a) starting with ratios and the resultant indicators<strong>of</strong> a particular date say March 31, 2003 or (b) starting with ratios and indicators <strong>of</strong> different periods (March31, 2003 as compared to March 31, 2002).Application <strong>of</strong> financial performance standards can be made (a) by an MFI within itself, driven by its ownexperience and (b) Across MFIs driven by experience <strong>of</strong> the industry. This manual entirely focuses on the latter i.efinancial performance standards applicable to MFIs across the industry.The financial performance standards given in the manual therefore incorporate the experience and practiceswithin a large number <strong>of</strong> micr<strong>of</strong>inance institutions and tries to add refinements wherever found necessary. Theemphasis is therefore into sharing the industry-level financial standards in the micr<strong>of</strong>inance industry, irrespective<strong>of</strong> the micr<strong>of</strong>inance model, geographical location, size or age <strong>of</strong> institutions. As the result, the financialperformance standards are applicable to all micr<strong>of</strong>inance institutions. This also defines the choice <strong>of</strong> select fewfinancial standards contained in the manual.<strong>Financial</strong> performance standards for the Micr<strong>of</strong>inance industry is characterised by the following four features:F Specific financial aspects <strong>of</strong> an MFI that together define financial performanceF A common set <strong>of</strong> performance indicators for measurement and comparison,F A uniform methodology for calculating the selected indicators, andF A benchmark for each indicator leading to standard2.1 SPECIFIC FINANCIAL ASPECTS THAT TOGETHER DEFINE FINANCIAL PERFORMANCEThe first step in the process <strong>of</strong> developing standards is to identify the broad financial aspects <strong>of</strong> an MFI. Thistask is made easy by the fact that there is general agreement in the financial sector about the broad aspects thatare:(1) Outreach; (2) Assets (Portfolio) Quality; (3) Productivity; (4) Efficiency; (5) Viability (Sustainability); (6)Pr<strong>of</strong>itability; (7) Capital Adequacy; and (8) Liquidity.Having outlined the specific financial aspects above, the next steps are to decide on the indicators within each<strong>of</strong> the above broad aspects and work further deep into deriving the financial ratios.19
<strong>Tracking</strong> <strong>Financial</strong> <strong>Performance</strong> <strong>Standards</strong> <strong>of</strong> Micr<strong>of</strong>inance Institutions2.2 FINANCIAL PERFORMANCE INDICATORSHaving the broad aspects (2.1 above) in place, the crucial step is to make choice among wide numbers <strong>of</strong>indicators available for each <strong>of</strong> the broad aspects <strong>of</strong> financial performance.Table-I below lists the indicators adopted by some <strong>of</strong> the international agencies. It is important here to understandthat for each broad aspect, some indicators need to be prioritised i.e. using all available indicators for eachaspect would be a huge task; some indicators are also complimentary so a choice <strong>of</strong> either/or becomes necessary.Table 1 - Common measures <strong>of</strong> <strong>Financial</strong> <strong>Performance</strong> used by different agenciesNAME OF INSTITUTIONINDICATORACCIONMicr<strong>of</strong>inanceInformationExchangePlaNet RatingSEEP NetworkWOCCUWomen's WorldBankingOutreach• Number <strong>of</strong> active borrowers P P P P• Number <strong>of</strong> women borrowers P PPortfolio (Asset) Quality• Repayment rate P• Portfolio at risk P P P P P P• Arrears rate P P• Loan loss rate P P P• Loan loss provision (or Reserve) rate P P P P PProductivity• Number <strong>of</strong> loans per credit <strong>of</strong>ficer P P P• Amount <strong>of</strong> loans per credit <strong>of</strong>ficer P P• Ratio <strong>of</strong> credit <strong>of</strong>ficers to total staff P P PEfficiency• Cost per loan (or borrower) P P P• Cost per unit <strong>of</strong> money lent P P P P• Operational efficiency P P P P P• Administrative efficiency P PSustainability/Viability• Operational sustainability P P P P• <strong>Financial</strong> sustainability P P P PPr<strong>of</strong>itability• Return on assets (adjusted & unadjusted) P P P P P P• Return on equity (adjusted & unadjusted) P P P P• Yield on portfolio P P PCapital Adequacy• Leverage P P P PLiquidity• Current/Quick Ratio P P20
<strong>Financial</strong> <strong>Performance</strong> <strong>Standards</strong>2.3 UNIFORM METHODOLOGY FOR CALCULATING INDICATORS<strong>Performance</strong> indicators require a reliable calculation method in order to be comparable. This requires that theexact formula for each indicator is detailed for uniform interpretation and that there is an agreement on hownecessary adjustments/re-grouping <strong>of</strong> financial data is made so that every financial data would have a universallycommon meaning.The latter aspect is critical if a true “level playing field” is to be established on which to measure financialperformance, since un-adjusted measures may be ambiguous, reflect differences in interpretation; they mayalso reflect differences in accounting practices and access to subsidies. The key aspect here is that unlessaccounting practices are adjusted to reflect a normal position across MFIs, establishing actual financialperformance comparisons is not feasible.The basic issues to consider here are the following:• Norms for provisioning for loan loss• Charging depreciation on fixed assets and• Accounting for accrued interest - income & expenseThere are other issues for consideration, namely• Adjustments for the effect <strong>of</strong> inflation on equity.• Adjustments for subsidies including cost allocation <strong>of</strong> unrecognised and/or hidden subsidies2.4 BENCHMARKS FOR FINANCIAL PERFORMANCE INDICATORS, LEADING TO STANDARDSThe fourth step in standards-setting involves elaboration <strong>of</strong> chosen benchmarks for each indicator. Finally, thestandards are set, based on practical observation <strong>of</strong> indicators evolving from MFIs and evaluating them forcomprehensive application across the industry. A look at benchmarking, first.Benchmarking is achieved in two steps – (a) making choice <strong>of</strong> suitability <strong>of</strong> specific indicators from the universallist <strong>of</strong> indicators and then (b) elaborating the appropriate financial ratios for each indicator.Benchmarking provides MFIs with “milestone” to drive their institution to optimal financial performance.More important, it helps to pinpoint potential trouble spots / areas where MFIs need to focus.The micr<strong>of</strong>inance industry represents a range <strong>of</strong> institutions and different operating environments. Benchmarkingis meaningful only if an MFI is compared with similar other MFIs. One simple method is by comparisonamong peer group <strong>of</strong> MFIs – peers by location, size and operational models. The Micro Banking Bulletin, forexample, forms their peer groups using three main criteria: region, scale <strong>of</strong> operation, and target market. Table2 below lists the criteria for these peer groups.RegionTable 2 - Micro Banking Bulletin Peer Group CriteriaScale <strong>of</strong> OperationsTotal Loan Portfolio (US$)21Target MarketAverage loan balance/GNP per capitaAfricaLarge: > 5 millionMiddle East/North Africa Medium: 800,000 to 5 million Low-end: < 20% OR Avg. LoanCentral Asia Small: < 800,000 Balance = US$150Asia (Pacific) Large: > 8 million Broad: 20% to 149%Asia (South) Medium: 1 to 8 million High-end: 150 to 249%Small: < 1 million Small Businesses: = 250%Eastern EuropeLatin AmericaLarge: > 12.5 millionMedium: 1.5 to 12.5 millionSmall: < 1.5 millionSource: Micro Banking Bulletin, November 2002.
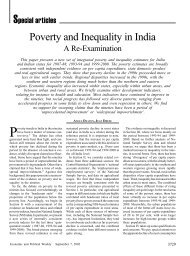
<strong>Tracking</strong> <strong>Financial</strong> <strong>Performance</strong> <strong>Standards</strong> <strong>of</strong> Micr<strong>of</strong>inance InstitutionsSeveral practitioner networks such as Women's World Banking and ACCION establish a specific target toreach, or a set <strong>of</strong> reference values within whose range their affiliates will need to fall.Table 3 illustrates some performance benchmarks that are in use in the international micr<strong>of</strong>inance sector today.Table 3 - Some Illustrative <strong>Performance</strong> Benchmarks(Women's World Banking & ACCION)Indicator Target TrendMonthly reimbursement rate >90%, >95% IncreasingCost per unit lent 35%, 15% DecreasingPortfolio at risk (> 31 days) 1 day) < 15% DecreasingLoan loss
<strong>Financial</strong> <strong>Performance</strong> <strong>Standards</strong>Table 4 – <strong>Sa</strong>-<strong>Dhan</strong>’s Minimum <strong>Standards</strong> with Indicators and Values1. SUSTAINABILITY PERFORMANCE STANDARDSIndicator # 1 ProposedNameOperational Self-SufficiencyOperating Income (from Loans + Investments)Formula 3Operating Costs + Loan Loss Provisions + Financing CostsStandard Operational Self-Sufficiency at 100%2. ASSET QUALITY PERFORMANCE STANDARDIndicator # 1 ProposedNamePortfolio at Risk > 60 Days Past DueFormulaUnpaid Principal Balance <strong>of</strong> Past Due Loans (with overdue > 60 days <strong>of</strong> age)Total Gross Outstanding PortfolioStandard PAR > 60 Days at less than 10%Indicator # 2 ProposedNameCurrent Repayment RateFormulaTotal Amount (Principal) Collected for the Period - PrepaymentsTotal Amount (Principal) Due 4 (to be collected during period)Standard Current Repayment Rate at greater than 90%3. EFFICIENCY PERFORMANCE STANDARDSIndicator # 1 ProposedName Operating Cost Ratio 5Formula 6Total Operating CostsAverage Outstanding PortfolioStandard Operating Cost Ratio at less than 20%Indicator # 2 ProposedName Total Cost Ratio 7FormulaTotal Costs (Operational Costs + Loan Loss Provision + Cost <strong>of</strong> Funds)Average Outstanding PortfolioStandard Total Cost Ratio at less than 30%Indicator # 3 ProposedName Active Borrowers Per Credit Officers 8FormulaStandardAverage Number <strong>of</strong> Active BorrowersAverage Number <strong>of</strong> Credit OfficersActive Borrowers Per Credit Officer at between 250-350 clientsTo summarise, <strong>Sa</strong>-<strong>Dhan</strong> through its sub-group on standards, adopted a intensive participative methodology toidentify performance standards; define and apply them, outline a common methodology for their calculationand establish benchmarks for a minimum set <strong>of</strong> standards given in the Table above. In effect, this operationalmanual is result <strong>of</strong> this entire process <strong>of</strong> practice-led standard setting by <strong>Sa</strong>-<strong>Dhan</strong>.4Some MFIs include past dues from previous period to track past due payments that were to be collected5Also called as Administrative Efficiency Ratio6What to include in the numerator and denominator <strong>of</strong> the formula and what to exclude have been dealt with extensively inChapter 5 as also other methodological issues7Includes Operating Costs + Cost <strong>of</strong> Funds + Loan Loss Provision8Also called as client to staff ratio with staff being loan <strong>of</strong>ficers primarily23
<strong>Tracking</strong> <strong>Financial</strong> <strong>Performance</strong> <strong>Standards</strong> <strong>of</strong> Micr<strong>of</strong>inance InstitutionsFINANCIAL STATEMENTS OF AMICROFINANCE INSTITUTION24
<strong>Financial</strong> Statements <strong>of</strong> a Micr<strong>of</strong>inance InstitutionChapter3FINANCIAL STATEMENTS OF A MICROFINANCEINSTITUTION3.1 INTRODUCTION<strong>Financial</strong> Statements are summary <strong>of</strong> quantitative data depicting overall financial health <strong>of</strong> an organisation.Therefore, they not only enable an assessment <strong>of</strong> how well an organisation is doing but also provide clues<strong>of</strong> the specific areas that require management attention.In the Indian context, the financial statements most widely understood are the balance sheet and income &expenditure statement. The standard forms used by MFI and the auditors for the balance sheet and income &expenditure statement are drawn from schedule-VI <strong>of</strong> the Indian Companies Act 1956. MFIs add some annexureto both these main statements as supplementary information for details. The annexure are <strong>of</strong>ten not commonacross but MFI specific. Most <strong>of</strong> the annexure are also found to be explaining accounting break-up like subheads<strong>of</strong> the broad head ‘salaries and allowances ’and therefore not <strong>of</strong> much help in the context <strong>of</strong> the financialperformance <strong>of</strong> an MFI.The four financial statements that together provide data for assessing financial performance <strong>of</strong> an MFI are:• Balance sheet• Income and Expenditure Statement• Cash Flow Statement, and• Portfolio Report.The first two statements are statutory and hence widely available statements from MFIs though not completewith required details; the latter two, in most cases, need to be specially prepared.Additionally, policy <strong>of</strong> the MFI in regard to accounting such as depreciation, provisioning norms, incomerecognition and accrued expenses would be required for complete understanding.In the Table below, for each statement, there is a corresponding column that lists the key strategic issues thathave to be culled out.Table 5 – <strong>Financial</strong> Statements and what does it conveys<strong>Financial</strong> Statement Key Issues required as informationBalance Sheet ● What is the overall financial position <strong>of</strong> the MFI?● What asset does it own and types?● How does it finance these assets - through liabilities (obligations toothers) and through equity (shares/stocks)?● What assets and liabilities are short term or long termIncome and Expenditure ● What income is being generated by the MFI?Statement ● How much <strong>of</strong> this income is from operations?● Income from investments?● Income from other activities and sources?● Recurring and non-recurring income and expenses● What expenses are required to earn the income?● How much is incurred as financial expenses?● What are the operational expenses?Cash Flow Statement ● What are the MFI’s regular sources <strong>of</strong> cash?● How does it spend / use that cash?Portfolio Report ● What portion <strong>of</strong> the MFI’s portfolio is good?● What portion is bad and how much bad?25
<strong>Tracking</strong> <strong>Financial</strong> <strong>Performance</strong> <strong>Standards</strong> <strong>of</strong> Micr<strong>of</strong>inance InstitutionsImportance <strong>of</strong> Timely and Accurate <strong>Financial</strong> StatementsTimely production <strong>of</strong> financial records is critical. If financial information is not produced accurately andpunctually, financial ratios and assessment would not be <strong>of</strong> much use. This would lead to poor management<strong>of</strong> the organisation and inaccurate response to operational problems leading to institutional failure.Each <strong>of</strong> the four financial statements has specific contribution to the objective <strong>of</strong> analysis <strong>of</strong> financial performance.Table 6 – <strong>Financial</strong> Statements and Possible Analysis<strong>Financial</strong> Statements Possible AnalysisStatement Specific Analysis in regard to Utility to MFI ManagerBalance Sheet ● Asset Liquidity Matching Overall, how are the assets being funded? Is thefinancing pattern adequate?● Asset Quality What portion <strong>of</strong> the loan portfolio (asset) is goodor bad? Are there reserves to cover these?Income and ● Sustainability Is the MFI meeting all its expenses from itsExpenditureincome? What are the trends?Statement ● Pr<strong>of</strong>itability Is it generating a surplus and providing returnsto its stakeholders?● Operating Efficiency Are loans being provided in a cost-effectivemanner? Are resources being used in anoptimal fashion?Cash Flow Statement ● Liquidity Is enough cash available to cover all cashobligations?Portfolio Report ● Asset Quality What portion <strong>of</strong> the loan portfolio (asset) isgood or bad?What is the nature <strong>of</strong> bad loans?The main statements i.e. the balance sheet and income & expenditure statements are taken as the base for thediscussions in this chapter. A sample <strong>of</strong> traditional financial statements (Table 7 a & 7 b) in the Indian contextis being re-produced here in the beginning to familiarise Indian Micr<strong>of</strong>inance practitioners. However, for thepurpose <strong>of</strong> building the discussion on the financial statement that captures the specific features <strong>of</strong> an MFI andrequirement <strong>of</strong> different stakeholders, a more representative sample <strong>of</strong> financial statement (Table 8 a & 8 b) byexpanding conventional financial statements are also presented in this chapter for reference. This example willbe referred for all discussions in this chapter.26
<strong>Financial</strong> Statements <strong>of</strong> a Micr<strong>of</strong>inance InstitutionTable 7 (A) – Conventional Income & Expense Statement <strong>of</strong> an MFIINCOME AND EXPENDITURE STATEMENT FOR THE YEAR ENDED MARCH 31, 2003Figures <strong>of</strong> previous year (Rs.) Particulars Current year figures (Rs.)INCOME13,56,000 Interest 17,40,00012,000 Service charges 48,0001,04,000 Operational grant11,000 Miscellaneous income 23,00014,83,000 Total 18,11,000EXPENDITURE5,38,000 <strong>Sa</strong>laries and allowances 6,08,00098,000 Rent, electricity and taxes 1,16,0001,32,000 Office Expenses 1,45,0002,02,000 Conveyance and travel 2,34,0003,78,000 Interest on loans 4,90,00063,000 Miscellaneous expenses 54,00072,000 Depreciation 62,00014,83,000 Total 17,09,000Excess <strong>of</strong> income over expenditure 1,02,000Transferred to reserveTable 7 (B) – Conventional Balance Sheet <strong>of</strong> an MFIBALANCE SHEET AS ON MARCH 31, 2003Figures <strong>of</strong> previous year (Rs.) Particulars Current year figures (Rs.)SOURCES OF FUND8,00,000 Corpus 8,00,00098,000 Reserve and Surplus 2,00,00048,69,000 Loans 84,00,0002,13,000 Current Liabilities 3,50,00059,80,000 Total 97,50,000APPLICATION OF FUND3,60,000 Fixed Assets 2,90,0001,00,000 Investments 4,00,00054,67,000 Loans 86,25,00053,000 Current Assets 4,35,00059,80,000 Total 97,50,00027
<strong>Tracking</strong> <strong>Financial</strong> <strong>Performance</strong> <strong>Standards</strong> <strong>of</strong> Micr<strong>of</strong>inance InstitutionsTable 8 (a) – <strong>Sa</strong>mple Income & Expenditure Statement <strong>of</strong> an MFII II III IV VSl. No. Description Year Ending 31 st March2001 2002 2003INCOMEIncome from loan PortfolioIS 1 Interest on Current and Past Due Loans 18,000 24,100 31,000IS 2 Loan Fees and Service Charges 7,700 10,000 10,600IS 3 Late Fees on Loans 700 600 400IS 4 Total Income from Loan Portfolio 26,400 34,700 42,000IS 5 Investment Income (Interest on Investment) 800 3,000 1,000IS 6 TOTAL OPERATING INCOME 27,200 37,700 43,000EXPENSES<strong>Financial</strong> ExpensesIS 7 Interest On Debt 2,400 7,000 7,400IS 8 Interest Paid on DepositsIS 9 Total <strong>Financial</strong> Expenses 2,400 7,000 7,400IS 10 Gross <strong>Financial</strong> Margin (IS 6 – IS 9) 24,800 30,700 35,600IS 11 Provision for Loan Losses 10,000 6,000 5,000IS 12 Net <strong>Financial</strong> Margin (IS 10 – IS 11) 14,800 24,700 30,600Operating ExpensesIS 14 <strong>Sa</strong>laries and Benefits 8,000 10,000 12,000IS 15 Administrative Expenses 4,600 5,000 5,200IS 16 Occupancy Expenses 4,300 5,000 5,000IS 17 Travel 4,000 5,000 5,000IS 18 Depreciation 400 600 800IS 19 Miscellaneous 500 600 600IS 20 Total Operating Expenses 21,800 26,200 28,600IS 21 Gross Surplus/Deficit from Operations -7,000 -1,500 2,000IS 22 Grant Revenue for Operations 7,000 1,900 0IS 23 Net Surplus/Deficit from Operation 0 400 2,00028
<strong>Financial</strong> Statements <strong>of</strong> a Micr<strong>of</strong>inance Institution3.2 INCOME AND EXPENDITURE STATEMENT – KEY DEFINITIONS & INTERPRETATIONSThe Income and Expenditure statement is also known as the pr<strong>of</strong>it and loss statement. It is a flow statementthat summarises all financial activity during a stated period <strong>of</strong> time, usually a month, quarter or year. Itdisplays all revenues and expenses for a stated period <strong>of</strong> time. The bottom line <strong>of</strong> an income statement is thenet income (or net pr<strong>of</strong>it or surplus) for the period.There may be need to analyse and distinguish between other services from MFI that are directly connected tomicr<strong>of</strong>inance (hence to be included in costs) and services that are independent <strong>of</strong> micr<strong>of</strong>inance and hence to beexcluded for consideration in this context.There are instances that an MFI is providing other services in addition to micr<strong>of</strong>inance services. These servicesand their costs, ranging from shared facilities to staff and other costs need to be bifurcated to arrive at true andfair costs assignable to micr<strong>of</strong>inance operations. The guidelines for cost allocation are also provided at the end<strong>of</strong> this chapter (see section 3.4)It needs emphasis that the conventional Income statement (see Table 7 a) is as per statutory disclosure norms.For the purpose <strong>of</strong> evaluating financial performance and standards, the statutory information is expanded togreater details (see Table 8 a). In light <strong>of</strong> the above, explanation <strong>of</strong> a sample income and expenditure statement,expanded to needs <strong>of</strong> evaluation is presented further in this section.Using the expanded format (Table 8 a) helps in several ways:• One can analyse where its income is coming from and accordingly adjust its strategic direction so as toachieve long term sustainability• Subsidies can be ascertained and the true financial picture <strong>of</strong> the MFI can be understood• The existence <strong>of</strong> prudential accounting norms can be ascertained (like loan loss provision) and thiswill enable both the MFI and the wholesaler (donor) to take necessary action for safeguarding theportfolio• The extent to which increase in operational (cash and non-cash) expenses are justified by an increase inportfolio size, quality and income can also be determined. This will help, both the MFI and thewholesaler (or Donor), make better decisions aimed at enhancing the outreach and sustainability <strong>of</strong>the organisation.3.2.1 IncomeIncome for an MFI can be received from three basic sources• Income from Loan Portfolio• Investment Income• Other IncomeINCOME 2001 2002 2003Income from loan PortfolioIS 1 Interest on Current and Past Due Loans 18,000 24,100 31,000IS 2 Loan Fees and Service Charges 7,700 10,000 10,600IS 3 Late Fees on Loans 700 600 400IS 4 Total Income from Loan Portfolio 26,400 34,700 42,000IS 5 Investment Income (Interest on Investment) 800 3000 1000IS 6 TOTAL OPERATING INCOME 27,200 37,700 43,00029
<strong>Tracking</strong> <strong>Financial</strong> <strong>Performance</strong> <strong>Standards</strong> <strong>of</strong> Micr<strong>of</strong>inance InstitutionsEach <strong>of</strong> these aspects are described below3.2.1.1 Operational IncomeIncome from loan Portfolio is income that an MFI derives from its lending operations (refer IS 4, Table 8 a).This would include interest and fee income. Interest income can be further divided into interest on current,past and re-structured loans outstanding.Interest Income on Current, Past-Due and Re-Structured Loans – consists <strong>of</strong> the amount collected fromclients on loans. The issues are:1. The interest rate is always stated as a percentage <strong>of</strong> the loan amount for a period (generally monthly orannually)2. It is the balance sheet accounts that are affected by the principal portion <strong>of</strong> the loan repayment, i.e., theLoan Outstanding decrease and Cash increases, until another loan is made and then the reverse is true.Apart from interest income, the MFI can also get income from fees/service charges. Fees could be <strong>of</strong> two types- stated as a percentage <strong>of</strong> the loan amount or as a flat fee, for loans provided by the organisation.Fees are however usually stated as a percentage <strong>of</strong> the loan disbursed (or loan outstanding) and they increasethe effective interest rate for the client. The impact <strong>of</strong> the fee however varies across loan terms, with fees havinga greater impact on the effective interest rate for loans with shorter rather than longer loan terms. Sometimes,an MFI charges late fees on the loans. This is the amount collected, as a penalty, from borrowers who have hadloans with payments in arrears.3.2.1.2 Investment IncomeA second income for an MFI is its investments (refer IS 5, Table 8 a). Investments are usually excess (idle) cashinvested by the MFI (into fixed deposits, savings bank accounts, marketable securities etc.) from its revolvingloan fund.Thus, the amount <strong>of</strong> interest earned by the organisation on its investments such as term deposits, securities,treasury bills, savings bank accounts etc. comprise its investment income.There are usually two forms <strong>of</strong> investments that can be made by MFIs1) Short-term investments (maturity date is less than a year)2) Long-Term Investments (maturity date is more than a year)Several aspects about investment income require clarification:1) They are getting be a legitimised source <strong>of</strong> income for MFIs2) However, only some legal forms have the scope for investing in a variety <strong>of</strong> investments3) Investment requires a special fund manager who can attend to the task <strong>of</strong> investing prudently - i.e. ensurethe right balance between safety, liquidity and returns30
<strong>Financial</strong> Statements <strong>of</strong> a Micr<strong>of</strong>inance Institution3.2.1.3 Other IncomeGrant Income is the main form <strong>of</strong> other income for MFI (refer IS 22, Table 8 a). This generally includes twotypes <strong>of</strong> grants:1. Grants for provision <strong>of</strong> credit services – this includes grants (or donations) provided by donors, wholesalersand others towards salaries and other operational expenses.2. Grants for loan fund capital – this typically encompasses donations (or contributions) to an MFIs revolvingloan fund capital.Either way, grants are better brought into the income statement and through this taken into the net worth (Networth) side <strong>of</strong> the balance sheet.a. Income from Grants for Credit Services - funds donated to the organisation to cover programmeand operating expenses.b. Income from Grants for Loan Fund Capital - funds donated to the organisation to capitalise theloan fund, which are restricted to use for lending and can’t be spent on operating expenses.Miscellaneous income can also be a source <strong>of</strong> other income. For example, when loans that have been written<strong>of</strong>fare collected, the cash coming in (back to the organisation) is treated as miscellaneous income. This isbecause, the loan loss provision was treated as an expense in the first place and therefore, when the written-<strong>of</strong>floan is collected, it should be treated as an income.The key reasons for bifurcating the income in this manner (3 sources) is to see where an MFI is really gettingits income from - operations or investments or grants? This aspect is crucial because ultimately, an MFI thatgets most <strong>of</strong> its income from grants cannot be expected to sustainable. In terms <strong>of</strong> best practices recommendations,it can be said that operational income should constitute 60 percent, investment income 30 percent, andmiscellaneous income around 10 percent.3.2.2 ExpensesExpenses <strong>of</strong> an MFI can be categorised into two broad heads:• <strong>Financial</strong> Expenses• Operational ExpensesEXPENSES 2001 2002 2003<strong>Financial</strong> ExpensesIS 7 Interest On Debt 2,400 7,000 7,400IS 8 Interest Paid on DepositsIS 9 Total <strong>Financial</strong> Expenses 2,400 7,000 7,400IS 10 Gross <strong>Financial</strong> Margin (IS 6 – IS 9) 24,800 30,700 35,600IS 11 Provision for Loan Losses 10,000 6,000 5,000IS 12 Net <strong>Financial</strong> Margin (IS 10 – IS 11) 14,800 24,700 30,600Operating ExpensesIS 14 <strong>Sa</strong>laries and Benefits 8,000 10,000 12,000IS 15 Administrative Expenses 4,600 5,000 5,200IS 16 Occupancy Expenses 4,300 5,000 5,000IS 17 Travel 4,000 5,000 5,000IS 18 Depreciation 400 600 800IS 19 Miscellaneous 500 600 600IS 20 Total Operating Expenses 21,800 26,200 28,60031
<strong>Tracking</strong> <strong>Financial</strong> <strong>Performance</strong> <strong>Standards</strong> <strong>of</strong> Micr<strong>of</strong>inance InstitutionsEach <strong>of</strong> these aspects are described below3.2.2.1 <strong>Financial</strong> ExpensesThere are two kinds <strong>of</strong> financial expenses for an MFI. There are:1. Interest on Debt or borrowings - interest paid to banks and other financial institutions for money loaned(by them) to the MFI (refer IS 7, Table 8 a).This interest is stated as a percentage figure on an annual basis and depending on the loan term it is workedout. Different lenders usually have different methods <strong>of</strong> calculating interest – i.e. on a declining balance,flat, simple or compound basis.In most cases, financial institutions do not use the flat rate <strong>of</strong> interest. Rather, they use the decliningbalance interest method in conjunction with simple or compound interest 9 .Please note that the principal repayment <strong>of</strong> a bank loan is not included as a financial cost.2. Interest Paid on Deposits - interest payments earned by clients who deposit savings in the organisation(refer IS 8, Table 8 a).Please note that, in a technical sense, interest should be paid on savings, which is debt and not equity.While some MFIs do this, most do not and this is certainly a legal violation as savings is a liability onwhich interest must be paid to the borrower. Also, not all MFIs are allowed to mobilise savings3.2.2.2 Operational ExpensesThere are two kinds <strong>of</strong> operational expenses:1) One that involves an outflow <strong>of</strong> cash, which are called as cash operational expenses. This includes salaries,administrative expenses, travel, occupancy and miscellaneous expenses. Please see the box for definitions.Operating Cash Expenses - Some Definitions1. Operating Expenses are related to the management <strong>of</strong> the loan fund, whether it is held as outstandingloans or investments/deposits. For a single - purpose financial institution, all costs should be included.2. For multi-purpose institutions, all direct costs <strong>of</strong> financial operations and an appropriate portion <strong>of</strong>the institution’s overhead should be included.The main categories are:1. <strong>Sa</strong>laries and benefits - amounts earned by staff for services rendered (refer IS 14, Table 8 a).2. Administrative expenses - costs incurred in administering the organisation such as stationary, insurance,legal fees, etc (refer IS 15, Table 8 a).3. Occupancy expenses - expenses made for (1) lease <strong>of</strong> land and/or buildings for the purposes <strong>of</strong> loanfund management over a specified time period, and (2) expenses for utilities, such as electricity,water, and telephone (refer IS 16, Table 8 a).4. Travel - expenses for transportation, room and board, etc., <strong>of</strong> staff members working on behalf <strong>of</strong> theorganisation (refer IS 17, Table 8 a).5. Other Expenses - other expenses related to the loan fund’s operations, such as training costs, loss oncurrency conversion, etc (refer IS 19, Table 8 a).9While banks predominantly use compound, other wholesalers and donors use simple interest32
<strong>Financial</strong> Statements <strong>of</strong> a Micr<strong>of</strong>inance Institution2) The other, which doesn’t involve an outflow <strong>of</strong> cash, which is called as non-cash operational expensesEXPENSESNon-Cash Operational ExpensesDepreciationLoan Loss ProvisionTotal Non-Cash Operational ExpensesThe major non-cash operational expenses for an MFI are1) Provision for Loan Losses – The loan loss provision (refer IS 11, Table 8 a) is the allowance made forexpected defaults on the loan fund (See section 4.2.1 in next chapter for further detail). This is usually based onan aging analysis <strong>of</strong> loan accounts and allocation <strong>of</strong> risk rates based on historical default rate or best practices(explained in detail in sec 4.2.2 in chapter 4).The loan loss provision is the (non-cash) amount expensed in a period to increase the loan loss reserve {Seesection 3.3.2 (c)} to an adequate level to cover probable defaults <strong>of</strong> the loan portfolio. Although a loan lossprovision (a non-cash expense) is treated as a direct expense <strong>of</strong> the credit programme when the provision ismade, the loans will not yet have been written <strong>of</strong>f as actual loss. Some organisations include the loan lossexpense with the operating costs. It is important to separate the loan loss expense from other operating costs,as an indicator <strong>of</strong> portfolio quality.2) Depreciation Expenses – Depreciation (refer IS 18, Table 8 a) is an annual, non-cash expense that is determinedby estimating the useful life <strong>of</strong> each asset. Using the most common method, called straight-line depreciation,an asset with an estimated useful life <strong>of</strong> five years would have one-fifth <strong>of</strong> its purchase price reflected as anexpense in each <strong>of</strong> five years. Depreciation represents a decrease in the value <strong>of</strong> property and equipment toaccount for that portion <strong>of</strong> their useful life that is used up during each accounting period. Land theoreticallydoes not lose value over time and therefore is not depreciated. Legal aspects also sometimes curtail the maximumdepreciation amounts based on a slab rate classification for each depreciable item such as cars, computers etc.3.2.2.3 Gross Surplus/Deficit from the OperationGross Surplus/Deficit from the Operation (refer IS 21, Table 8 a) is derived after Total operating income (referIS 6, Table 8 a) less all expenses related to the MFI’s core financial service operations, including total operatingexpenses (refer IS 20, Table 8 a), total financial expenses (refer IS 9, Table 8 a), and loan loss provision expense(refer IS 11, Table 8 a). It does not include donations, revenues expenses from non-financial services. ManyMFIs choose not to deduct taxes on revenues or pr<strong>of</strong>its from the net operating income; rather they are includedas a separate category. MFIs are encouraged to indicate if taxes are included in this account.3.2.2.4 Net Surplus/Deficit from the OperationNet Surplus/Deficit from the Operation (refer IS 23, Table 8 a) is derived after total income (operating andnon-operating, including all donations) less total expenses and taxes (if any). Some MFIs prefer to present netincome before donations and taxes. If so, the MFI should label it as such (such as net income before donations).The issue <strong>of</strong> treatment <strong>of</strong> grant income (received for acquisition <strong>of</strong> assets and meeting operational cost) as nonoperationalincome is dealt ahead. They are reported below the line (after gross surplus deficit from operation)in the income statement.33
<strong>Tracking</strong> <strong>Financial</strong> <strong>Performance</strong> <strong>Standards</strong> <strong>of</strong> Micr<strong>of</strong>inance Institutions3.2.3 Treatment <strong>of</strong> Donor Grants1. Funds donated to cover operational cost are a direct subsidy to the MFI.2. The value <strong>of</strong> the subsidy is, therefore, equal to the amount donated to cover expenses incurred in theperiod reported.3. Some donations are provided to cover operating shortfalls over a period greater than one year. Only theamount “spent” in the year is recorded (as per conventional method) on the income statement as revenue.4. Any amount still to be used in subsequent years remains as a liability (as per conventional method) on thebalance sheet (referred to as deferred revenue). This occurs because, theoretically, if an MFI stoppedoperations in the middle <strong>of</strong> a multi-year operating grant, they would have to return the unused donationsto the donor. Therefore, the unused amount is considered a liability.5. However, prudent norms suggest that Donated funds for operations should be reported on the incomestatement separately from revenue generated by lending and investment activities to accurately report theearned revenue <strong>of</strong> the MFI.6. These funds should be deducted from revenue or net income prior to any financial performance analysis,because they do not represent revenue earned from operations. Theoretically, any costs incurred to obtaindonor funds – “funding costs” should – should also be separated from other operating expenses, becausethe benefit <strong>of</strong> receiving the funds is not included.7. To make the adjustments, if an MFI has recorded donations to cover operational costs on the incomestatement as revenue earned, the amount should be reported below the net income line, resulting in areduction in operational revenue and, therefore, a reduction in the amount transferred to the balance sheetas current year net surplus (deficit). An <strong>of</strong>fsetting credit entry is made to the balance sheet in the accumulatedcapital – subsidy account (equity).Analysing Changes in Income StatementOne <strong>of</strong> the key tasks for the analyst is to isolate changes in the structure <strong>of</strong> the various income and expensesitems across two years. This trend analysis is a very useful technique for understanding where the MFI is todayand where it is headed tomorrow. In turn, such analysis will facilitate what on-course corrections are requiredand also enable MFI management to take suitable decisions that will enable the MFI to enhance its sustainabilityand expand out reach. Basically, such analysis involves calculating the proportion <strong>of</strong> income and expense itemsas a measure <strong>of</strong> the total income and expenses respectively.34
<strong>Financial</strong> Statements <strong>of</strong> a Micr<strong>of</strong>inance InstitutionTable 8 (b) – <strong>Sa</strong>mple Balance Sheet <strong>of</strong> an MFII II III IV VSl. No. Description Year Ending 31 st March2001 2002 2003ASSETSCurrent AssetsCash and DepositBS 1 Cash and bank current accounts 10,000 5,000 10,000BS 2 Interest-bearing deposits 4,000 14,000 16,000BS 3 Total Cash and Deposit 14,000 19,000 26,000Loan OutstandingBS 4 Regular 64,000 100,000 132,000BS 5 Past Due 40,000 39,000 34,000BS 6 Restructured 0 1,000 2,000BS 7 Gross Loans Outstanding 104,000 140,000 168,000BS 8 (Loan Loss Reserve) -10,000 -10,000 -14,000BS 9 Net Loans Outstanding 94,000 130,000 154,000BS 10 Other Current Assets 1,000 2,000 1,000BS 11 Total Current Assets 109,000 151,000 181,000Long-Term AssetsBS 12 Long Term Investments 16,000 22,000 25,000BS 13 Fixed Assets (Movable & Immovable) At Cost 6,000 8,000 8,000BS 14 (Accumulated Depreciation) -400 -600 -1,400BS 15 Net Fixed Assets 5,600 7,400 6,600BS 16 Total Long Term Assets 21,600 29,400 31,600BS 17 TOTAL ASSETS 130,600 180,400 212,600LIABILITIES AND NET WORTHCurrent LiabilitiesBS 18 Short-Term Borrowing (Commercial) 12,000 24,000 36,000BS 19 Short-Term Borrowing (Concessional) 0 0 0BS 20 Client <strong>Sa</strong>vings 0 0 0BS 21 Total Current Liabilities 12,000 24,000 36,000Long Term LiabilitiesBS 22 Long Term Debt (Commercial) 15,000 30,000 24,000BS 23 Long Term Debt (Concessional) 37,600 60,000 70,000BS 24 Restricted or Deferred Revenue & Expenses 0 0 0BS 25 Total Long Term Liabilities 52,600 90,000 94,000BS 26 Total Liabilities 64,600 114,000 130,000NET WORTHBS 27 Equity/Corpus/Loan Fund Capital 66,000 66,000 80,200BS 28 Retained Net Surplus/Deficit prior years 0 0 400BS 29 Net Surplus/Deficit current year 0 400 2,000BS 30 Total Net Worth 66,000 66,400 82,600BS 31 TOTAL LIABILITIES AND NETWORTH 130,600 180,400 212,60035
<strong>Tracking</strong> <strong>Financial</strong> <strong>Performance</strong> <strong>Standards</strong> <strong>of</strong> Micr<strong>of</strong>inance Institutions3.3 BALANCE SHEET – KEY DEFINITIONS AND INTERPRETATIONSThe balance sheet is a stock statement, which is a snapshot <strong>of</strong> the MFI at a moment in time. The statementreflects what the MFI owns and what is owed to it (assets), what it owes others (liabilities), and the differencebetween the two (equity or net assets).The Balance Sheet provides an instant picture <strong>of</strong> an organisation financial position in terms if where all fundshave been obtained from (sources <strong>of</strong> funds) and where all the funds have been used for (application <strong>of</strong> funds).The balance sheet uses the fundamental accounting equationSOURCES OF FUNDS = APPLICATION OF FUND<strong>Sa</strong>ndASSETS = OWN FUND + EXTERNAL LIABILITIESThe Balance Sheet items would now be elaborated to look into possible components under each head.3.3.1 Sources <strong>of</strong> Fund - Liabilities and Net Worth3.3.1.1 LiabilitiesLiabilities represent what is owed by the organisation to others either in the form <strong>of</strong> a cash commitment or asan obligation by the organisation to provide goods and services in the future.Current Liabilities1. Short-term Borrowing (commercial) – the outstanding amount, that the organisation owes to banksor other lenders for which it is paying a market rate <strong>of</strong> interest, and are due to be repaid within oneyear (refer BS 18, Table 8 b).2. Short-term Borrowing (concessional) – the outstanding amount that the organisation owes to banksor other lenders for which it is paying the lender a rate <strong>of</strong> interest below the market rate, and are dueto be repaid within one year (refer BS 19, Table 8 b).3. Client Deposits (Group <strong>Sa</strong>vings Deposits, Trust Fund, etc.) - both voluntary and forced client savingsthat are deposited with the organisation that it must return (refer BS 20, Table 8 b).LIABILITIES 2001 2002 2003Current LiabilitiesBS 18 Short-Term Borrowing (Commercial) 12,000 24,000 36,000BS 19 Short-Term Borrowing (Concessional Rate) 0 0 0BS 20 Client <strong>Sa</strong>vings 0 0 0BS 21 Total Current Liabilities 12,000 24,000 36,000Although a liability for the organisation, deposits are different from funds borrowed from a financialinstitution because there is normally no due date or amortisation schedule - fixed and recurring deposits,while they have a maturity date, are not structured by MFIs in the same manner as in banks. Therefore,while technically, they have to be returned on the date <strong>of</strong> maturity, they are <strong>of</strong>ten (required to be) extendedfor another term on a sequential basis. This, in effect is a double-edged sword that has an advantage as wellas disadvantage.36
<strong>Financial</strong> Statements <strong>of</strong> a Micr<strong>of</strong>inance InstitutionLong-Term Liabilities1. Long-term Debts (commercial rate) - The outstanding amount that the organisation owes to banksor other lenders for which it is paying a market rate <strong>of</strong> interest. Long-term debt is that portionwhich is due to be repaid in more than one year’s time (refer BS 22, Table 8 b).2. Long-term Debt (concessional rate) - the outstanding amount that the organisation owes to banksor other lenders for which it is paying the lender a rate <strong>of</strong> interest below the market rate (refer BS 23,Table 8 b).3. Other Liabilities include: Restricted Deferred Revenue, which are funds received, but restricted foruse in future years, are classified as a liability on the balance sheet, because they would have to bereturned to the funding organisations if the specified programmes were not carried out. The fundsare not recorded as revenue until the service or product is delivered. When the organisation receivesrestricted or deferred funds, it incurs an obligation (liability) to provide the services described in thegrant agreement. As the organisation provides the services (i.e., technical assistance or training tomicro entrepreneurs) it incurs expenses. Deferred revenue is then reflected as grant revenue andused to cover those expenses.Deferred expenditure - Likewise, outstanding expenses like salaries payable, providence fund payable,insurance payable are treated as liabilities, as the organisation will have to pay for such expenses in thefuture (refer BS 24, Table 8 b).LIABILITIES 2001 2002 2003Long Term LiabilitiesBS 22 Long Term Debt (Commercial) 15,000 30,000 24,000BS 23 Long Term Debt (Concessional) 37,600 60,000 70,000BS 24 Restricted or Deferred Revenue & Expenses 0 0 0BS 25 Total Long Term Liabilities 52,600 90,000 94,000Several key issues need to be articulated here and these are outlined below:1) Not all MFIs can acquire savings from clientele, as there is a legal restriction on savings deposits by theRBI. Another aspect here is that most MFIs treat savings not as a liability but rather as equity. This is notcorrect as savings deposits are strictly returnable to clients and hence, they ought to be treated as liability.2) MFIs must distinguish between long-term debt as commercial and subsidised, for this enable an analyst tounderstand its financial position, from a sustainability perspective. Interest rates less than the prime-lendingrate can be considered as subsidised and those equal to or greater than this rate (set by the RBI) can beregarded as commercial debt. In India, this cut-<strong>of</strong>f rate <strong>of</strong>ten fluctuates but for the purpose <strong>of</strong> Micr<strong>of</strong>inancethis can be taken as 12 percent annualised rate.3) Disclosure <strong>of</strong> the outstanding expenses is also very crucial because it tells an analyst about the futurecommitments <strong>of</strong> the MFI and makes the balance sheet more transparent4) In summary, all <strong>of</strong> the above are required as part <strong>of</strong> increasing the transparency and accountability <strong>of</strong> MFIsand they must acquire the culture to provide balance sheets in such fashion, which are based on international(global) best practices.37
<strong>Tracking</strong> <strong>Financial</strong> <strong>Performance</strong> <strong>Standards</strong> <strong>of</strong> Micr<strong>of</strong>inance Institutions3.3.1.2 Net WorthNet Worth is equal to the assets less the organisation’s liabilities. Net Worth is sometimes referred to as Equity,Fund Balance, or Net Assets. Unlike liabilities, the net worth <strong>of</strong> an organisation does not have to be repaid. Ittherefore represents the value <strong>of</strong> the organisation. Net worth might include capital contributions <strong>of</strong> investorsor donors, retained earnings, and current year surplus.1. Equity/Corpus/Capital – Equity represents what the investor has contributed. Corpus denotes the“capital’’ <strong>of</strong> the MFI. While MFIs registered as company would show capital in its proper name,corpus is the synonymous nomenclature used for MFIs registered as society or trust. For purpose <strong>of</strong>accounting and measurement <strong>of</strong> financial performance, corpus is equated with permanent capital.Sources <strong>of</strong> Capital include grants restricted and designated to be taken as capital, investor contributions,the proceeds <strong>of</strong> fund raising activities, and/or membership fees (refer BS 27, Table 8 b).2. Net Retained Surplus/Deficit prior years - the amount <strong>of</strong> income (or loss) accumulated since theformation <strong>of</strong> the organisation. It may also be referred to as undistributed pr<strong>of</strong>its or earned surplus(refer BS 28, Table 8 b).3. Net Surplus/Deficit current year - the amount <strong>of</strong> income (or loss) generated in the current year (referBS 29, Table 8 b).NET WORTH 2001 2002 2003BS 27 Equity/Corpus/Loan Fund Capital 66,000 66,000 80,200BS 28 Retained Net Surplus/Deficit prior years 0 0 400BS 29 Net Surplus/Deficit current year 0 400 2,000BS 30 Total Net Worth 66,000 66,400 82,600Ideally reserve also is part <strong>of</strong> Net Worth, but for fairer representation <strong>of</strong> the balance sheet, it is taken as anegative asset. In MFI, generally two types <strong>of</strong> Reserves are created: (i) Specific reserves -created for some specialpurpose (loan loss reserve is most common reserve for an MFI), whereas, (ii) General reserve - created for anynature <strong>of</strong> future use.Any impact <strong>of</strong> delinquency/other losses will directly affect the net worth <strong>of</strong> an MFI. Therefore, if de-capitalisationis occurring one must look at the causes and attempt to control or mitigate or eradicate these.3.3.2 Application <strong>of</strong> Fund - AssetsIn the previous section we discuss about representation <strong>of</strong> “sources <strong>of</strong> fund” in the balance sheet, in this sectionwe will discuss about “application <strong>of</strong> funds”, the other part <strong>of</strong> balance sheet, i.e. ‘Assets’.Assets represent what is owned by the organisation or owed to it. They are those items in which an organisationhas invested its funds for the purpose <strong>of</strong> generating future receipts <strong>of</strong> resources. They may be either current(short term) or long term by nature <strong>of</strong> their life and utility within the organisation. Assets are divided into twocategories, namely (1) Current, and (2) Long-Term.3.3.2.1 Current AssetsCurrent assets include cash and deposits (marketable securities), accounts receivable, and inventories i.e. assets,which in the normal course <strong>of</strong> business will be turned into cash within a year. As per best practices norms,between 75% - 77% <strong>of</strong> the total assets in current assets is considered as optimal.38
<strong>Financial</strong> Statements <strong>of</strong> a Micr<strong>of</strong>inance InstitutionThe components <strong>of</strong> Current Assets are dealt below:a) Cash in Hand and Bank Current AccountsAll balances available with the MFI instantly/on demand such as cash in safe or with bank in currentaccount or any non- interest bearing deposit are classified under this head. (refer BS 1, Table 8 b).b) Interest bearing depositsFunds on deposit with any financial institution, with a term <strong>of</strong> less than one year, which are earninginterest income for the MFI (refer BS 2, Table 8 b).c) Loans outstandingThis is the most important income-generating asset for an MFI. It is also called as ‘loan portfolio’. This isbecause, in common parlance <strong>of</strong> Micr<strong>of</strong>inance, the main source <strong>of</strong> revenue comes from ‘lending’ to clients.Greater the micro-loans provided by the MFI, the higher its income (all other things being equal) and thegreater the loans provided, the higher the loans outstanding.As in case <strong>of</strong> sources <strong>of</strong> funds, loans given by the MFI need careful examination. In the sense that someloans may have repayment portion exceeding next one year and hence need to be treated separately as longterm. All other loan-portions falling due for collection in next one year are “current’’.For convenience <strong>of</strong> understanding, if all loans are short term in nature, there are three sub-categorieswithin this broad category <strong>of</strong> loans outstanding – Namely, Regular loans outstanding, Past due loansoutstanding and Re-structured loans outstanding. Let’s take a look into the details <strong>of</strong> each <strong>of</strong> these subcategories.• Regular Loans Outstanding - the total amount <strong>of</strong> loans outstanding at a point in time that are regular,i.e., with no late payments or defaults (refer BS 4, Table 8 b).• Past-Due Loans Outstanding - the total amount <strong>of</strong> loans outstanding which have amount past due.In other words, it represents outstanding balance <strong>of</strong> all overdue loans (refer BS 5, Table 8 b).There is another aspect that requires clarification with regard to past due loans. In strict accountingparlance, any loan, which has even a single (installment) payment over due for (just) a day, should beclassified as a past due loanHowever, MFIs may have their own norms with regard to this aspect and consequently, this could varyon a case-by-case basis. But, best practices recommend that, if a payment on a loan due on a certaindate is not paid by that date, then that loan should be classified as a past due loan.• Restructured Loans outstanding - Outstanding loans in which original terms are re-negotiated (referBS 6, Table 8 b). There are two cases here: loans can be either refinanced or rescheduled.Current Assets 2001 2002 2003Cash and DepositBS 1 Cash and bank current accounts 10,000 5,000 10,000BS 2 Interest-bearing deposits 4,000 14,000 16,000BS 3 Total Cash and Deposit 14,000 19,000 26,000Loan OutstandingBS 4 Regular 64,000 100,000 132,000BS 5 Past Due 40,000 39,000 34,000BS 6 Restructured 0 1,000 2,000BS 7 Gross Loans Outstanding 104,000 140,000 168,00039
<strong>Tracking</strong> <strong>Financial</strong> <strong>Performance</strong> <strong>Standards</strong> <strong>of</strong> Micr<strong>of</strong>inance InstitutionsRescheduling an outstanding loan involves changing the payment period and/or the size <strong>of</strong> payments.Refinancing a loan involves developing a new loan agreement before a previous one is completed. It caninclude increases in the principal amount, extension <strong>of</strong> the loan term, etc.Restructuring <strong>of</strong> loan is usually done so that a borrower is no longer in arrears. Best practices suggest thatsuch restructuring <strong>of</strong> loans is better avoided and discouraged as it results in the appearance <strong>of</strong> a “healthy”portfolio when in fact, restructured loans (and portfolio) indeed remain risky.Best practices strongly recommend this bifurcation to ensure transparency with regard to level <strong>of</strong> risk in anMFI.d) Loan Loss ReserveTo <strong>of</strong>fset the risk (<strong>of</strong> loss) in loan portfolio, best practices recommend that MFI should establish a loan lossreserve. (See section 4.2.1 in chapter 4 for further detail). Hence, Loan Loss Reserve is the amount set asidethrough accounting entry to recognise probable future loan losses in an MFI’s loan portfolio so that thetrue value <strong>of</strong> the loan portfolio is fairly stated (refer BS 8, Table 8 b).e) Net Loans OutstandingThe amount <strong>of</strong> loan loss expense is recorded on the Balance Sheet as a negative asset (Loan Loss Reserve),reducing the gross outstanding loan balance. It results in a figure called as the Net Loans Outstanding. Itis the sum <strong>of</strong> all loan balances still owed to the organisation, that is, all loans disbursed and not yet repaidor written <strong>of</strong>f, net <strong>of</strong> any loan loss reserve. Best practices suggest that the net loans outstanding shouldaccount for at least two-third <strong>of</strong> the total assets.Loan Outstanding 2001 2002 2003BS 4 Regular 64,000 100,000 132,000BS 5 Past Due 40,000 39,000 34,000BS 6 Restructured 0 1,000 2,000BS 7 Gross Loans Outstanding 104,000 140,000 168,000BS 8 (Loan Loss Reserve) -10,000 -10,000 -14,000BS 9 Net Loans Outstanding 94,000 130,000 154,000Rationale for creating Loan Loss Reserve – When the Reserve is created (or adjusted), a loan loss expense(referred to as the Provision for Loan Losses) is recorded on the Income Statement as an expense. The amount<strong>of</strong> loan loss provision is then recorded as the negative asset - loan loss reserve and each year the amountprovisioned under loan loss gets accumulated under loan loss reserve. This negative asset reduces the netoutstanding loan portfolio. (Process <strong>of</strong> accounting entries for provisioning, reserve and write-<strong>of</strong>fs is given in detailsin section 4.2.3 in chapter 4).In case <strong>of</strong> actual loan losses, or write-<strong>of</strong>fs, it gets reflected as a reduction <strong>of</strong> the Loan Loss reserve and the GrossLoans Outstanding on the Balance Sheet (and not on the Income Statement). The resultant effect is to leavethe Net Portfolio on the Balance Sheet unchanged since the reserve has already been made (see graphicalrepresentation given at the end <strong>of</strong> section 4.2.3 in chapter 4).• If the Loan loss reserve is too low relative to the value <strong>of</strong> loans to be written <strong>of</strong>f, then both the Loan LossReserve and the Provision for Loan Losses (on the Income Statement) first need to be increased and thenthe loans can be written <strong>of</strong>f.40
<strong>Financial</strong> Statements <strong>of</strong> a Micr<strong>of</strong>inance Institution• It is to be noted here that all <strong>of</strong> the loans outstanding amounts reflect only the principal due, not theinterest (which is generally income statement item).• When interest is due but not received, there is a procedure by which this (due) interest is accrued andreflected on the balance sheet under accounts receivable (as accrued interest) as shown below.f) Other Current AssetsItems, such as accounts receivable (accrued interest, fees, etc.) and prepaid expenses (rent, insurance, salaryadvances, etc.) are clubbed under other current assets. Accrued interest (receivable) is one item that deservesattention from a best practices perspective.Consider an MFI, following accrual system <strong>of</strong> accounting also applies the accrual principle to interest income.So the interest is accounted as income irrespective <strong>of</strong> whether it has been received or not. But the interestthat is due and has not been received, if it gets into the income statement, it should be accounted for in theBalance Sheet as well. This is because when interest that is due is received, the accounting entries are:• Credit - Income• Debit - CashHowever, when interest due is not received but recorded in the income statement, the accounting entries will be:• Credit - Income• Debit - ????????? (Cash can’t be debited, as interest has not been received)As per fundamental accounting equation (Assets = Liabilities + Equity)Now, when interest due is not received but it has been recorded in the income statement, this entry gets intothe balance sheet on the equity side through net surplus (or deficit).And according to the fundamental accounting, there must be a balancing entry on the asset side. Therefore,this balancing entry in the balance sheet (when interest is due and has not been received and is also recorded inthe income statement) is called as accrued interest.Thus, when interest is due and not received and also when it is recorded in the income statement as income, theentries are:• Credit - Income• Debit - Accrued Interest (asset under accounts receivable)And when this income is realized, the corresponding entries are:• Credit - Accrued Interest• Debit - CashAnd when Accrued Interest is Written-<strong>of</strong>f along with principal outstanding, the corresponding entries are:• Credit - Accrued Interest (reduces asset)• Debit - Capital Reserve or Corpus (reduces equity)If written-<strong>of</strong>f accrued interest is collected, then, the corresponding accounting entries are:• Credit - Miscellaneous Income• Debit - Cash41
<strong>Tracking</strong> <strong>Financial</strong> <strong>Performance</strong> <strong>Standards</strong> <strong>of</strong> Micr<strong>of</strong>inance Institutions3.3.2.2 Long-Term AssetsLong-term assets represent those assets not readily redeemable as cash. Basically, there are two kinds <strong>of</strong> longtermassets – (a) investments or receivables held for longer than one year, and (b) fixed assets, such as land,buildings, machinery, equipment, furniture, automobiles, etc.a) Long-term InvestmentsInvestments not intended as a ready source <strong>of</strong> cash such as long term fixed deposits, stocks, bonds andpromissory notes that are held for more than one year are classified as long-term investments.b) Fixed AssetsFixed assets usually refer to property and equipment, such as land, buildings, machinery, furniture,automobiles, etc. They are recorded at their acquisition cost – i.e., the historical cost at which they werebought.c) Accumulated DepreciationThis represents the sum <strong>of</strong> depreciation expenses recorded in the current and previous fiscal periods.Depreciation represents gradual decrease in value <strong>of</strong> fixed assets. The common methods for calculatingdepreciation are the straight-line method and the declining balance method. For financial analysis anyfrequent change in depreciation method is an area <strong>of</strong> concern.Long-Term Assets 2001 2002 2003BS 12 Long Term Investments 16,000 22,000 25,000BS 13 Fixed Assets (Movable & Immovable) At Cost 6,000 8,000 8,000BS 14 (Accumulated Depreciation) -400 -600 -1,400BS 15 Net Fixed Assets 5,600 7,400 6,600BS 16 Total Long Term Assets 21,600 29,400 31,600Analysing changes in the Balance Sheet StructureOne <strong>of</strong> the key tasks for the analyst is to isolate changes in the structure <strong>of</strong> the various asset and liability itemsacross two years. This trend analysis is a very useful technique for understanding where the MFI is today andwhere it is headed tomorrow. In turn, such analysis will facilitate what on-course corrections are required andalso enable MFI management to take suitable decisions that will enable the MFI to enhance its sustainabilityand expand out reach.Basically, such analysis involves calculating the proportion <strong>of</strong> asset and liability items as a measure <strong>of</strong> the totalassets and liabilities respectively.42
<strong>Financial</strong> Statements <strong>of</strong> a Micr<strong>of</strong>inance Institution3.4 COST ALLOCATION – KEY ISSUES FOR PREPARING FINANCIAL STATEMENTSA number <strong>of</strong> institutions that provide Micr<strong>of</strong>inance services also <strong>of</strong>fer a range <strong>of</strong> non-financial services, such asbusiness development services (training & technical assistance to micro entrepreneurs) and training in areaslike literacy, health, natural resource management etc. Usually the consolidated financial statements <strong>of</strong> suchmulti-service organisations contain financial data pertaining to all activities undertaken by the organisation.Assessing financial performance and sustainability <strong>of</strong> Micr<strong>of</strong>inance operation <strong>of</strong> a multi-service organisationfrom its consolidated financial statements would become rather difficult. Though Micr<strong>of</strong>inance is being carriedout with developmental agenda, the activity per se is commercial. Unlike other traditional developmentalprogramme, in this activity, there is two-way flow <strong>of</strong> money – money is given or taken as credit or deposit to orfrom the poor and also it is repaid in the form <strong>of</strong> money. Therefore, the financial services should be treated asdistinct cost centres vis-à-vis non-financial services in an MFI’s accounts.The following points provides a summary <strong>of</strong> the key issues in preparing financial statements for multi-serviceorganisations who also undertake Micr<strong>of</strong>inance programme:• Before embarking on a cost allocation exercise, MFI managers must first decide which services <strong>of</strong>fered, ifany, can be considered functionally separate from the provision <strong>of</strong> financial services. In other words, theymust answer the question <strong>of</strong> “to what extent are the non-financial services integral to the success <strong>of</strong> the Micr<strong>of</strong>inanceprogramme?”• In some Micr<strong>of</strong>inance programmes, the provision <strong>of</strong> skills and literacy training, for instance, is consideredvital to core elements <strong>of</strong> the Micr<strong>of</strong>inance methodology, such as group development and cohesion. In thesecases, non-financial services may be seen as directly contributing to good credit/savings behaviour, particularlyin programmes serving extremely poor clients. This sense <strong>of</strong> “non-separability” may pertain particularly incases where credit <strong>of</strong>ficers are charged with providing training and where on-site technical assistance isinseparable from credit supervision.• Cost allocation is appropriate for MFIs that <strong>of</strong>fer non-financial services on a voluntary basis Therefore, ifnon-financial services are considered an integral part <strong>of</strong> the Micr<strong>of</strong>inance or lending methodology, then costallocation between financial & non-financial services may not be warranted since the MFI implicitly orexplicitly considers these services as part <strong>of</strong> the Micr<strong>of</strong>inance methodology and cost. On the other hand, ifnon-financial services are thought to be complementary (but not necessary) to the successful delivery <strong>of</strong>financial services, cost allocation is recommended. However, MFIs interested in exploring the possibility <strong>of</strong>changing their approach and <strong>of</strong>fering these services on a voluntary basis may wish to conduct a costallocation exercise to guide their planning process.• Some MFIs recognise that the provision <strong>of</strong> non-financial services may require ongoing subsidies, particularlythose services with a “social” character like health and literacy training. They <strong>of</strong>ten approach internationaldonors or national funding agencies for separate financing <strong>of</strong> these services. This financing may or may notbe combined with a fee charged to clients to help cover the costs <strong>of</strong> delivering the service. Other MFIsexpect that these social activities will be financed with income and fees earned from the provision <strong>of</strong>financial services. Such MFIs may charge a separate commission on loans or otherwise integrate the cost <strong>of</strong>providing non-financial services into the effective interest rate on financial services.• MFIs that fund their non-financial services separately, either through donations or fees or some combination<strong>of</strong> the two, are likely to view these services as separate “cost centers”. These MFIs are good candidates forcost allocation.43
<strong>Tracking</strong> <strong>Financial</strong> <strong>Performance</strong> <strong>Standards</strong> <strong>of</strong> Micr<strong>of</strong>inance Institutions• MFIs that expect their financial services to cross-subsidise their non-financial services may see the value incost allocation so they can understand exactly what portion <strong>of</strong> their income from financial services goestoward covering the costs <strong>of</strong> non-financial services. Similarly, MFIs that charge a dedicated fee on theirloans to cover a specific non-financial service may wish to verify that the fee actually covers the relevantcosts.• Non-financial services may represent a marginal activity to MFIs. If non-financial services make up a verysmall proportion <strong>of</strong> total costs and institutional effort, a complicated cost allocation exercise is probablynot necessary. No fixed standard <strong>of</strong> materiality can be applied to all cases. However, MFIs with less than 10percent <strong>of</strong> their costs attributable to non-financial services should consider whether they need anythingbeyond the simplest cost allocation exercise.When costs related to non-financial services have to be allocated, the SIMPLE procedure given below is suggestedto be followed. Complicated cost allocation exercises are avoided because, as experience indicates, the additionality<strong>of</strong> such an exercise is really minimal.1. First, identify what the non-financial services are and ask the question as to whether they are compulsoryand an inevitable part <strong>of</strong> Micr<strong>of</strong>inance.2. If they are integral (compulsory) part <strong>of</strong> Micr<strong>of</strong>inance services, then NO cost allocation is necessary.3. If they are not an integral part <strong>of</strong> Micr<strong>of</strong>inance services (i.e., not compulsory) then determine what costscan be attributed to them?4. If they exceed 10 percent then a Simple cost allocation may be warranted5. Assuming that cost allocation is to be done, first determine, what are the resources used to the variousactivities that constitute Micr<strong>of</strong>inance?The major resources are:(a) Fixed Assets – Immovables (land and building)(b) Fixed Assets – Movables (vehicles)(c) Fixed Assets – Equipment (computers etc)(d) Human Resources – Staff(e) <strong>Financial</strong> Resources(f) Other Resources6. This requires that the MFI identify all activities related to Micr<strong>of</strong>inance – which <strong>of</strong> course would vary withthe methodology. An example is given in the Box below7. For each activity, determine, if any resource, not part <strong>of</strong> the Micr<strong>of</strong>inance programme, is used. If yes,identify the resource and attribute a cost value to it.8. For fixed assets (immovables), like shared <strong>of</strong>fice space, some MFIs use the square feet approach to allocaterental costs (based on the going market rate in the area). This is fairly simple and accurate.9. Steps for this would include:(a) Identifying the actual measurement <strong>of</strong> <strong>of</strong>fice space in Square Feet(b) Multiplying it by the rental per square feet per month for all months in a year based on the localmarket conditions(c) Adding the cost <strong>of</strong> borrowing money to make the deposit that would have been paid, if it were actuallya rental44
<strong>Financial</strong> Statements <strong>of</strong> a Micr<strong>of</strong>inance Institution(d) Adding utilities as per usage based on the square feet, <strong>of</strong> course taking into account the actual usage.Some MFI have even added a sub-metres to track utilities like electricity and make accurate paymentswith regard to these.10. For fixed asset movables, like motorcycles, the actual usage could be discussed from a log book <strong>of</strong> travelrecords kept with regard to the vehicles.11. A fair rental value, (based on local market) and actual fuel costs based on the log <strong>of</strong> usage could beallocated. The normal going mileage per litre <strong>of</strong> fuel can be assumed here.12. For equipment like computers, again fair rental value (based on local market) could be allocated.13. The key issue is that when ownership <strong>of</strong> fixed assets lies with other (non-financial service providers) legalentities/projects, then, allocating costs based on fair market rental value is what is appropriate.14. Likewise, human resources (staff) costs could be allocated on the time that these non-micr<strong>of</strong>inance staffspend for Micr<strong>of</strong>inance activity15. This entails that these staff track their time spent on Micr<strong>of</strong>inance in terms <strong>of</strong> hours/day and the monthwisetotal time spent by them can then be obtained by summing up each day’s total. Then, one as outlinedbelow can allocate accurate staff indirect costs. This is done in the following manner.16. For each staff determine their gross remuneration per hour or day (8 hours in a day) and multiply this bythe number <strong>of</strong> hours allocated to Micr<strong>of</strong>inance. While calculating the cost/hour, please use a consistentstandard appropriate to the staff position and also to the organisations’ human resources policies.17. For instance if the human resources policy states that working 8 hours/day for 25 days a month entitlesthem to a gross monthly compensation <strong>of</strong> Y Rupees, then per hour costs would be:25 days X 8 hours Y Rupees1 hour Y Rupees20018. If this standard varies by position, then the appropriate figures must be used.19. Once the per hour cost is determined for all staff positions, then allocating indirect staff costs is fairly easyas shown below.Sl. No. Staff position Actual time spentduring monthCost per hourTotal monthly cost(in Rs)1 A 1B 1Hours C 1Rs B 1C 12 A 2B 2Hours C 2Rs B 2C 23 A 3B 3Hours C 3Rs B 3C 3...n A nB nHours C nRs B nC nTotal All Positions NA NA B 1C 1+B 2C 2+ B 3C 3+…. B nC n45
<strong>Tracking</strong> <strong>Financial</strong> <strong>Performance</strong> <strong>Standards</strong> <strong>of</strong> Micr<strong>of</strong>inance Institutions20. The same can be done for all months and brought into the income statement. Indirect staff costs allocated,which, if not tracked is akin to a hidden/unreported subsidy.21. If any financial resources are borrowed or received as a grant from non-financial service departments, thesame adjustments as made for concessional borrowings and/or grants for loan fund capital must be donehere.22. Once all these adjustments are done, then the cost allocation is complete and helps present a more accuratefinancial picture <strong>of</strong> the MFI.It is to be noted that while cost allocation may seem to be a tedious exercise, it is very necessary, especially,if non-financial services constitute > 10% <strong>of</strong> the total turnover.46
CONSTRUCTING LOAN REPAYMENTSCHEDULE, AGING SCHEDULE ANDLOAN PORTFOLIO REPORT FOR AN MFI47
<strong>Tracking</strong> <strong>Financial</strong> <strong>Performance</strong> <strong>Standards</strong> <strong>of</strong> Micr<strong>of</strong>inance Institutions48
Constructing Loan Repayment Schedule Aging Schedule and Loan Portfolio Report for an MFIChapter4CONSTRUCTING LOAN REPAYMENT SCHEDULE, AGINGSCHEDULE AND LOAN PORTFOLIO REPORT FOR AN MFIThe two statutory financial statements viz. Balance Sheet and Income & Expenditure Statement have beenunderstood in detail in the earlier chapter. Now the other dimensions need to be discussed in same spirit. Inthis chapter, we will deal with construction <strong>of</strong> Loan Ledger, classifying the loans as per their performance and basedon that construction <strong>of</strong> Loan Portfolio Report <strong>of</strong> an MFI.4.1 LOAN LEDGER AND REPAYMENT SCHEDULEFor an MFI, (a) Individual Loan Ledger, (see Table 9, 10 & 11) and (b) Aggregated Loan Ledger (see Table 12) are thebackbone <strong>of</strong> all financial transaction recorded in the organisation. These two are among the most important documentsin any MFI and their proper and timely maintenance is must.Loan ledger <strong>of</strong> an MFI is basically repayment schedule <strong>of</strong> loan outstanding that keeps record <strong>of</strong> repayment <strong>of</strong> loanand its various status. Before disbursement <strong>of</strong> loan, the terms must be finalised (and recorded) and made very clearto the client with regard to:(a) Loan Disbursed Amount(b) Disbursement Date(c) Loan Term in Number <strong>of</strong> Installments – 10, 20, 30 etc.(d) Frequency <strong>of</strong> Repayment <strong>of</strong> Installment – Weekly, Monthly etc. must be clearly stated(e) Due Date for 1 st Installment – exactly 1 week or month from date <strong>of</strong> disbursement OR any specified datein a month (like on the day <strong>of</strong> group meeting or last/first day <strong>of</strong> each month) OR if any grace/moratoriumperiod exists it needs to be mentioned upfront (for example, an MFI is following a policy where month endis considered as due date <strong>of</strong> loan repayment. A loan was disbursed on January 21, 2002. As per the policy<strong>of</strong> MFI, the first installment should be due on January 31, 2002, which is only 10 days after the disbursement.However, in this case, the MFI give a grace period <strong>of</strong> one month to the borrower. It means that thefirst installment is now due on the last date <strong>of</strong> February 2002, instead <strong>of</strong> end <strong>of</strong> January 2002).(f) Sequence <strong>of</strong> Payment – which is to be taken first. The suggested sequence is Interest Overdues, InterestDue, Principal Overdues and Principal(g) Definition <strong>of</strong> Overdues - When does a loan become overdue or pastdue is an aspect that must be clearlyspecified. It is suggested that the day after an amount is due, the amount if not paid becomes overdue. Suchas, if on April 30, 2002, an amount <strong>of</strong> Rs. 100 is due and it is not paid, then, on May 1,2002, this amountis in arrears or overdueHaving understood that loan terms need to be defined upfront, now we will try to understand the process <strong>of</strong> construction<strong>of</strong> individual loan ledger through an illustrative example. Please look at the Key data/facts given below:Loan Amount Disbursed (Rs.) 1000Disbursement Date 23/7/2002Number <strong>of</strong> Installments 50Weeks in a Year 52Interest15% per annumMethod <strong>of</strong> Interest CalculationFlatTotal Interest (Rs.) 144.23 {1000 * (15/100) * (50/52)}Interest per Installment 2.88 (144.23/50)Interest Rounded-<strong>of</strong>f to nearest whole no. (Rs.) 3.00Principal to be paid per Installment (Rs.) 20 (1000/50)Now, based on the above information, a repayment schedule is drawn – See Table 9 (next 2 pages).49
<strong>Tracking</strong> <strong>Financial</strong> <strong>Performance</strong> <strong>Standards</strong> <strong>of</strong> Micr<strong>of</strong>inance InstitutionsTable 9 - Loan Repayment Schedule with FLAT Rate <strong>of</strong> InterestI II III IV V VI VII VIII IX X XI XII XIII XIV XV XVI XVII XVIIIInstl.No.Prin.DueCumPrin.DueInt. Dueas PerScheduleDate DueInt. Dueas perpaymentAmountPaidInt.PaidPrin.PaidDate Paid OD ProcessDateCum Prin.PaidPrin.PrepaidPrin.Outstanding Interest OD Prin. ODAge <strong>of</strong>ODOD Settled1 20.00 20 3.00 7/30/2002 3.00 23.00 3.0 20.00 7/30/2002 7/31/2002 20.00 0 980.00 0.00 0.00 0 No OD2 20.00 40 3.00 8/6/2002 3.00 23.00 3.0 20.00 8/6/2002 8/7/2002 40.00 0 960.00 0.00 0.00 0 No OD3 20.00 60 3.00 8/13/2002 3.00 23.00 3.0 20.00 8/13/2002 8/14/2002 60.00 0 940.00 0.00 0.00 0 No OD4 20.00 80 3.00 8/20/2002 3.00 23.00 3.0 20.00 8/20/2002 8/21/2002 80.00 0 920.00 0.00 0.00 0 No OD5 20.00 100 3.00 8/27/2002 3.00 23.00 3.0 20.00 8/27/2002 8/28/2002 100.00 0 900.00 0.00 0.00 0 No OD6 20.00 120 3.00 9/3/2002 3.00 23.00 3.0 20.00 9/3/2002 9/4/2002 120.00 0 880.00 0.00 0.00 0 No OD7 20.00 140 3.00 9/10/2002 3.00 23.00 3.0 20.00 9/10/2002 9/11/2002 140.00 0 860.00 0.00 0.00 0 No OD8 20.00 160 3.00 9/17/2002 3.00 23.00 3.0 20.00 9/17/2002 9/18/2002 160.00 0 840.00 0.00 0.00 0 No OD9 20.00 180 3.00 9/24/2002 3.00 23.00 3.0 20.00 9/24/2002 9/25/2002 180.00 0 820.00 0.00 0.00 0 No OD10 20.00 200 3.00 10/1/2002 3.00 23.00 3.0 20.00 10/1/2002 10/2/2002 200.00 0 800.00 0.00 0.00 0 No OD11 20.00 220 3.00 10/8/2002 3.00 23.00 3.0 20.00 10/8/2002 10/9/2002 220.00 0 780.00 0.00 0.00 0 No OD12 20.00 240 3.00 10/15/2002 3.00 23.00 3.0 20.00 10/15/2002 10/16/2002 240.00 0 760.00 0.00 0.00 0 No OD13 20.00 260 3.00 10/22/2002 3.00 23.00 3.0 20.00 10/22/2002 10/23/2002 260.00 0 740.00 0.00 0.00 0 No OD14 20.00 280 3.00 10/29/2002 3.00 23.00 3.0 20.00 10/29/2002 10/30/2002 280.00 0 720.00 0.00 0.00 0 No OD15 20.00 300 3.00 11/5/2002 3.00 23.00 3.0 20.00 11/5/2002 11/6/2002 300.00 0 700.00 0.00 0.00 0 No OD16 20.00 320 3.00 11/12/2002 3.00 23.00 3.0 20.00 11/12/2002 11/13/2002 320.00 0 680.00 0.00 0.00 0 No OD17 20.00 340 3.00 11/19/2002 3.00 23.00 3.0 20.00 11/19/2002 11/20/2002 340.00 0 660.00 0.00 0.00 0 No OD18 20.00 360 3.00 11/26/2002 3.00 23.00 3.0 20.00 11/26/2002 11/27/2002 360.00 0 640.00 0.00 0.00 0 No OD19 20.00 380 3.00 12/3/2002 3.00 23.00 3.0 20.00 12/3/2002 12/4/2002 380.00 0 620.00 0.00 0.00 0 No OD20 20.00 400 3.00 12/10/2002 3.00 23.00 3.0 20.00 12/10/2002 12/11/2002 400.00 0 600.00 0.00 0.00 0 No OD21 20.00 420 3.00 12/17/2002 3.00 23.00 3.0 20.00 12/17/2002 12/18/2002 420.00 0 580.00 0.00 0.00 0 No OD22 20.00 440 3.00 12/24/2002 3.00 23.00 3.0 20.00 12/24/2002 12/25/2002 440.00 0 560.00 0.00 0.00 0 No OD23 20.00 460 3.00 12/31/2002 3.00 23.00 3.0 20.00 12/31/2002 1/1/2003 460.00 0 540.00 0.00 0.00 0 No OD24 20.00 480 3.00 1/7/2003 3.00 23.00 3.0 20.00 1/7/2003 1/8/2003 480.00 0 520.00 0.00 0.00 0 No OD25 20.00 500 3.00 1/14/2003 3.00 23.00 3.0 20.00 1/14/2003 1/15/2003 500.00 0 500.00 0.00 0.00 0 No OD26 20.00 520 3.00 1/21/2003 3.00 23.00 3.0 20.00 1/21/2003 1/22/2003 520.00 0 480.00 0.00 0.00 0 No OD27 20.00 540 3.00 1/28/2003 3.00 23.00 3.0 20.00 1/28/2003 1/29/2003 540.00 0 460.00 0.00 0.00 0 No OD28 20.00 560 3.00 2/4/2003 3.00 23.00 3.0 20.00 2/4/2003 2/5/2003 560.00 0 440.00 0.00 0.00 0 No ODContd. next page50
Constructing Loan Repayment Schedule Aging Schedule and Loan Portfolio Report for an MFITable 9 - Loan Repayment Schedule with FLAT Rate <strong>of</strong> InterestI II III IV V VI VII VIII IX X XI XII XIII XIV XV XVI XVII XVIIIInstl.No.Prin.DueCumPrin.DueInt. Dueas PerScheduleDate DueInt. Dueas perpaymentAmountPaidInt.PaidPrin.PaidDate Paid OD ProcessDateCum Prin.PaidPrin.PrepaidPrin.Outstanding Interest OD Prin. ODAge <strong>of</strong>ODOD Settled29 20.00 580 3.00 2/11/2003 3.00 23.00 3.0 20.00 2/11/2003 2/12/2003 580.00 0 420.00 0.00 0.00 0 No OD30 20.00 600 3.00 2/18/2003 3.00 23.00 3.0 20.00 2/18/2003 2/19/2003 600.00 0 400.00 0.00 0.00 0 No OD31 20.00 620 3.00 2/25/2003 3.00 23.00 3.0 20.00 2/25/2003 2/26/2003 620.00 0 380.00 0.00 0.00 0 No OD32 20.00 640 3.00 3/4/2003 3.00 23.00 3.0 20.00 3/4/2003 3/5/2003 640.00 0 360.00 0.00 0.00 0 No OD33 20.00 660 3.00 3/11/2003 3.00 23.00 3.0 20.00 3/11/2003 3/12/2003 660.00 0 340.00 0.00 0.00 0 No OD34 20.00 680 3.00 3/18/2003 3.00 23.00 3.0 20.00 3/18/2003 3/19/2003 680.00 0 320.00 0.00 0.00 0 No OD35 20.00 700 3.00 3/25/2003 3.00 23.00 3.0 20.00 3/25/2003 3/26/2003 700.00 0 300.00 0.00 0.00 0 No OD36 20.00 720 3.00 4/1/2003 3.00 23.00 3.0 20.00 4/1/2003 4/2/2003 720.00 0 280.00 0.00 0.00 0 No OD37 20.00 740 3.00 4/8/2003 3.00 23.00 3.0 20.00 4/8/2003 4/9/2003 740.00 0 260.00 0.00 0.00 0 No OD38 20.00 760 3.00 4/15/2003 3.00 23.00 3.0 20.00 4/15/2003 4/16/2003 760.00 0 240.00 0.00 0.00 0 No OD39 20.00 780 3.00 4/22/2003 3.00 23.00 3.0 20.00 4/22/2003 4/23/2003 780.00 0 220.00 0.00 0.00 0 No OD40 20.00 800 3.00 4/29/2003 3.00 0.00 0.0 0.00 Not Paid 4/30/2003 780.00 0 220.00 3.00 20.00 1 OD Not Paid41 20.00 820 3.00 5/6/2003 3.00 0.00 0.0 0.00 Not Paid 5/7/2003 780.00 0 220.00 6.00 40.00 8 OD Not Paid42 20.00 840 3.00 5/13/2003 3.00 0.00 0.0 0.00 Not Paid 5/14/2003 780.00 0 220.00 9.00 60.00 15 OD Not Paid43 20.00 860 3.00 5/20/2003 3.00 0.00 0.0 0.00 Not Paid 5/21/2003 780.00 0 220.00 12.00 80.00 22 OD Not Paid44 20.00 880 3.00 5/27/2003 3.00 0.00 0.0 0.00 Not Paid 5/28/2003 780.00 0 220.00 15.00 100.00 29 OD Not Paid45 20.00 900 3.00 6/3/2003 3.00 0.00 0.0 0.00 Not Paid 6/4/2003 780.00 0 220.00 18.00 120.00 36 OD Not Paid46 20.00 920 3.00 6/10/2003 3.00 0.00 0.0 0.00 Not Paid 6/11/2003 780.00 0 220.00 21.00 140.00 43 OD Not Paid47 20.00 940 3.00 6/17/2003 3.00 0.00 0.0 0.00 Not Paid 6/18/2003 780.00 0 220.00 24.00 160.00 50 OD Not Paid48 20.00 960 3.00 6/24/2003 3.00 0.00 0.0 0.00 Not Paid 6/25/2003 780.00 0 220.00 27.00 180.00 57 OD Not Paid49 20.00 980 3.00 7/1/2003 3.00 0.00 0.0 0.00 Not Paid 7/2/2003 780.00 0 220.00 30.00 200.00 64 OD Not Paid50 20.00 1000 3.00 7/8/2003 3.00 0.00 0.0 0.00 Not Paid 7/9/2003 780.00 0 220.00 33.00 220.00 71 OD Not PaidTotal 1000.00 150.00 NA 150.00 897.00 117.0 780.0051
<strong>Tracking</strong> <strong>Financial</strong> <strong>Performance</strong> <strong>Standards</strong> <strong>of</strong> Micr<strong>of</strong>inance InstitutionsExplanation <strong>of</strong> the Repayment Schedule (table-9) is given below:1. Column I <strong>of</strong> the schedule gives the installment number from 1 to 502. Column II is the principal due as per loan agreement – Rs. 20 per week3. Column III is the cumulative principal due. Take for example, Installment No 5. When the 5 th installmentis due, 5 weeks X 20 principal per week would have become due. The cumulative principal due is 100 asgiven in column III corresponding to installment 5.4. The Interest due as per schedule is 3.00 per week and it is given in Column IV.5. Column V is an important column; it gives the date on which each specific installment becomes due. Forexample, the 1 st installment becomes due 1 week after disbursement (as per loan agreement). i.e., 23/7/2002 + 7 days = 30/7/2002. This is given in Column V corresponding to 1 st installment.6. Sometimes, MFIs may <strong>of</strong>fer a moratorium period. In such cases, the 1 st installment would become immediatelydue after the moratorium period.7. Column VI gives the interest due as per payment. While significance <strong>of</strong> this column is reduced for MFIscharging ‘Flat’ rates <strong>of</strong> interest, for others which use the ‘declining’ balance (Table 10) or ‘EMI’ method(Table 11), this is very relevant, especially if the client makes the repayment after the scheduled installmentdate. MFIs could use this information to calculate ‘Penalties’ or ‘Late Fees’.8. All payments coming in from clients are adjusted as per loan agreement <strong>of</strong> MFI, which stipulates thefollowing:(a) First Towards - Interest Overdues(b) Second Towards - Interest Due(c) Third Towards - Principal Overdues(d) Fourth Towards - Principal Due9. Now, as can be observed from the schedule given in Table 9, the client in the example has promptly paidall installments upto installment no 39. Hence, data in columns VII (amount paid), VIII (Int. Paid), IX(Prin. Paid) and X (Date Paid) correspond to the original schedule.10. This is also reflected by the data in column XII (Cumulative Prin. Paid) which matches the data in ColumnIII (Cumulative Prin. Due).11. Accordingly, columns XV (Interest Overdue) and XVI (Principal Overdue) report a value <strong>of</strong> ‘0’ for eachinstallment till installment number 39.12. Column XVI (Prin. Overdue) = Column III (Cum. Prin. Due) – Column XII (Cum. Prin. Paid)13. Likewise, Column XV (Interest Overdue) = Column VI (Int. due) – Column VIII (Int. Paid).14. Column XIII represents any amounts prepaid – i.e., after the using sequence <strong>of</strong>I. Interest Overdue,II. Interest Due,III. Principal Overdue, andIV. Principal Due,and deducting amounts from clients as such, any amount (that) is left, goes to this column.52
Constructing Loan Repayment Schedule Aging Schedule and Loan Portfolio Report for an MFI15. Column XIV is the Principal Outstanding column and it represents the difference <strong>of</strong> Loan Amount –Cum. Prin. Repaid (Column XII).16. Column XI is the Overdue Processing date, which is 1 day after the installment due date (Column V). Theessence <strong>of</strong> this is that, if 20 is principal due on a specific date and repayment <strong>of</strong> principal is less than the 20due, then the difference <strong>of</strong> principal due (minus) – principal paid becomes Principal Overdue, one dayafter the due date.17. For example, in installment number 40, as on 30/4/2003, the principal overdue is 20 with an age <strong>of</strong> 1 dayas principal <strong>of</strong> 20 has not been paid on even on 30/4/2003. Likewise, in the same manner, 220 is theprincipal overdue and 33 is the interest overdue as <strong>of</strong> 9/7/2003. The age <strong>of</strong> this overdue loan is 71 days, asshown in Column XVII.18. To calculate accurate age <strong>of</strong> an overdue loan, the following method should be followed:[Date <strong>of</strong> calculating Overdue (or Today) – (minus) Earliest Overdue Date with unpaid overdue]It is also to be noted that when overdues from several past installments exist, to calculate age <strong>of</strong> overdue itis important to take the date on which the earliest installment (among several installments) first fell overdue.However, this must be done only if amounts from that installment are still unpaid. If amounts fromthat installment have been paid, then the next earliest installment for which unpaid overdues exist must betaken as the basis for calculating age. Here, the earliest when the overdue occurred was in the 39 th installmentwhen Rs. 20 was not paid that fallen due on 29/4/2003. It remains unpaid as on 9/7/2003 (lastinstallment). Therefore, the age is = (9/7/2003) – (29/4/2003) = 71 days.19. Please see the box below on how not to calculate the age <strong>of</strong> an overdue loan using the installment method<strong>of</strong> aging (which is an incorrect procedure).Example <strong>of</strong> Incorrect AgingF Let us assume that 1032 has not been paid (part <strong>of</strong> it is overdue from August 2001).F The loan term ends in January 2002.F The value per monthly installment is 180F The age is sometimes calculated as:Age =Overdue AmountInstallment amountF As per the above formula, the age, as at end January 2002 would be1032Age (End January 2002) == 5.96 Months180F This is correct, as 6 months intervene between August 2001 & January 2002 (inclusive <strong>of</strong> both months)F Let us now assume that we are in July 2002.F The age as per above method <strong>of</strong> calculation is still 6 months.F But actual age is 6 months till January 2002 + 5 months till July 2002 or11 months.F So what is considered 180 days past due is actually 330 days past dueF This incorrect aging impacts ability <strong>of</strong> MFI to collect money (the further the borrower in age <strong>of</strong>overdue, less likely to get it back). Also, it distorts provisioning, income and finally, sustainability53
<strong>Tracking</strong> <strong>Financial</strong> <strong>Performance</strong> <strong>Standards</strong> <strong>of</strong> Micr<strong>of</strong>inance Institutions20. While the method to arrive at aging was done using data with the Flat rate <strong>of</strong> interest method, the samegeneric principles apply to loans terms using ‘Reducing Balance Method’ and/or ‘EMI Method’. Theschedules for these are given in Tables 10 and 11.21. As long as borrowers pay according to their schedule, interest payments will mirror what needs to be paidas per schedule. But the moment borrowers deviate from the schedule, interest payments will also changebased on the principal outstanding.22. For example, Rs15 is the interest due per month and has to be paid on the last day <strong>of</strong> the month forRs1000 loan, payable in 10 equal months with interest at 15% declining balance annualised. The principaland interest payments as per schedule are as follows:No. <strong>of</strong> Principal Due Interest Due as Principal Principal OutstandingInstallment as per Schedule per Schedule Paid at end <strong>of</strong> installment1 100 15.00 100 9002 100 13.50 100 8003 100 12.00 100 7004 100 10.50 100 6005 100 9.00 100 5006 100 7.50 100 4007 100 6.00 100 3008 100 4.50 100 2009 100 3.00 100 10010 100 1.50 100 0Now assume that the client does not pay the 1 st installment on time and infact pays it one installment late.Then interest to be charged changes and is as follows:This installment interest is 15 andnot 13.50 because PrincipalOutstanding is still 1000 before theborrower makes the paymentNo. <strong>of</strong>Paid PrincipalPrincipal Due Interest Due PrincipalInstallmentOutstandingat end <strong>of</strong> InstallmentInterest Paid1 100 15 0 1000 02 100 15 100 90015 (Interest Overdue) +15 (this installment Interest)3 100 13.50 100 800 13.504 100 12.00 100 700 12.005 100 10.50 100 600 10.506 100 9.00 100 500 9.007 100 7.50 100 400 7.508 100 6.00 100 300 6.009 100 4.50 100 200 4.5010 100 3.00 100 100 3.0011 100 1.50 100 0 1.50So, MFIs must re-work their calculations at the time <strong>of</strong> repayment to account for such aspects.54
Constructing Loan Repayment Schedule Aging Schedule and Loan Portfolio Report for an MFI23. Also, MFIs must have clear-cut norms on dealing with interest issues after the loan term. For example,when the flat rate <strong>of</strong> interest is used, an equal interest amount gets charged per installment from theborrower based on the original loan conditions. Now, after the loan term is over and principal amounts arestill unpaid by the borrower, charging the same interest may be erroneous. How to deal with such aspectsalso needs to be clarified upfront. Further, penalties and penal interest (if any) and their rates there<strong>of</strong> mustbe specified and used consistently.24. Interest Rate should always be expressed as an ‘Annualised Percentage Rate’ and the following formula willhelp in doing so:To annualise a number, the formula is: AA = [A x (12/M)]WhereAA = Annualised amountA = Amount for the periodM = Number <strong>of</strong> months in the period25. Interest Calculation Aspects – whether until date <strong>of</strong> payment or month End is followed should be clarified.Often times, when last date <strong>of</strong> month is the due date, MFIs still take the full month’s interest even ifthe borrower repays 7 days before the scheduled date. Some others calculate interest until the date <strong>of</strong>payment only. Among the latter, while some adjust for the interest on principal outstanding for the 7 daysbalance, others just forget about it. The key aspect is that all <strong>of</strong> these have an impact on aging, portfolioanalysis, ratios and sustainability and hence, information on what is done as part <strong>of</strong> the loan protocol isvery necessary.26. Also, the method <strong>of</strong> Interest Calculation – whether EMI or Regular Diminishing or Flat – should not bechanged during the course <strong>of</strong> a loan.55
<strong>Tracking</strong> <strong>Financial</strong> <strong>Performance</strong> <strong>Standards</strong> <strong>of</strong> Micr<strong>of</strong>inance InstitutionsTable 10- Loan Repayment Schedule with Declining InterestI II III IV V VI VII VIII IX X XI XII XIII XIV XV XVI XVII XVIIIInstl.No.Prin.DueCumPrin.DueInt. Dueas PerScheduleDate DueInt. Dueas perpaymentAmountPaidInt.PaidPrin.PaidDate Paid OD ProcessDateCum Prin.PaidPrin.PrepaidPrin.Outstanding Interest OD Prin. ODAge <strong>of</strong>ODOD Settled1 100 100 15.00 8/31/2002 15.0 115.00 15.0 100.00 8/31/2002 9/1/2002 100.00 0 900.00 0.00 0.00 0 No OD2 100 200 13.50 9/30/2002 13.5 113.50 13.5 100.00 10/2/2002 10/1/2002 200.00 0 800.00 0.00 0.00 2 Yes3 100 300 12.00 10/31/2002 12.0 112.00 12.0 100.00 11/5/2002 11/1/2002 300.00 0 700.00 0.00 0.00 5 Yes4 100 400 10.50 11/30/2002 10.5 110.50 10.5 100.00 11/25/2002 12/1/2002 400.00 0 600.00 0.00 0.00 0 No OD5 100 500 9.00 12/31/2002 9.0 109.00 9.0 100.00 12/25/2002 1/1/2003 500.00 0 500.00 0.00 0.00 0 No OD6 100 600 7.50 1/31/2003 7.5 107.50 7.5 100.00 2/6/2003 2/1/2003 600.00 0 400.00 0.00 0.00 6 Yes7 100 700 6.00 2/28/2003 6.0 0.00 0.0 0.00 Not Paid 3/1/2003 600.00 0 400.00 6.00 100.00 1 OD Not Paid8 100 800 4.50 3/31/2003 6.0 0.00 0.0 0.00 Not Paid 4/1/2003 600.00 0 400.00 12.00 200.00 32 OD Not Paid9 100 900 3.00 4/30/2003 6.0 0.00 0.0 0.00 Not Paid 5/1/2003 600.00 0 400.00 18.00 300.00 62 OD Not Paid10 100 1000 1.50 5/31/2003 6.0 0.00 0.0 0.00 Not Paid 6/1/2003 600.00 0 400.00 24.00 400.00 93 OD Not PaidTotal 1000 82.50 NA 91.5 667.50 67.5 600.00 600.00 0 400.00Table 11 - Loan Repayment Schedule using EMI MethodInstl.No.I II III IV V VI VII VIII IX X XI XII XIII XIV XV XVI XVII XVIII XIXAmountDuePrin.DueCumPrin.DueInt. Dueas PerScheduleDate DueInt. Dueas perpaymentAmountPaid1 108.43 93.43 93.43 15.00 8/31/2002 15.00 108.43 15.00 93.43 8/31/2002 9/1/2002 93.43 0 906.57 0.00 0.00 0 No OD2 108.43 94.84 188.27 13.60 9/30/2002 13.60 108.43 13.60 94.84 9/30/2002 10/1/2002 188.27 0 811.73 0.00 0.00 0 No OD3 108.43 96.26 284.53 12.18 10/31/2002 12.18 108.43 12.18 96.26 10/31/2002 11/1/2002 284.53 0 715.47 0.00 0.00 0 No OD4 108.43 97.70 382.23 10.73 11/30/2002 10.73 108.43 10.73 97.70 11/30/2002 12/1/2002 382.23 0 617.77 0.00 0.00 0 No OD5 108.43 99.17 481.40 9.27 12/31/2002 9.27 108.43 9.27 99.17 12/31/2002 1/1/2003 481.40 0 518.60 0.00 0.00 0 No OD6 108.43 100.66 582.05 7.78 1/31/2003 7.78 108.43 7.78 100.66 1/31/2003 2/1/2003 582.05 0 417.95 0.00 0.00 0 No OD7 108.43 102.16 684.22 6.27 2/28/2003 6.27 108.43 6.27 102.16 2/28/2003 3/1/2003 684.22 0 315.78 0.00 0.00 0 No OD8 108.43 103.70 787.92 4.74 3/31/2003 4.74 0.00 0.00 0.00 Not Paid 4/1/2003 684.22 0 315.78 4.74 103.70 1 OD Not Paid9 108.43 105.25 893.17 3.18 4/30/2003 4.74 0.00 0.00 0.00 Not Paid 5/1/2003 684.22 0 315.78 9.47 208.95 31 OD Not Paid10 108.43 106.83 1000.00 1.60 5/31/2003 4.74 0.00 0.00 0.00 Not Paid 6/1/2003 684.22 0 315.78 14.21 315.78 62 OD Not PaidTotal1,084.341000.00 84.34 NA 89.03 759.04 74.82 684.22Int.PaidPrin.PaidDate PaidOD ProcessDateCum Prin.PaidPrin.PrepaidPrin.Outstanding Interest OD Prin. ODAge <strong>of</strong>ODOD Settled56
Constructing Loan Repayment Schedule Aging Schedule and Loan Portfolio Report for an MFITable 12 - Summary Format <strong>of</strong> Repayment ScheduleI II III IV V VI VII VIII IX X XI XII XIIISl. No Loan DisbursedNo <strong>of</strong>InstallmentsCurrentInstallmentDue perInstallmentCumulative DueSo FarCumulative PaidOn-Time So FarCumul ativePaid as OverdueSo FarCumul ativePaid So FarCumul ativeOverdue orArrearsCumul ativePrepaymentsCumul ativePrin.OutstandingCumulative Prin.Outstanding forOD Loans1 20,000 10 9 2,000 18,000 15,000 3,000 18,000 0 0 2,000 02 30,000 10 7 3,000 21,000 20,000 3,000 23,000 0 2,000 7,000 03 45,000 10 9 4,500 40,500 32,000 10,000 42,000 0 1,500 3,000 04 2,00,000 10 10 20,000 2,00,000 2,00,000 0 2,00,000 0 0 0 05 20,000 10 4 2,000 8,000 8,000 3,000 11,000 0 3,000 9,000 06 4,00,000 10 1 40,000 40,000 39,000 700 39,700 300 0 3,60,300 3,60,3007 20,000 10 4 2,000 8,000 2,000 6,000 8,000 0 0 12,000 08 30,000 10 4 3,000 12,000 12,000 0 12,000 0 0 18,000 09 20,000 10 4 2,000 8,000 8,000 0 8,000 0 0 12,000 010 20,000 10 6 2,000 12,000 12,000 0 12,000 0 0 8,000 011 20,000 10 5 2,000 10,000 2,000 7,000 9,000 1,000 0 11,000 11,00012 20,000 10 2 2,000 4,000 2,000 3,000 5,000 0 1,000 15,000 013 2,50,000 10 0 25,000 0 0 0 0 0 0 2,50,000 014 2,50,000 10 0 25,000 0 0 0 0 0 0 2,50,000 0Total/Avg 1,345,000 11.67 NA NA 381,500 352,000 35,700 3,87,700 1,300 7,500 9,57,300 3,71,30057
<strong>Tracking</strong> <strong>Financial</strong> <strong>Performance</strong> <strong>Standards</strong> <strong>of</strong> Micr<strong>of</strong>inance Institutions4.2. ACCOUNTING FOR LOAN LOSSES – KEY ISSUES FOR STANDARD SETTING4.2.1 Allowances for Loan LossesFor an MFI the loan portfolio is the main business and asset. The values <strong>of</strong> this asset i.e. loans is therefore a keyissue for good management and income and thus for setting standards for financial performance. This issueneeds to be understood by two dimensions viz.A.)B.)The institutional policy <strong>of</strong> an MFI should be in place to consider and account for change in quality <strong>of</strong>its loan portfolioChange in quality <strong>of</strong> loans has substantial effect on MFI’s balance sheet and income statement.The reasons for having a system for accounting for change in quality <strong>of</strong> loan portfolio are:‣ Maintaining loans on the books that are unlikely to be repaid in normal course overstates the size <strong>of</strong> loanportfolio.‣ A well-defined policy that establishes a loan loss reserve and periodically declares loans non-recoverable saves aprogramme from declaring a large amount unrecoverable all at once and thereby drastically reducing as assets.While the accounting systems are based on ‘historical’ costs, the accounting for quality <strong>of</strong> loans is a change initself – it is a shift from traditional system that hinges on only historical costs (i.e. keeping an asset at its originalvalue for all times).How does the asset – loan portfolio – perform? For an MFI, as lender, loan performs by repayment <strong>of</strong> theprincipal amount and the interest (and other fees, if any levied on loan). Since repayment <strong>of</strong> loan is over afuture period, the present status <strong>of</strong> a loan and estimation <strong>of</strong> its future performance are the core issues. Maintainingloan portfolio at the realistic level helps MFI project the actual picture. This removes that portion <strong>of</strong> the assetthat is found not to be ‘performing’.Here it is also interesting to understand that evaluating loan portfolio is not always a negative aspect i.e. issuefor loss only. A low/non-performing loan can revive and therefore become performing. This gives a positiveeffect to an MFI’s balance sheet and income. But practically such chances <strong>of</strong> revival are much less than loansturning worse to bad, so the elaborations here will centre around most happening chances – that <strong>of</strong> losses inloan portfolio.Accounting for change in loan portfolio, has two steps. (a) Periodic review <strong>of</strong> all loans are made and ‘loan lossprovision’ is made to bring the real picture <strong>of</strong> performance <strong>of</strong> loans; (b) The provision is given effect intospecific ‘loan loss reserve’ for loan portfolio (also see section 3.2.2.2 & 3.3.2.1 in chapter 3).Though Loan loss provision is a non-cash expense in anticipation <strong>of</strong> possible loss in value <strong>of</strong> loan outstanding,whereas, actual loan losses or write-<strong>of</strong>fs occur when it is recognised (only for accounting purpose) that loans areunrecoverable. The process <strong>of</strong> recognising an uncollectable loan is called a write-<strong>of</strong>f.Because the possibility that some loans would be unrecoverable has been provided for in the books <strong>of</strong> accountsthrough reserves, loan losses are written <strong>of</strong>f against loan loss reserves and are also removed from the outstandingportfolio. In other words, they decrease the reserve and the outstanding portfolio.Loan write-<strong>of</strong>f is a significant policy decision that requires attention to several aspects related to loan recovery.In normal course, loans are written-<strong>of</strong>f only after the loan term expires. However, in exceptional circumstances,like death or permanent migration <strong>of</strong> the borrower, the loan is written-<strong>of</strong>fs even before the loan term is over.Loan losses or write-<strong>of</strong>fs occur only as an accounting entry. They do not mean that loan recovery shouldnot be pursued. In fact, it should be identified.58
Constructing Loan Repayment Schedule Aging Schedule and Loan Portfolio Report for an MFI4.2.2 Calculating Loan Loss using Aging AnalysisNow we have understood that MFIs should have clear allowances for loan losses. However, some questions stillhaunts the mind <strong>of</strong> a manager <strong>of</strong> an MFI, as to what amount would be appropriate to set aside as loan lossprovision and what should be the basis to arrive at that figure. This section is focused around addressing theabove questions, where we will try to understand the basis <strong>of</strong> making loan loss provision and the process <strong>of</strong>calculating the amount to be provisioned.A practical approach to arrive at amount to be provisioned for loan loss is based on “aging analysis’’ <strong>of</strong> all loanoutstanding. In ‘aging analysis’, all loans are reviewed for their present position in relation to the repaymentschedule as decided when each <strong>of</strong> the loans was sanctioned. Given below is the step-wise method to calculateloan loss provision based on aging analysis.1. The first step towards aging analysis is to draw an ‘aging schedule’ with following categories:Loan CategoryExplanationRegular LoansLoans where repayments have been made as per the duedates or all repayments (that are due) have been paidLoans overdue for < 30 daysLoans with payments overdue for less than 30 days(from the scheduled date)Loans overdue between 31-60 daysLoans with payments overdue for between 31 – 60 days(from the scheduled date)Loans overdue between 61-90 daysLoans with payments overdue for between 61 – 90 days(from the scheduled date)Loans overdue between 91-180 days Loans with payments overdue for between 91 – 180days (from the scheduled date)Loans overdue between 181-365 days Loans with payments overdue for between 181 – 365days (from the scheduled date)Loans overdue for above 365 daysLoans with payments overdue for over 365 days (fromthe scheduled date)Here each category depicts a range <strong>of</strong> quality <strong>of</strong> loans. At the same time, each category also depicts therange <strong>of</strong> risk (probability) <strong>of</strong> losing money (loan may not come back from borrower). However, the level <strong>of</strong>risk or probability <strong>of</strong> loan loss in each category will differ from context to context.2. Having understood the method <strong>of</strong> deriving age <strong>of</strong> an overdue loan from repayment schedule in section 4.2(18) <strong>of</strong> this chapter, now calculate the age <strong>of</strong> all outstanding loans and club them under appropriatecategory (as given above) based on their age.3. After classifying all the loans under age group, now sum up the outstanding figure <strong>of</strong> all loan accounts foreach age group.4. Establish rate <strong>of</strong> provisioning (% <strong>of</strong> loan outstanding that need to be kept aside) for each age group, basedon risk perspective (<strong>of</strong> default) attached to each category. An historical precedence <strong>of</strong> client behavior is thebest guidance mechanism towards establishing rate <strong>of</strong> provisioning. Especially, if there is a cause to believethat there could be something that is specific to the context that requires the establishment <strong>of</strong> risk ratesunique to that context.59
<strong>Tracking</strong> <strong>Financial</strong> <strong>Performance</strong> <strong>Standards</strong> <strong>of</strong> Micr<strong>of</strong>inance InstitutionsHowever, in the absence <strong>of</strong> adequate historical data on default by borrowers, MFI can resort to followingguidelines to assign provisioning rate:a) National statutory bodies have their own norms for setting the provisioning rate – The Reserve Bank<strong>of</strong> India has stipulated norms for classification <strong>of</strong> loans in NBFCs.b) International best practices recommend values for various loans categories which are as follows:Status <strong>of</strong> LoansReserve RateRegular 0%1-30 days past due 10%31-60 days past due 25%61-90 days past due 50%91-180 days past due 75%181-365 days past 90%> 365 days past due 100%c) Sometimes, as in the beginning <strong>of</strong> an MFI operation, it may not be possible to have an aging schedule,as loans may still not have become due. In such circumstances, when having an aging analysis is rathernot applicable or not possible (due to lack <strong>of</strong> data), using the internationally recommended norm <strong>of</strong> 3percent <strong>of</strong> loans outstanding as the allowance could be implemented.5. After assigning provisioning rate for each age (risk) category, now multiply the volume <strong>of</strong> loan outstandingin each category with corresponding provisioning rate. This will give the amount to be provisioned (forloan loss) under each risk category.6. Now add up all provision amounts under each age category to get the overall provision amount. To get theoverall provision rate, divide the overall provision amount by total outstanding portfolioThe entire process calculating loan loss provision is summarized below with an illustrative example.Calculating loan loss provision requires an aging schedule, allocating probabilities (reserve rates) for likely loanlosses for each category <strong>of</strong> loans and then multiplying the volume <strong>of</strong> loan outstanding in each category by theprobability and adding it all to get the provision amount (or even the overall provision/reserve rate for whichone would have to divide by the outstanding portfolio).I II III IV = (II*III)DescriptionLoanProvision AmountProvision RateOutstandingAdding to ReserveRegular Loans 100,000 0% -Loans with overdue for < 30 days 10,000 10% 1,000Loans with overdue between 31-60 days 10,000 25% 2,500Loans with overdue between 61-90 days 3,000 50% 1,500Loans with overdue between 91-180 days 1,000 75% 750Loans with overdue between 181-365 days 4,000 90% 3,600Loans with overdue for >365 days 5,000 100% 5,000Total 133,000 - 14,350The Total Provision Amount is in the last row <strong>of</strong> column IV and it equals to Rs. 14,35060
Constructing Loan Repayment Schedule Aging Schedule and Loan Portfolio Report for an MFIThe Provision Rate = Column V Total = 14,350 x 100 = 10.789 % = 11% (approx.)Column II Total 133,000Let us assume that this is provision rate for the most recent years and also consider that the provision rates forthe previous two years (before this year) are 10 percent and 11 percent respectively. Now, using the data <strong>of</strong>three consecutive years, average provision rate could be calculated that can be applied for the next year (forprojection or otherwise)Average Provision Rate = 11% + 10% + 9% = 30% = 10%.3 (years) 3In other words, a reference provision rate is now available based on a historical analysis <strong>of</strong> the data over a threeyearperiod. While one may want to question, the appropriate number <strong>of</strong> years to choose for calculating theprovision rate, it must be clarified that there is really no concrete scientific guideline. However, one may arguethat the last 3 years (being most representative <strong>of</strong> the current situation) are perhaps best used in calculating theaverage.The provision rate increases as loans have been overdue for a longer period – the farther a loan is from theoriginally scheduled repayment, the likelihood or probability <strong>of</strong> the loan being repaid (or recovered) is lower.Therefore, as the age <strong>of</strong> the loan, in terms <strong>of</strong> its overdue status increases, the provision rate (or risk factor) alsoincreases. Obviously, such a risk is minimal in loans that are regular – i.e., they have no overdue. Therefore, theprovision rate is listed as 0 percent. However, MFIs following more prudent norms also make provision forregular loans (in the range <strong>of</strong> 1% - 3%).While the above are intuitively appealing arguments, several key aspects need to be considered while establishingthe provision rate on historical data:a) Take for the example an MFI, where during a particular season (monsoons or otherwise), repayments maynot come in for 3 months or so – this is true <strong>of</strong> weaving and fishing (where clients go to sea). Under suchcircumstances, < 90 days overdue loans would not be at great risk because <strong>of</strong> the seasonality aspect. Clientsnormally repay the entire amount when they get back to work, <strong>of</strong>ten over 2/3 installments, as both examplesgiven above are high value (low volume) trades.b) Likewise, for crop loans, the same is true as crops are harvested after 90 days or so (many a time) and theargument that repayment will occur from the household income or other livelihoods has <strong>of</strong>ten not happened.In such cases, the very nature <strong>of</strong> livelihoods sometimes causes over dues in payment but the riskmay not be high after all. Therefore, it seems prudent to tailor the risk rates to the context and change it,if there is enough justification.c) If there is insurance for calamities and other aspects, the provision (risk) rate again could be lowered butthis must be justified.4.2.3 Accounting Entries for Loan Loss Provision, Loan Loss Reserve and Write-<strong>of</strong>fsIn the previous section, we learnt to calculate Loan Loss Provision, now the next step would be to makeappropriate accounting entries for the provision In this section, we will try to learn the relevant accountingtreatment <strong>of</strong> loan loss provision and its bearing on loan loss reserve.Before we move to accounting entries, let’s take a quick re-look at the key concepts related to loan loss provisionand reserve and write-<strong>of</strong>f.61
<strong>Tracking</strong> <strong>Financial</strong> <strong>Performance</strong> <strong>Standards</strong> <strong>of</strong> Micr<strong>of</strong>inance Institutions• The loan loss provision in the current period, a non-cash (operating) expense appears on the incomestatement, which is a cushion against likely loan losses from loans outstanding in that period and is basedon an aging <strong>of</strong> all types <strong>of</strong> loans that are outstanding during the period. It is an amount added to theexisting loan loss reserve, given the present loan aging position.• Loan Loss Reserve appears as a negative asset on the Balance Sheet. In the first year <strong>of</strong> operation <strong>of</strong> an MFI,the loan loss reserve = loan loss provision because that is the 1 st time a provision is being made. However,in the subsequent years, loan loss provision adds to the existing loan loss reserve.• On the other hand, actual loan losses (<strong>of</strong>ten defined by the write-<strong>of</strong>f policy) reduce the existing loan lossreserve (as well as the outstanding portfolio) and usually (but not compulsorily) correspond to earlier loans(for which provisions have already been made in an earlier period based on an aging schedule then available).Now, let’s recall the fundamental accounting principle.Assets and ExpensesLiabilities, Equity and IncomeDebit (Dr) Credit (Cr) Debit (Dr) Credit (Cr)INCREASES DECREASES DECREASES INCREASESRefer to the table calculating provision amount in Sec. 4.2.2Loan Loss Provision Expense is added (increased) by Rs. 14,350Therefore, the corresponding accounting entry will be - DEBIT Loan Loss Provision (increase <strong>of</strong> expense andgets to the equity side <strong>of</strong> the Balance sheet via retained net surplus/deficit)Since provision amount is added to Loan Loss Reserve, hence,Loan Loss Reserve is increased by the same amount – Rs. 14,350The corresponding accounting entry will be - CREDIT loan Loss Reserve (increase <strong>of</strong> a negative asset thatreduces the net portfolio outstanding and hence, total assets or increase <strong>of</strong> a liability)The summary <strong>of</strong> accounting entries <strong>of</strong> Loan loss provision and Reserve:Particulars Entries AmountLoan Loss Provision Expense (Increase <strong>of</strong> Expense) DEBIT Rs. 14,350Loan Loss Reserve (Increase <strong>of</strong> –ve asset or Increase <strong>of</strong> liability) CREDIT Rs. 14,350Processing the Loan Write-<strong>of</strong>fsSuppose that Rs. 3,000 is written <strong>of</strong>f (declared as bad debt by the MFI)It reduces (decreases) the Loan Loss Reserve by write-<strong>of</strong>f amount <strong>of</strong> Rs. 3,000The corresponding accounting entry will be - DEBIT Loan Loss Reserve (Decrease <strong>of</strong> a negative asset or aliability)At the same time it also reduces (decreases) the Outstanding Portfolio by write-<strong>of</strong>f amount.The corresponding accounting entry will be - CREDIT Loans Outstanding (Decrease <strong>of</strong> an asset)The summary <strong>of</strong> accounting entries <strong>of</strong> Write-<strong>of</strong>f:Particulars Entries AmountLoan Loss Reserve (Decrease <strong>of</strong> –ve asset <strong>of</strong> decrease <strong>of</strong> liability) DEBIT Rs. 3,000Outstanding Portfolio (Decrease <strong>of</strong> an asset) CREDIT Rs. 3,00062
Constructing Loan Repayment Schedule Aging Schedule and Loan Portfolio Report for an MFIHere we need to understand that loan write-<strong>of</strong>fs are reduced from the loan loss reserve because provisions forthese ‘overdue’ loans must have already been made earlier and also already added to the reserve. Therefore,charging these write-<strong>of</strong>fs to the loan loss reserve is most appropriate.Now what happens, when already written <strong>of</strong>f loans are collected?The norm is to increase income as the loan loss provision made earlier was charged as an expense. Thus, whenwritten <strong>of</strong>f loans are collected, then accounting entries would be as follows (taking the same example, let us sayRs 1,000 is collected from the loan that was written <strong>of</strong>f earlier)CREDIT Miscellaneous Income (Increase <strong>of</strong> Income)DEBIT Cash (Increase <strong>of</strong> an Asset)The summary <strong>of</strong> accounting entries <strong>of</strong> amount recovered from written-<strong>of</strong>f loans:Particulars Entries AmountMiscellaneous Income (Increase <strong>of</strong> Income) CREDIT Rs 1,000Cash (Increase <strong>of</strong> an Asset) DEBIT Rs 1,000In summary, the following procedure is adopted while accounting for loan loss reserve.Loan Loss Reserve at the beginning <strong>of</strong> the Period+ (PLUS)Loan Loss Provision for the Period- (MINUS)Loan Write-<strong>of</strong>fs during the period= (EQUAL TO)Loan Loss Reserve at the end <strong>of</strong> the period.Summary <strong>of</strong> concepts and accounting norms for Loan Loss Provision, Reserve and Write-<strong>of</strong>fsA provision records the possibility that the outstandingloan portfolio <strong>of</strong> an MFI is not 100% realisable andit treats the anticipated loss in the value <strong>of</strong> loanportfolio as a business expense during the period.Loan loss reserve represents the amount <strong>of</strong> loanoutstanding that is expected to turn bad.Provision is mere accounting entry and doesn’t involvecash movement like savings for rainy dayLoan loss provision charged is an expense for theperiod, thus, it affects the Income and ExpenditureStatement. Since the corresponding credit accumulatesover time under reserve, it also affects the Balancesheet where it is shown as a negative asset (alternativelyas a liability)Dr - Loan loss provisionCr - Loan loss reserveProvisioning for loan loss, however, doesn’t affect theloan ledger.Loan losses or write-<strong>of</strong>fs occur when it is determinedthat loans are no more recoverable.A write-<strong>of</strong>f is an accounting procedure that removesthe outstanding balance <strong>of</strong> the loan from the grossloan portfolio and from the loan loss reserve, thus,produce changes in the asset side <strong>of</strong> the balance sheet.Dr - Loans Loss ReserveCr - Outstanding LoansHowever, write-<strong>of</strong>fs do not affect the balance <strong>of</strong> thenet loan portfolio, total assets, or any equity accountunless the write-<strong>of</strong>f amount is less than or equal tothe reserve, OR an increase in the loan reserve is made.Write-<strong>of</strong>fs do not affect the income statement, if provisionsare made at appropriate times, however, it doesaffect the loan ledger.When write-<strong>of</strong>fs are recovered, they are booked in theincome and expenses statement as miscellaneous income63
<strong>Tracking</strong> <strong>Financial</strong> <strong>Performance</strong> <strong>Standards</strong> <strong>of</strong> Micr<strong>of</strong>inance InstitutionsEffect <strong>of</strong> Reserves and Losses on Balance Sheet value <strong>of</strong> Outstanding PortfolioLoan Loss Provision(recorded as expensein Income Statement)Loan Loss Reserve(reduces total portfolioin Balance Sheet)1st YearProvisionReserveNET PortfolioOutstanding Portfolio2nd YearProvisionReserveOutstanding PortfolioNET PortfolioReserveNET PortfolioOutstanding PortfolioWrite-<strong>of</strong>fWrite-<strong>of</strong>fReserve NET PortfolioOutstanding PortfolioNO PROVISIONING(Overstated Assets)1st Year(Overstated Income)Outstanding Portfolio2nd YearOutstanding PortfolioWrite-<strong>of</strong>fWrite-<strong>of</strong>fOutstanding Portfolio(Sudden Decrease)64
Constructing Loan Repayment Schedule Aging Schedule and Loan Portfolio Report for an MFI4.3 LOAN PORTFOLIO REPORT – KEY DEFINITIONS & INTERPRETATIONSIn Chapter 3, we learn about construction <strong>of</strong> two statutory financial statement (Balance Sheet and IncomeStatement) <strong>of</strong> MFI. Till now in this chapter, we learn about aging analysis. In this section, we will learn toprepare another important (non statutory) financial statement called Portfolio Report.The portfolio report provides an overview <strong>of</strong> performance <strong>of</strong> the most significant asset <strong>of</strong> an MFI, its loanportfolio. Therefore, a separate report is required to track the most important portfolio. The report becomevery crucial in a sense that safeguarding the quality <strong>of</strong> loan portfolio is primary responsibility <strong>of</strong> MFI’s management.The complete portfolio report with an aging analysis provides the desired information about the microcreditoperations. Like Income Statement, Portfolio report is also prepared for a particular period. A sampleLoan Portfolio Report is presented below (Table 13). The following discussion uses the sample report givenbelow to explain the various aspects pertaining to the loan portfolio report.Table 13 – <strong>Sa</strong>mple Portfolio ReportPortfolio related Data for the Year ending March 31, 2001, March 31, 2002 & March 31, 2003I II III IV VSl. Description 2001 2002 2003P1 Total value <strong>of</strong> loans disbursed during period 176,000 260,000 320,000P2 Total number <strong>of</strong> loans disbursed during period 2,200 2,600 3,200P3 Number <strong>of</strong> Active Borrowers (End <strong>of</strong> Period) 2,640 3,100 3,600P4 Average number <strong>of</strong> Active Borrowers 2,170 2,870 3,350P5 Value <strong>of</strong> loans outstanding (End <strong>of</strong> period) 104,000 140,000 168,000P6 Average outstanding balance <strong>of</strong> loans 90,000 122,000 150,000P7 Value <strong>of</strong> payments in arrears (End <strong>of</strong> period) 20,000 18,000 140,00P8 Value <strong>of</strong> outstanding balance <strong>of</strong> loans in arrears (End <strong>of</strong> period) 40,000 40,000 40,000P9 Value <strong>of</strong> loans written <strong>of</strong>f during period 0 6,000 1,000P10 Average loan size 160 200 200P11 Average loan term (months) 24 24 24P12 Average number <strong>of</strong> loans <strong>of</strong>ficers during period 8 12 12P13 Value <strong>of</strong> Re-Scheduled Loans Outstanding 0 0 0P14 Value <strong>of</strong> Re-Financed Loans Outstanding 0 0 0P15 Value <strong>of</strong> Loan Outstanding for which Repayment is yet to begin 0 0 0Sl.NoAging Analysis <strong>of</strong> Outstanding Loans for Year Ending March 2003Type <strong>of</strong> LoanOutstandingNo. <strong>of</strong> Loans Value <strong>of</strong> Loans(IV) as a % <strong>of</strong>Total LoanProvisionRateProvisionAmountOutstandingI II III IV V VI VIIP16 Regular Loans 2810 128,000 76.19 % 0% -P17 Less than 30 Days past due 400 17,500 10.42 % 10% 1,750P18 Between 31- 60 days past due 150 10,000 5.95 % 25% 2,500P19 Between 61- 90 days past due 120 5,000 2.98 % 50% 2,500P20 Between 91- 180 days past due 50 3,500 2.08 % 75% 2,625P21 Between 181- 365 days past due 40 2,500 1.49 % 90% 2,250P22 > 365 days past due 30 1,500 0.89 % 100% 1,500P23 Total 3,600 168,000 100.00% - 13,12565
<strong>Tracking</strong> <strong>Financial</strong> <strong>Performance</strong> <strong>Standards</strong> <strong>of</strong> Micr<strong>of</strong>inance InstitutionsExplanation <strong>of</strong> Portfolio Report (Table 13) is given belowExplanation <strong>of</strong> each row (1 to 15) <strong>of</strong> Portfolio related Data for the Year ending March 31,2001, March31, 2002 & March 31, 2003, is provided here1. Total Value <strong>of</strong> Loans Disbursed during the Period – Refers to the total value (in currency) <strong>of</strong> loansdisbursed in a specific time period regardless <strong>of</strong> whether they are performing, non-performing or written<strong>of</strong>f. This value should not be confused with gross loan portfolio, which can be several times less than thevalue disbursed. (See Column II, Row P1).2. Total Number <strong>of</strong> Loans Disbursed during the Period – Refers to the total number <strong>of</strong> loans disbursed in aspecific time period. For MFIs using a group lending methodology, the number <strong>of</strong> loans should refer tothe number <strong>of</strong> individuals receiving part <strong>of</strong> a group loan, unless the MFI specifies a different definition.(See Column II, Row P2).3. Number <strong>of</strong> Active Borrower (end <strong>of</strong> period) - Refers to the number <strong>of</strong> borrowers with one or more loanin force that have neither been fully repaid nor written-<strong>of</strong>f. Borrowers, who have repaid their loan in full,are not considered in this number. The number <strong>of</strong> active borrowers will be lower than the number <strong>of</strong> loanoutstanding, if some borrowers have more than one loan. (See Column II, Row P3).4. Average Number <strong>of</strong> Active Borrower – Refers to the average no. <strong>of</strong> active borrowers (as defined above)over a period. Average number <strong>of</strong> active borrowers can be estimated by taking the no. <strong>of</strong> active borrowersat the first date <strong>of</strong> the period and adding the no. <strong>of</strong> active borrower at the last date <strong>of</strong> the period anddividing the sum by two. (See Column II, Row P4).5. Value <strong>of</strong> Loans Outstanding (end <strong>of</strong> period) - Refers to the current value (in currency) <strong>of</strong> loans still notpaid at a specific date. It differs from the “Total Value <strong>of</strong> Loans disbursed during the period” and itconsider just the amount that is currently owed to the organisation. In other words, only unpaid principalbalance <strong>of</strong> loan disbursed is included in Value <strong>of</strong> Loans Outstanding. (See Column II, Row P5) {for detailssee section 3.3.2.1 (c) in chapter 3}.6. Average Outstanding Balance <strong>of</strong> Loans - Refers to the average value (in currency) <strong>of</strong> loans outstandingover a period. Average Outstanding Balance can be estimated by taking the opening balance <strong>of</strong> loansoutstanding at the first date <strong>of</strong> the period and adding the closing balance <strong>of</strong> loans outstanding at the lastdate <strong>of</strong> the period and dividing the sum by two. (See Column II, Row P6)In order to increase the accuracy <strong>of</strong> this calculation, the balance <strong>of</strong> loans at the end <strong>of</strong> any given interval(midway through the period, end <strong>of</strong> each month, etc.) can be used, provided, the total figure is dividedby the number <strong>of</strong> intervals used.For example, to determine the Average Outstanding Balance for a 12-month period using monthlyintervals, the outstanding balance at the end <strong>of</strong> each month would be added together and the total figuredivided by 13.As per our example, for year 2002, the average outstanding balance <strong>of</strong> loans (as the approximate formula)is (104,000 + 140,000)/2 = 122,000. (Row P5 and Column IV). While for cursory analysis, one may usethe approximate formula <strong>of</strong> opening balance plus closing balance and dividing this by 2, it is imperativethat from a best practices perspective, the accurate formula <strong>of</strong> adding all month end balances with theopening balance and dividing by 13 is followed.7. Value <strong>of</strong> Payments in Arrears (end <strong>of</strong> period) - Refers to the value (in currency) <strong>of</strong> payments in arrears –payments that have been due and not paid. This figure includes principal only that has become due but hasnot been received as <strong>of</strong> the end <strong>of</strong> the period. (See Column II, Row P7)66
Constructing Loan Repayment Schedule Aging Schedule and Loan Portfolio Report for an MFI8. Value <strong>of</strong> Outstanding Balance <strong>of</strong> Loans in Arrears (end <strong>of</strong> period) - Refers to the total value (in currency)<strong>of</strong> loans that have one or more payments in arrears. Includes principal amount only, but covers the totalloan amount outstanding, not just the amount <strong>of</strong> principal that has fallen due and not been received. Alsoreferred to as “Portfolio at Risk” (for details see section 5.1.1 in chapter 5) when this is divided by theoutstanding portfolio. (See Column II, Row P8).9. Value <strong>of</strong> Loans Written-Off during the Period - Refers to the value (in currency) <strong>of</strong> loans that have beenrecognised for accounting purposes as non-recoverable and is removed from the outstanding balance <strong>of</strong> theloan from the gross loan portfolio and from the loan loss reserve in the Balance Sheet, without affectingbalance <strong>of</strong> the net loan portfolio, total assets, or any equity account. (See Column II, Row P9)Writing <strong>of</strong>f loans is always a difficult decision and it must be carefully taken (refer the bottom part <strong>of</strong>section 4.2.1 in this chapter)Writing <strong>of</strong>f loans too rapidly can make an organisation’s loan portfolio look much healthier than it maybe, as the Portfolio at Risk appears small.By the same token, past due loans, which should be written <strong>of</strong>f but are still included in an organisation’soutstanding loan figure overstate the size <strong>of</strong> the organisation’s healthy portfolio and consequently distortthe financial picture.10. Average Loan Size - Refers to the average size <strong>of</strong> loans at the time <strong>of</strong> disbursement. (See Column II, RowP10)This would normally be determined in the following manner:Value <strong>of</strong> Loans Disbursed during the period (P1)Number <strong>of</strong> Loans Disbursed during the period (P2)Using the above formula, we get the average loan sizes for years ending March 2002 as 100(260,000/2,600) and March 2003 as 100 (320,000/3,200).11. Average Loan Term - Refers to the amount <strong>of</strong> time that loans, on average, are outstanding. In other words,it’s the average period in which borrowers are supposed to pay back the entire sum <strong>of</strong> money lent by theMFI. (See Column II, Row P11)12. Average Number <strong>of</strong> Loan Officers during Period - The term “loan <strong>of</strong>ficer” refers to field personnel or line<strong>of</strong>ficers who deal directly with clients in disbursing loans and collecting loan payments (i.e., employees whoare part <strong>of</strong> the Micr<strong>of</strong>inance programme). Though ‘loan <strong>of</strong>ficer’ directly interact with the client, but notwith administrative staff or analysts who process loans without direct client contact. Loan <strong>of</strong>ficers includecontract employees who may not be part <strong>of</strong> permanent staff, but are contracted on a regular basis in thecapacity <strong>of</strong> loan <strong>of</strong>ficer.Number <strong>of</strong> loan <strong>of</strong>ficers is reported on a full-time-equivalent basis. In cases where a staff member managessome loans, but also has other duties (for instance, a supervisor), this indicator should include a fraction
<strong>Tracking</strong> <strong>Financial</strong> <strong>Performance</strong> <strong>Standards</strong> <strong>of</strong> Micr<strong>of</strong>inance InstitutionsApart from the above, best practices recommendations suggest that the following additional informationshould be a part <strong>of</strong> Portfolio Report in order to ensure greater transparency and accuracy in the riskestimates13. Value <strong>of</strong> Re-Scheduled Loans outstanding - Refers to the value <strong>of</strong> loans that have been re-scheduled – alloutstanding loans, whose terms have been changed but no new amounts have been given (additionally)(See Column II, Row P13).14. Value <strong>of</strong> Re-Financed Loans outstanding - Refers to the value <strong>of</strong> loans that have been re-financed – alloutstanding loans, whose terms have been changed and also new amounts have been given additionally(See Column II, Row P14).15. Value <strong>of</strong> Loans outstanding for which repayment is yet to begin - Refers to the value <strong>of</strong> loans outstandingfor which the repayment schedule is yet begin. These could include loans that have a longer moratoriumperiod as well as loans that have been recently disbursed. (See Column II, Row P15).· The reason for obtaining this information is that, inclusion <strong>of</strong> such loans (outstanding) in the totaloutstanding portfolio will understate the risk inherited in portfolio.· In some cases, clients’ repayment behaviour is not observable (as repayment has not yet started),hence, the Portfolio risk will remain understated. Therefore, to present the true picture <strong>of</strong> the risk,it is fair and accurate to make proper adjustment by deducting these amounts from the outstandingportfolio (also see section 5.1.1.6, 5.1.1.7 and 5.1.1.8 in chapter 5).· Of course, these amounts would have to be automatically included in the total outstanding portfolio,once the repayment schedule begins.The rows 16 to 23 <strong>of</strong> portfolio report is aging analysis <strong>of</strong> all outstanding loans for year ending March 31, 2003.It is similar as aging analysis table explained earlier in this chapter in section 4.2.2. A brief explanation <strong>of</strong> eachcolumn <strong>of</strong> aging analysis is given below:· Column I gives the row identification number,· Column II is the description <strong>of</strong> the type <strong>of</strong> loans classified as regular and various days past due.· Column III provides the number <strong>of</strong> such loans in the various categories, as mentioned above.· Column IV gives the value <strong>of</strong> unpaid principal balance (or loan outstanding) for the respective category <strong>of</strong>loans (both current and past due by different days). This total should equal the amount given in row P5,Column V.· Column V shows the percentage <strong>of</strong> loans outstanding in each <strong>of</strong> the categories (as a proportion <strong>of</strong> the totalloans outstanding). The total here should equal 100%. It also highlights the Portfolio at risk for loans ineach <strong>of</strong> the categories <strong>of</strong> past due loans (for details see section 5.1.1 in chapter 5).· Column VI gives the risk factor in terms <strong>of</strong> the percentage <strong>of</strong> the loan outstanding that will (perhaps) benot recovered. This is available for each <strong>of</strong> the categories <strong>of</strong> loans (regular and past due loans by differentdays).· Column VIII provides the amount at risk for the different types <strong>of</strong> loans, taking into account the loanoutstanding and the risk factor.68
PERFORMANCE STANDARDS-CONCEPT,DEFINITIONS, CALCULATION ANDMETHODOLOGICAL ISSUES69
<strong>Tracking</strong> <strong>Financial</strong> <strong>Performance</strong> <strong>Standards</strong> <strong>of</strong> Micr<strong>of</strong>inance Institutions70
<strong>Performance</strong> <strong>Standards</strong> - Concept, Definitions, Calculation and Methodological IssuesChapter5PERFORMANCE STANDARDS - CONCEPT, DEFINITIONS,CALCULATION AND METHODOLOGICAL ISSUESIn chapter 2 we learn about the conceptual framework <strong>of</strong> financial performance standards and their basicfeatures. Also, we learnt about the broad thematic areas <strong>of</strong> financial performance <strong>of</strong> an MFI and standardsrecommended by <strong>Sa</strong>-<strong>Dhan</strong> under each thematic area <strong>of</strong> financial performance.In this chapter we will try to define each <strong>of</strong> the broad areas <strong>of</strong> financial performance standards suggested by <strong>Sa</strong>-<strong>Dhan</strong>, identify specific indicator(s) for each performance area, provide conceptual & operational definitions <strong>of</strong>these indicators along with a discussion <strong>of</strong> their strengths/weaknesses and identify key methodological issueswith regard to their calculation.5.1 ASSET QUALITY STANDARDS1. Asset Quality <strong>Standards</strong> signify the performance level <strong>of</strong> the most important asset (loan portfolio) <strong>of</strong>an MFI. It helps management and other stakeholders to know whether the institution is doing aresponsible job <strong>of</strong> managing its portfolio. More specifically, it tells that what portion <strong>of</strong> loan portfolio(asset) is good or bad.2. This group <strong>of</strong> ratios are very crucial for an MFI because the “loan portfolio” is the primary incomegenerating asset <strong>of</strong> a micro-finance institution3. The risk that some <strong>of</strong> the loans will not earn expected revenue and may not be paid back (at all) is veryreal and must be anticipated as business risks.4. Management <strong>of</strong> the twin risks <strong>of</strong> repayment <strong>of</strong> principal amount and <strong>of</strong> interest income are crucialbecause <strong>of</strong> their impact on overall viability <strong>of</strong> the micro-credit operation.5. Therefore, timely and periodic monitoring <strong>of</strong> this group <strong>of</strong> ratios would enable MFIs to detect delinquencyon performance <strong>of</strong> loans given by the MFI.6. The key Asset Quality Ratios to be monitored 10 are Portfolio at Risk and the traditionally used CurrentRepayment Rate, despite it not being a genuine measure <strong>of</strong> portfolio quality.7. The various statements/reports/records required for calculating Asset Quality Ratio are given belowStatements/Reports Required for Calculation <strong>of</strong> Assets Quality RatiosStatement/Reports / Records RequirementsPortfolio Report with Aging ScheduleBalance SheetLoan Ledger (Individual & Aggregated)Yes, this alone is required and sufficient. But, the aging<strong>of</strong> loans must be done in an accurate manner.Could be used if appropriately structured, especially toinclude information on past due and restructured loansYes, required and very important10These are generally calculated for Principal Amounts but most <strong>of</strong> the same concepts can be applied for interest payments as well.71
<strong>Tracking</strong> <strong>Financial</strong> <strong>Performance</strong> <strong>Standards</strong> <strong>of</strong> Micr<strong>of</strong>inance Institutions5.1.1 Portfolio At RiskSum <strong>of</strong> Unpaid Principal Balance <strong>of</strong> All Loans with Payments Past DueTotal Gross Outstanding Loan Portfolio (Sum <strong>of</strong> Principal Outstanding <strong>of</strong> All Loans)Trend - A decreasing ‘’Portfolio at Risk’’ is positive but this trend can be misleading because a lower ratio can beobtained by simply increasing the denominator (the size <strong>of</strong> loan portfolio). In other words, sudden and largedisbursements <strong>of</strong> loans could mask the actual delinquency risk. Alternatively, in a growing MFI that is fastexpanding in terms <strong>of</strong> loan disbursements, the same limitation applies. (Limitation <strong>of</strong> this measure is discussed indetail in section 5.1.1.5 in this chapter ahead.)Standard Proposed by <strong>Sa</strong>-<strong>Dhan</strong> – Portfolio at Risk > 60 Days should be
<strong>Performance</strong> <strong>Standards</strong> - Concept, Definitions, Calculation and Methodological Issues5. Interest Computation Method6. Repayment Assumptions (including grace/moratorium period, whether equal installments for principalare there etc.)Step 2: Using the above, fill out the Principal and Interest Amounts Due with Dates Due for each installment<strong>of</strong> every loan (see table 9).Step 3: Write down the total amounts paid by clients along with dates <strong>of</strong> payments (these are transactions <strong>of</strong>repayments made by clients)Step 4: Calculate interest due as per payment date for each installment. If due date <strong>of</strong> installment and paymentdate are one and the same, then interest due as per payment date will be the same as interest due as perschedule. Otherwise, it will differ. This is a very crucial aspect that should not be ignored.Step 5: Once the transaction amounts are available, allocate or distribute these total amounts as per the followingnorms1 st towards Fines/penalties (1 st )2 nd towards Interest Overdue (2 nd )3 rd towards Interest Due if it is actually due on the date <strong>of</strong> payment (3 rd )4 th towards Principal Overdue (4 th )5 th towards Principal (5 th )If there are no fines, it will first go towards Interest Overdue, then Interest Due if it is actually due on thatdate, then Principal Overdue and Last towards PrincipalStep 6: Now, at end <strong>of</strong> each installment, check whether total amount paid = Fines Paid + Interest O/D Paid +Interest Paid + Principle O/D Paid + Principle Paid.Step 7: At end <strong>of</strong> each installment also get the following totals➞ Principle Outstanding,➞ Principle Overdue,➞ Interest Overdue➞ Principle Paid➞ Interest Paid➞ Fines Paid, and➞ PrepaymentsPrepayments will occur when a client makes payment in excess <strong>of</strong> principal + interest due (including over dues)plus fines to be paid till that installmentStep 8: Check if Principle or Interest O/D > 0 and if so, then determine age <strong>of</strong> the overdue loan as <strong>of</strong> aparticular date or installment.Step 9: To calculate age as at end <strong>of</strong> any installment, check for unpaid over dues (principle or interest) and alsoascertain when they occurred.73
<strong>Tracking</strong> <strong>Financial</strong> <strong>Performance</strong> <strong>Standards</strong> <strong>of</strong> Micr<strong>of</strong>inance InstitutionsStep 10: Age at end <strong>of</strong> installment can be calculated as follows:Age <strong>of</strong> Overdue Loan= Date at which age is being calculated (i.e., today or date at end <strong>of</strong> installment)– (Minus)Date at which earliest UNPAID Overdue occurred= “Y” Days.Here unpaid is as <strong>of</strong> the reference date <strong>of</strong> calculating the age.Step 11: After identifying age <strong>of</strong> all the loans, aggregate repayment schedules for all loan accounts and summarisethem in the form <strong>of</strong> an aging schedule as given below. (See section 4.2.2 in chapter 4)➞ Regular Loans (Loans with No Over Dues)➞ Loans < 30 Days Past Due➞ Loans between 31-60 Days Past Due➞ Loans between 61-90 Days Past Due➞ Loans between 91-180 Days Past Due➞ Loans between 181- 365 Days Past Due➞ Loans > 365 Days Past DueStep 12: Calculating Portfolio at RiskUsing either <strong>of</strong> the reports (loan loss provision table or aggregated loan repayment format), sum the unpaidprincipal balance <strong>of</strong> all loans with payments past due (or overdue or arrears) and divide it by the Total GrossOutstanding Portfolio (which is the sum <strong>of</strong> the outstanding principal amounts <strong>of</strong> all loans). This is the TotalPortfolio at Risk or PAR >=1 Day. (The procedure is outlined in aging analysis Table – 13)Arrive at the Portfolio at Risk (PAR) for past due loans with different ages. PAR is usually calculated forseveral categoriesF PAR > = 1 Day = Sum <strong>of</strong> PAR 1-30 Days+31-60 Days+…PAR > 365 DaysF PAR > 30 Days = Sum <strong>of</strong> PAR 31-60 Days+61-90 Days+ …PAR > 365 DaysF PAR > 60 Days = Sum <strong>of</strong> PAR 61-90 Days+91-120 Days+ …PAR > 365 DaysF PAR > 90 Days = Sum <strong>of</strong> PAR 91-120 Days+121-180 Days+ ...PAR >365 DaysF PAR > 180 Days = Sum <strong>of</strong> PAR 181-365 Days+ PAR >365 DaysF PAR > 365 Days (1 Year) = Sum <strong>of</strong> PAR > 365 Days74
<strong>Performance</strong> <strong>Standards</strong> - Concept, Definitions, Calculation and Methodological IssuesCalculation <strong>of</strong> Portfolio at Risk from Portfolio Report:Step 1 – The formula isSum <strong>of</strong> Unpaid Principal Balance <strong>of</strong> All Loans with Payments Past DueTotal Gross Outstanding Loan Portfolio (Sum <strong>of</strong> Principal Outstanding <strong>of</strong> All Loans)Step 2 - Take the Unpaid Principal Balance <strong>of</strong> Past Due Loans for Year 2003 – it is 40,000 (Please refer toPortfolio Report - Table 13, Row P8, Column III for Unpaid Principal Balance <strong>of</strong> Past Due Loans for Year2003)Sl. Description 2001 2002 2003P8 Value <strong>of</strong> outstanding balance <strong>of</strong> loans in arrears (End <strong>of</strong> period) 40,000 40,000 40,000Numerator <strong>of</strong> FormulaStep 3 - Take the Total Gross Outstanding Loan Portfolio for Year 2003 – it is 168,000 (Please refer toPortfolio Report, Row P5, Column III for total gross outstanding loan portfolio for Year 2003)Sl. Description 2001 2002 2003P5 Value <strong>of</strong> loans outstanding (End <strong>of</strong> period) 104,000 140,000 168,000Denominator <strong>of</strong> FormulaStep 4 - Divide Unpaid Principal Balance <strong>of</strong> Past Due Loans by Total Gross Outstanding Loan Portfolio asshown below and, we get Portfolio at Risk as 23.81% for year 2003Sl. Portfolio at Risk 2001 2002 2003P8 Value <strong>of</strong> outstanding balance <strong>of</strong> loans in arrears (End <strong>of</strong> period) (A) 40,000 40,000 40,000P5 Value <strong>of</strong> loans outstanding (End <strong>of</strong> period) (B) 104,000 140,000 168,000Portfolio at Risk Value = A / B = 38.46% 28.57% 23.81%Trend AnalysisLikewise, the portfolio at risk for Years 2001 & 2002 are respectively 38.46% & 28.57%The trend in portfolio at risk is decreasing, which is positive. During the period 2001-2003, Portfolio at Riskhas come down by nearly 14.65% (38.46% - 23.81%) While the Total Outstanding Loan Portfolio has grownby 62% {(168,000 - 104,000) / 104,000) from 2001 to 2003, Portfolio at Risk is reduced only by 38%{(38.46% - 23.81%) / 38.46%} during the same period (there is no change in terms <strong>of</strong> absolute value <strong>of</strong>Portfolio at Risk). However, there have been loan write-<strong>of</strong>fs as well during this period. Hence, reduction inPAR appears to be due to some collection <strong>of</strong> arrears, increase in total outstanding loan portfolio and loanwrite-<strong>of</strong>fs.75
<strong>Tracking</strong> <strong>Financial</strong> <strong>Performance</strong> <strong>Standards</strong> <strong>of</strong> Micr<strong>of</strong>inance InstitutionsCalculation <strong>of</strong> Portfolio at Risk by AgeLook at the aging analysis <strong>of</strong> loans in the table below (bottom part <strong>of</strong> Table 13)Sl.NoAging Analysis <strong>of</strong> Outstanding Loans for Year Ending March 2003Type <strong>of</strong> LoanI II III IV V VI VIIP16 Regular Loans 2810 128,000 76.19 % 0% -P17 Less than 30 Days past due 400 17,500 10.42 % 10% 1,750P18 Between 31- 60 days past due 150 10,000 5.95 % 25% 2,500P19 Between 61- 90 days past due 120 5,000 2.98 % 50% 2,500P20 Between 91- 180 days past due 50 3,500 2.08 % 75% 2,625P21 Between 181- 365 days past due 40 2,500 1.49 % 90% 2,250P22 > 365 days past due 30 1,500 0.89 % 100% 1,500P23 Total 3,600 168,000 100.00% - 13,125PAR > =1 day (past due) is sum <strong>of</strong>PAR < 30 days (past due) – 10.42% (Row P 17, Column V) PLUS (+)PAR 31 – 60 days (past due) – 5.95% (Row P 18, Column V) PLUS (+)PAR 61 – 90 days (past due) – 2.98% (Row P 19, Column V) PLUS (+)PAR 91 – 180 days (past due) – 2.08% (Row P 20, Column V) PLUS (+)PAR 181 – 365 days (past due) – 1.49% (Row P 21, Column V) PLUS (+)PAR > 365days (past due) – 0.89% (Row P 22, Column V)= 10.42%+ 5.95% + 2.98% + 2.08% + 1.49% + 0.89% = 23.81% for the year 2003Similarly, PAR > 30 days (past due) is sum <strong>of</strong>PAR 31 – 60 days (past due) – 5.95% (Row P 18, Column V) PLUS (+)PAR 61 – 90 days (past due) – 2.98% (Row P 19, Column V) PLUS (+)PAR 91 – 180 days (past due) – 2.08% (Row P 20, Column V) PLUS (+)PAR 181 – 365 days (past due) – 1.49% (Row P 21, Column V) PLUS (+)PAR > 365days (past due) – 0.89% (Row P 22, Column V)= 5.95% + 2.98% + 2.08% + 1.49% + 0.89% = 13.39%Likewise, PAR > 60 days (past due) is sum <strong>of</strong>PAR 61 – 90 days (past due) – 2.98% (Row P 19, Column V) PLUS (+)PAR 91 – 180 days (past due) – 2.08% (Row P 20, Column V) PLUS (+)PAR 181 – 365 days (past due) – 1.49% (Row P 21, Column V) PLUS (+)PAR > 365days (past due) – 0.89% (Row P 22, Column V)= 2.98% + 2.08% + 1.49% + 0.89% = 7.44%Similarly, PAR > 90 days (past due) is 4.46%Similarly, PAR > 180 days (past due) is 2.38%Similarly, PAR > 365 days (past due) is 0.89%OutstandingNo. <strong>of</strong> Loans Value <strong>of</strong>Loans(IV) as a % <strong>of</strong>Total LoanOutstandingProvisionRateProvisionAmount76
<strong>Performance</strong> <strong>Standards</strong> - Concept, Definitions, Calculation and Methodological Issues5.1.1.5 What events/activities affect (distort) PAR?Sl.No.Events/Activities thataffect PARImpact onNumeratorImpact onDenominatorImpact on PAR1 ReschedulingDecreasesNumeratorNone• Reduces the whole PAR Ratio, whiledefault risk still exists2 RefinancingDecreases, assumingoverdue amountsare rescheduledIncreases, ifadditional amountsare given to sameclient• Reduces the whole PAR Ratio, whiledefault risk still exists3 Write-<strong>of</strong>fsDecreasesNumeratorDecreasesDenominator• Reduces the whole PAR Ratio, whiledefault risk still exists4 Fresh Loandisbursements for whichrepayments are yet tobegin (including thosewith a long grace /moratorium period)NoneIncreasesDenominator• Reduces the whole PAR Ratio, whiledefault risk still exists5 Incorrect ageing <strong>of</strong> pastdues, based on theinstallment method <strong>of</strong>aging (see Box next page)NoneNone• Distorts the age <strong>of</strong> past dues and affectsprovisioning, reserve and sustainability6 Sequence <strong>of</strong> payments,Principal first and interestnextDecreases thenumeratorNone• Reduces the whole PAR Ratio, whiledefault risk still exists• Distorts the age <strong>of</strong> past dues and affectsprovisioning, reserve and sustainabilityand through reduction <strong>of</strong> interestpayments (yield)7 Weekly RepaymentsNoneNone• Distorts the age <strong>of</strong> past dues and affectsprovisioning, reserve and sustainability• Here, PAR > 30 days will have tointerpreted differently as for a loan withweekly repayments, it means that atleast 4 installments have become pastdue and are at risk. This is very differentfrom the conventional PAR > 30 daysused for loans with monthly repayments8 Balloon Repayments, asin case <strong>of</strong> agricultureloans (> 90 Days orequal to a quarter)NoneNone• Distorts the age <strong>of</strong> past dues (over dues)and affects provisioning, reserve andsustainability• Here, PAR > 30 Days, > 60 Days, > 90Days, etc. have to be redefined andinterpreted accordingly77
<strong>Tracking</strong> <strong>Financial</strong> <strong>Performance</strong> <strong>Standards</strong> <strong>of</strong> Micr<strong>of</strong>inance InstitutionsExample <strong>of</strong> Incorrect Aging andImplications for using PAR as a StandardConsider the following exampleF The loan term finishes on January 31, 2002F The amount overdue is 400 (part <strong>of</strong> which is overdue since December 2001)F The amount per monthly installment is 200F As per the installment method <strong>of</strong> calculation <strong>of</strong> age:Age =Overdue AmountInstallment AmountF The age as on January 31, 2002 is= 400 Divided by 200 = 2.0 MonthsThis is correct.F Now, assume that we are in end May 2002. The age as per the installment aging formula is still 2months (assuming that the client has not paid back any further amounts), which is not correctF But the actual age is 2 months till January + February + March + April + May = 6 monthsF Now, assume that PAR > 60 Days or PAR > 90 Days is used as a standard.F Thus, if the aging done by the MFI is based on the installment (incorrect) method, such loans,which are actually 6 months past due WILL never come into the fold <strong>of</strong> PAR > 60 Days or PAR> 90 Days. And if there are a large number <strong>of</strong> such loans, because <strong>of</strong> the erroneous method <strong>of</strong>aging, the reported PAR values will also portray an incorrect picture and hence, the standard <strong>of</strong>using PAR based on age would also become ineffective.F In fact, after a loan is passed its scheduled loan term, if this incorrect method <strong>of</strong> aging is used, PARby Age will always be under reported. Consider that there are several loans that are actually morethan 180 days past due. While individually they may constitute a small percentage and contributeaccordingly to PAR, cumulatively, if a large number <strong>of</strong> such loans exist, their impact on PARwould become significant. And this becomes even more serious when their age is distorted andPAR by age is used as a standard. This aspect is highlighted sequentially.78
<strong>Performance</strong> <strong>Standards</strong> - Concept, Definitions, Calculation and Methodological Issues5.1.1.6 Adjusting the Portfolio at Risk MeasureAs noted earlier, PAR has a serious limitation in that it is affected by sudden and large increases in outstandingportfolio and/or decreases in the unpaid principal balance, which can be caused in any <strong>of</strong> the followingways:• Disbursement <strong>of</strong> loans (increases outstanding portfolio but will not have an impact on the unpaidprincipal balance <strong>of</strong> past due loans, especially, if the repayment schedule has not begun)• Rescheduling <strong>of</strong> past due loans (reduces the unpaid principal balance <strong>of</strong> past due loans by makingthem current; there is no impact on outstanding portfolio)• Re-financing <strong>of</strong> past due loans (reduces the unpaid principal balance <strong>of</strong> past due loans by makingthem current and also increases the outstanding portfolio)• Loan write-<strong>of</strong>fs (reduces the unpaid principal balance <strong>of</strong> past due loans and also reduces the outstandingportfolio)When the outstanding portfolio increases, then the ratio appears lower and so does the risk. Likewise, whenthe unpaid principal balance <strong>of</strong> past due loans decreases, the ratio becomes smaller and the risk appears less.But actually, the risk is still high.Thus, one has to look at alternative ways <strong>of</strong> measuring PAR, to adjust for re-scheduling/re-financing /write<strong>of</strong>fsand also recent loan disbursements, to get the true picture <strong>of</strong> default risk in the portfolioPAR (without adjustments for rescheduling) + Rescheduling Ratio = PAR (Adjusted for rescheduling). Thisis given in box belowPortfolio at risk (PAR) = Unpaid Principal Balance <strong>of</strong> Loans with Payments Past Due +(Adjusted for Rescheduling) Unpaid Principal Balance <strong>of</strong> re-scheduled loans (when Rescheduled)Outstanding PortfolioLikewise, one can adjust the PAR for re-scheduling and re-financingPortfolio at risk (PAR) = Unpaid Principal Balance <strong>of</strong> Loans with Payments Past Due +(Adjusted for Rescheduling Unpaid principal balance <strong>of</strong> re-scheduled and re-financed loansand Re-financing)Outstanding PortfolioSimilarly, one can adjust the PAR for new loan disbursements for which repayment is yet to beginPortfolio at risk (PAR) =(Adjusted for recentdisbursements)Unpaid Principal Balance <strong>of</strong> Loans with Payments Past DueOutstanding for Loans for which the repayment is yet to begin)Finally, one can also adjust for write-<strong>of</strong>fs, especially, if they have been huge.Portfolio at risk (PAR) = Unpaid Principal Balance <strong>of</strong> Loans with Payments Past Due +(Adjusted for Write-Offs) Write-Off AmountsOutstanding Portfolio + Write-Off AmountsThe impact <strong>of</strong> sudden and large increases in outstanding portfolio and/or decreases in the unpaid principalbalance, on PAR is illustrated ahead with examples.79
<strong>Tracking</strong> <strong>Financial</strong> <strong>Performance</strong> <strong>Standards</strong> <strong>of</strong> Micr<strong>of</strong>inance Institutions5.1.1.7 Impact on Various Scenarios on PARType <strong>of</strong> LoansValue <strong>of</strong> LoansOutstandingSituation 1 – Base CasePercentage <strong>of</strong>PortfolioPortfolio atProvisionRateProvisionAmountRiskCurrent Loans 100,000 59.17% - 0% -Loans < 30 Days Due 10,000 5.92% 5.92% 10% 1,000Loans 31 - 60 Days Due 10,000 5.92% 5.92% 25% 2,500Loans 61 - 90 Days Due 10,000 5.92% 5.92% 50% 5,000Loans 91 - 180 Days Due 10,000 5.92% 5.92% 75% 7,500Loans 181 - 365 Days Due 20,000 11.83% 11.83% 90% 18,000Loans > 365 Days Due 9,000 5.33% 5.33% 100% 9,000Total 169,000 100.00% 40.83% - 43,000PAR (Unadjusted) 40.83%Provision Amount 43,000.PAR (Adjusted) 40.83%Type <strong>of</strong> LoansSituation 2 - Loans greater than 365 days over due Re-scheduledValue <strong>of</strong> LoansOutstandingPercentage <strong>of</strong>PortfolioPortfolio atProvisionRateProvisionAmountRiskCurrent Loans 109,000 64.50% - 0% -Loans < 30 Days Due 10,000 5.92% 5.92% 10% 1,000Loans 31 - 60 Days Due 10,000 5.92% 5.92% 25% 2,500Loans 61 - 90 Days Due 10,000 5.92% 5.92% 50% 5,000Loans 91 - 180 Days Due 10,000 5.92% 5.92% 75% 7,500Loans 181 - 365 Days Due 20,000 11.83% 11.83% 90% 18,000Loans > 365 Days Due - 0.00% 0.00% 100% -Total 169,000 100.00% 35.50% - 34,000PAR (Unadjusted) 35.50%Provision Amount 34,000Re-scheduled Amount 9,000PAR (Adjusted) 40.83%80
<strong>Performance</strong> <strong>Standards</strong> - Concept, Definitions, Calculation and Methodological IssuesSituation 3 - Re-Scheduled Loans > 365 days over due and Re-Financed them Rs 10,000 moreType <strong>of</strong> LoansValue <strong>of</strong> LoansOutstandingPercentage <strong>of</strong>PortfolioPortfolio atProvisionRateProvisionAmountRiskCurrent Loans 119,000 66.48% - 0% -Loans < 30 Days Due 10,000 5.59% 5.59% 10% 1,000Loans 31 - 60 Days Due 10,000 5.59% 5.59% 25% 2,500Loans 61 - 90 Days Due 10,000 5.59% 5.59% 50% 5,000Loans 91 - 180 Days Due 10,000 5.59% 5.59% 75% 7,500Loans 181 - 365 Days Due 20,000 11.17% 11.17% 90% 18,000Loans > 365 Days Due - 0.00% 0.00% 100% -Total 179,000 100.00% 33.52% - 34,000PAR (Unadjusted) 33.52%Provision Amount 34,000Re-scheduled Amount 9,000Re-Financed Amount 10,000PAR (Adjusted) 44.13%Situation 4 - New disbursements <strong>of</strong> Rs 50,000 for which repayment is yet to beginType <strong>of</strong> LoansValue <strong>of</strong> LoansOutstandingPercentage <strong>of</strong>PortfolioPortfolio atProvisionRateProvisionAmountRiskCurrent Loans 150,000 68.49% - 0% -Loans < 30 Days Due 10,000 4.57% 4.57% 10% 1,000Loans 31 - 60 Days Due 10,000 4.57% 4.57% 25% 2,500Loans 61 - 90 Days Due 10,000 4.57% 4.57% 50% 5,000Loans 91 - 180 Days Due 10,000 4.57% 4.57% 75% 7,500Loans 181 - 365 Days Due 20,000 9.13% 9.13% 90% 18,000Loans > 365 Days Due 9,000 4.11% 4.11% 100% 9,000Total 219,000 100.00% 31.51% - 43,000PAR (Unadjusted) 31.51%Provision Amount 43,000Fresh disbursement (Repayment yet to begin) 50,000Unpaid Principal Balance 69,000Outstanding Portfolio (Unadjusted) 219,000Adjusted Outstanding Portfolio 169,000PAR Adjusted 40.83%81
<strong>Tracking</strong> <strong>Financial</strong> <strong>Performance</strong> <strong>Standards</strong> <strong>of</strong> Micr<strong>of</strong>inance InstitutionsType <strong>of</strong> LoansSituation 5 - Write-Off Loans > 365 Days DueValue <strong>of</strong> LoansOutstandingPercentage <strong>of</strong>PortfolioPortfolio atProvisionRateProvisionAmountRiskCurrent Loans 100,000 62.50% - 0% -Loans < 30 Days Due 10,000 6.25% 6.25% 10% 1,000Loans 31 - 60 Days Due 10,000 6.25% 6.25% 25% 2,500Loans 61 - 90 Days Due 10,000 6.25% 6.25% 50% 5,000Loans 91 - 180 Days Due 10,000 6.25% 6.25% 75% 7,500Loans 181 - 365 Days Due 20,000 12.50% 12.50% 90% 18,000Loans > 365 Days Due - 0.00% 0.00% 100% -Total 160,000 100.00% 37.50% - 34,000PAR (Unadjusted) 37.50%Provision Amount (Unadjusted) 34,000Write-Offs 9,000Unpaid Principal Balance 60,000Adjusted Principal Balance 69,000Oustanding Portfolio (Unadjusted) 160,000Adjusted Outstanding Portfolio 169,000PAR Adjusted 40.83%50.00%Impact <strong>of</strong> Various Scenarios on PAR40.00%%30.00%20.00%PAR UnadjustedPAR Adjusted10.00%0.00%Base CaseRe-SchedulingRe-Scheduling/Re-FinancingLargeDisbursementsWrite-<strong>of</strong>fsPAR Unadjusted 40.83% 35.50% 33.52% 31.51% 37.50%PAR Adjusted 40.83% 40.83% 44.13% 40.83% 40.83%Scenarios82
<strong>Performance</strong> <strong>Standards</strong> - Concept, Definitions, Calculation and Methodological Issues5.1.1.8 Loan Re-Scheduling and Re-FinancingMFI should have a clear policy on re-scheduling and re-financing, as they have the potential to decapitalise theRLF portfolio at all levels. They could also result in the ‘multiplier effect’ whereby, after re-scheduling and refinancing<strong>of</strong> some (clients’) loans, other clients also feel that they could get their loans re-scheduled/re-financed{also see section 4.3 (13), (14) and (15) in chapter 4}.In the discussion, re-scheduling stands for revision in repayment terms at a time after the terms were originallyset at time <strong>of</strong> sanction. Re-financing stands for sanctioning another loan while earlier loan is still outstanding,with inherent understanding that apportion /full amount <strong>of</strong> the second loan would be applied in full adjustment<strong>of</strong> the earlier loan.Therefore, unless, the situation mandates, rescheduling and refinancing are better avoided as1. If they are used to reduce delinquency, they can spell disaster for the portfolio2. They make a risky portfolio appear less risky3. Can result in causing clients to develop a mind set that in the event <strong>of</strong> not making loan repayments, theirloans will also be automatically rescheduled/re-financedOnly in cases where natural factors such as earthquakes, fires, cyclones, floods, drought wreak havoc on economiesand the activities <strong>of</strong> micro-entrepreneurs, can rescheduling and/or re-financing be thought <strong>of</strong> as alternatives.Please refer Box below for impact <strong>of</strong> Rescheduling, Refinancing and Write-<strong>of</strong>f on loan loss reserve. Thekey point to note here is that apart from camouflaging the level <strong>of</strong> risk in a portfolio, such actions also reducethe loan loss provisions and reserves. This particularly, is not good, as the level <strong>of</strong> risk still remains the same.The following calculations (please refer to various scenarios in section 5.1.1.7) illustrate the impact <strong>of</strong> rescheduling,re-financing and write-<strong>of</strong>f on loan portfolio qualityScenario Loan Loss % change from CommentsBase Case Reserve Rate in %Base Case 12.72 Not Applicable Correct RepresentationRe-Scheduled Option 5.87 50% Decrease Further Reduction in Loan LossReserve (LLR)Write-Off Option 6.31 54 % Decrease Significant Reduction in LLR(by 50%)Re-Scheduled and 5.24 59 % Decrease Further Reduction in LLRRe-Financed Option83
<strong>Tracking</strong> <strong>Financial</strong> <strong>Performance</strong> <strong>Standards</strong> <strong>of</strong> Micr<strong>of</strong>inance Institutions5.1.2 Current Repayment RateTotal Amount Received during period – Prepayments= _________________________________________________ x 100Total Amount Due 11 (to be collected during period)Trend – An increasing Current Repayment Rate is positiveStandard Proposed by <strong>Sa</strong>-<strong>Dhan</strong> – Current Repayment Rate should exceed 90%5.1.2.1 What does it measure?F Current period repayment rate helps in understanding the behaviour <strong>of</strong> clients and performance <strong>of</strong> theinstitution in the on-going period.F This can be especially useful when the institution has several years <strong>of</strong> micro-finance experience and a largeoverall disbursement, which can usually camouflage ‘poor’ performance in the current period.F In other words, an excellent repayment track record in the past can shroud current poor repayment performance,especially if the volume <strong>of</strong> money lent in the current period is quite small in comparison to that lentcumulatively. Having the current period repayment rate is useful in such cases.5.1.2.2 What minimum records are required for calculating the Current Repayment Rate?F Loan ledger with disbursement, schedule and repayment data on each individual loan backed-up a comprehensivecredit policy outlining various terms and conditionsF Aggregation <strong>of</strong> the loan ledger data with regard to delinquent and current loans – either a simple ageingtable or comprehensive portfolio reportF Key financial statements like the Balance Sheet and Income Statement, appropriately constructed5.1.2.3 How to calculate the Current Repayment Rate?F Create a loan repayment schedule, identify whether the loan is delinquent and age the loan in days withregard to past dues (refer Table 9)F Aggregate loan repayments schedules for all loans and summarise these in the form <strong>of</strong> a simple table (referTable 12)F Define the current period for calculating the repayment ratesF Sum the total principal amount paid so far by clients in current period (see table 12, last row, col. IX).F Sum the prepayments, if any made by them so far. Prepayment would have occurred if the total amountpaid by the client exceeds the amount due from the client (see table 12, last row, col. XI).F Sum the total amounts due from the client till date in the current period - today or date <strong>of</strong> aggregation etc(see table 12, last row, col. VI).F Then do the following calculation to get the Current Repayment Rate11Some MFIs include past dues from previous period to track past due payments that were to be collected84
<strong>Performance</strong> <strong>Standards</strong> - Concept, Definitions, Calculation and Methodological IssuesTotal amounts paid so far by Clients in Current Period – Prepayments x 100%Total amounts due* from Clients till date in Current Period* - Some MFIs include past dues that need to be collected from a previous periodGiven the data in the Table 12, let’s calculate the current repayment rate as per the method suggested1. Total principal amount paid so far by clients (Table 12 – last row, col. IX) = Rs. 387,7002. Prepayment amount as on the date <strong>of</strong> calculation (Table 12 – last row, col. XI) = Rs. 7,5003. Total amounts due till date from client in current period (Table 12 – last row, col. VI) = Rs. 381,500Now, as per the suggested method <strong>of</strong> calculation:(1) – (2) =387,700 – 7,500 =380,200(2) 381,500 381,500= 99.66%5.1.2.4 What aspects affect Current Repayment Rate?F The sequence <strong>of</strong> allocating client repayments – interest first versus principal first – has an impact onrepayment rates. It is suggested that client repayments should be allocated in the following sequence - firstto interest overdue, then to interest due, then to principal overdue and finally to principal dueF When aggregating repayments from various clients, prepayments <strong>of</strong> some clients could smoothen the nonrepaymentby other clients. Hence, prepayments should always be subtracted while calculating repaymentsratesF Current period needs to be defined precisely and consistency maintained with regard to this5.1.2.5 What is the utility <strong>of</strong> Current Repayment Rate?F Monitoring current period delinquency. Can be extremely useful in doing the above if the MFI has been inoperation for a long period <strong>of</strong> timeF Current period repayment rate provides a reflection <strong>of</strong> “how much” <strong>of</strong> the amount due in the currentperiod is being paid by the clients.F It provides an insight regarding what proportion <strong>of</strong> the amount due in current period is still overdue.F In other words, it is a surrogate measure <strong>of</strong> the effectiveness <strong>of</strong> the programme in the current period. It iscrucial to have current period repayment rates especially when an MFI has been operating for a largenumber <strong>of</strong> years.F In such cases, the cumulative repayment rates, based on a large volume <strong>of</strong> loans disbursed, will <strong>of</strong>fer littleinsight into immediate/programme performance.F For example, it is quite possible that a programme, which has done very well for over 10 years, couldsuddenly be performing poorly.F When cumulative disbursements are large, it would be almost impossible to find this out. Current periodrepayment rate is required for this.85
<strong>Tracking</strong> <strong>Financial</strong> <strong>Performance</strong> <strong>Standards</strong> <strong>of</strong> Micr<strong>of</strong>inance Institutions5.1.2.6 Are Repayment Rates indeed reliable and valid indicators <strong>of</strong> asset quality?F While they are indeed useful, repayment rates are not reliable and valid indicators <strong>of</strong> asset (portfolio)quality.F As evident from the example given in Table 12, it is possible to have a very high repayment rate and yet avery high portfolio at risk - in excess <strong>of</strong> 80% (illustration is given at end <strong>of</strong> this section).F While many MFIs use repayment rates to measure default risk in a portfolio, it must be remembered thatrepayment rates primarily express the amount paid by clients as a percentage <strong>of</strong> the amounts due fromthem.F They do not measure default risk in a portfolio.F In fact, the portfolio outstanding does not appear in the numerator or denominator in the repayment rateformula. Therefore, using repayment rates to get a measure <strong>of</strong> the default risk is inappropriate.Calculation from Table 12 (see table below) demonstrates as to why Repayment Rates are not a Reliable/Valid Indicator <strong>of</strong> Portfolio QualityIndicator Formula Value(in %)Cumulative Repayment Rate (CRR)PAR (Portfolio at Risk)Portfolio at Risk AdjustedColumn IX Total – Column XI TotalColumn VI Total 99.66%Column XIII TotalColumn XII Total 38.79%Column XIII TotalColumn XII Total - (Sum <strong>of</strong> Row 13+14, Column XII) 81.19%86
<strong>Performance</strong> <strong>Standards</strong> - Concept, Definitions, Calculation and Methodological Issues5.2 EFFICIENCY AND PRODUCTIVITY STANDARDSEfficiency Ratios1. Efficiency ratios help answer the question as to whether the institution serves as many people as possiblewith its resources for the lowest possible cost2. They measure the cost <strong>of</strong> providing services (loans) to generate revenue. These costs are referred to asoperating costs and should include neither financing costs nor loan loss provisions3. Total operating costs can be stated as percentage <strong>of</strong> three amounts to measure the efficiency <strong>of</strong> the MFI: theaverage portfolio outstanding or average performing assets or total assets. For a more detailed analysis,operating costs can also be broken down to measure efficiency <strong>of</strong> specific cost elements such as salaries andbenefits, occupational expenses such as rent and utilities, or travel4. For MFIs that mobilise deposits, efficiency ratios will be somewhat different because additional operatingcosts are incurred to collect deposits. Therefore, efficiency ratios <strong>of</strong> MFIs that collect deposits should notbe compared to MFIs that do not collect deposits. This analysis focuses only on the credit operationsIn MFIs, three key factors influence the level <strong>of</strong> activities and hence operating costs:1. Turnover <strong>of</strong> the loan portfolio (related to loan term)2. Average loan size3. Maturity (or experience) <strong>of</strong> the institution. 12The impact <strong>of</strong> these three factors and the corresponding efficiency <strong>of</strong> operations can be analysed by looking atoperating costs as a percentage <strong>of</strong> portfolio outstanding and at the costs associated with lending on a per unit<strong>of</strong> currency basis or a per loan basis. All <strong>of</strong> these ratios have important implications for the cost <strong>of</strong> capital forthe ultimate client - the rural and urban poor. These two efficiency ratios are:1. Operating cost ratio2. Total Cost RatioUtility <strong>of</strong> Efficiency Ratios1. Efficiency ratios provide information about the rate at which MFIs generate revenue to cover their expenses2. By calculating and comparing efficiency ratios over time, MFIs can determine whether they are indeedmaximizing (optimising) the use <strong>of</strong> their resources3. Efficiency ratios can be used to compare performance over time as well as measure improvements in anMFI’s operations across an extended time period. This is the descriptive part where one can understand, “howthe MFIs performance has changed over time?”4. By taking the performance <strong>of</strong> the MFI as a whole, branches, credit <strong>of</strong>ficers, or other operating units (asappropriate), an MFI can begin to determine the “optimum” relationships between key operating factors(including inputs and outputs).12The maturity <strong>of</strong> the institution refers to how long the programme has been operating: are systems well developed? are staff fullytrained? has a reasonable scale been reached? In short, is the institution well advanced along the learning curve? does it have a goodexperience curve?87
<strong>Tracking</strong> <strong>Financial</strong> <strong>Performance</strong> <strong>Standards</strong> <strong>of</strong> Micr<strong>of</strong>inance Institutions5. While such relationships could <strong>of</strong>ten be specific to the model <strong>of</strong> Micr<strong>of</strong>inance adopted by the MFI, itsstrategic context and other issues germane to its existence, the key issue here is that such a longitudinalcomparative analysis provides a sound historical basis for understanding the relationships and arriving atan “optimum”.6. If applicable and necessary and without confounding the levels <strong>of</strong> analysis that may exist, managers couldcompare operating units and determine where they might need to minimise costs, maximise revenues and/or do both to increase pr<strong>of</strong>itability. This is the diagnostic issue where the MFI management can attempt toanalyse various relationships and attempt to answer questions such as, “how to reduce costs and/or increaserevenues to ensure higher pr<strong>of</strong>itability?The various statements/reports/records required for calculating EFFICIENCY RATIOS are given belowStatements/Reports Required for Calculation <strong>of</strong> Efficiency RatiosStatement/Reports / Records RequirementsPortfolio Report with Aging AnalysisBalance SheetIncome StatementLoan Ledger (Individual)Yes, this is requiredCould be used if appropriately structured, especially toinclude information on past due and restructured loansYes, this is requiredYes, required and very important5.2.1 Operating Cost RatioOperating Costs during period_________________________________Average Outstanding Loan PortfolioTrend - A decreasing Operating Cost Ratio is positiveStandard Proposed by <strong>Sa</strong>-<strong>Dhan</strong> – Operating Cost Ratio should not exceed 20%5.2.1.1 What is meant by the Operating Cost Ratio? - Simple DefinitionF Operating Cost Ratio is a percentage (%)F This ratio is perhaps the best indicator <strong>of</strong> the overall efficiency <strong>of</strong> a lending institution. For this reason, theratio is also commonly referred to as Administrative Efficiency ratio: it measures the institutional cost <strong>of</strong>delivering loan services. The lower the Operating Cost Ratio, the higher the efficiency <strong>of</strong> an institution.F This ratio is affected by increasing or decreasing operational costs relative to the average loan portfoliooutstanding.88
<strong>Performance</strong> <strong>Standards</strong> - Concept, Definitions, Calculation and Methodological Issues5.2.1.2 What does it measure?F It is the key measure <strong>of</strong> the efficiency <strong>of</strong> the lending operations. If the performing assets are primarily loansfunds, this ratio shows how much the institution must spend on all operating costs (salaries, rent, <strong>of</strong>fice,vehicles, etc.) to keep a unit <strong>of</strong> money loaned out for one year’s time.F If an institution selects an efficient methodology and employs a highly productive staff, the operating costratio will drop, resulting in a more sustainable institution. In an organisation, a downward trend in thisratio highlights the increasing efficiency <strong>of</strong> the organisation.5.2.1.3 What minimum records are required for calculating the ratio?F Loan ledger with disbursement, schedule and repayment data on each individual loan backed-up acomprehensive credit policy outlining various terms and conditionsF Aggregation <strong>of</strong> the loan ledger data with regard to delinquent and current loans – either a simple agingtable or comprehensive portfolio reportF Key financial statements like the Balance Sheet and Income Statement, appropriately constructed5.2.1.4 What events/activities affect (distort) the Operating Cost Ratio?F Portfolio size, loan size, methodology and salary incentives have an impact on this ratio. Portfolio sizematters and while small MFIs can become more efficient by growing, beyond a point, the importance <strong>of</strong>economics <strong>of</strong> scale diminishes rapidly and other factors become crucial.F Loan size certainly has a much stronger impact on efficiency.F Also, the operating expenses <strong>of</strong> rural MFIs are much higher since their clients are more widely dispersed.Hence, rural programmes tend to have higher operating cost ratiosF Standardisation <strong>of</strong> Micr<strong>of</strong>inance operations should also help in a reduced operating cost ratioF This ratio is also affected by unreported and/or hidden subsidiesF Organisations providing micro-credit as well as other services can allocate costs in such a way that theircredit operations look more efficient than they really areF When MFIs allocate costs to subsidiaries or do not carry them on the books at all, for instance whendonors meet certain costs, such as paying for consultants or health workers collect loans/savings – this ratiois affected5.2.1.5 How to calculate the ratio?1. From the income statement, sum all expenses {refer Table 8 (a), IS 20)} related to the operations <strong>of</strong> theMFI. These typically would included:1. <strong>Sa</strong>laries and Benefits {refer Table 8 (a), IS 14)}2. Administrative Expenses {refer Table 8 (a), IS 15)}3. Occupancy Expenses {refer Table 8 (a), IS 16)}4. Travel {refer Table 8 (a), IS 17)}5. Depreciation {refer Table 8 (a), IS 18)}6. Other {refer Table 8 (a), IS 19)}Interest and provision expenses and extraordinary expenses should not be included89
<strong>Tracking</strong> <strong>Financial</strong> <strong>Performance</strong> <strong>Standards</strong> <strong>of</strong> Micr<strong>of</strong>inance Institutions2. From the portfolio report, calculate the average outstanding portfolio during the period (for instance, ayear) using the following procedure:F Divide the period (year) into appropriate sub-periods – for example, a year could be divided into 12sub-periods <strong>of</strong> a month each (see Table 14 below)F Take the actual loans outstanding at the beginning <strong>of</strong> the period (say April 1, 2001)F Add to this the sum <strong>of</strong> loans outstanding at the end <strong>of</strong> each sub-period (i.e., month)F Then compute Average Loan Outstanding as followsAverage Loan Outstanding (During Period) = B + E1 + E2 +E3+ ... E 12133. Divide Operating Costs during period by Average Loans Outstanding to get the Operating Cost RatioTable – 14 Process for Computing Average Loan OutstandingApril 1, 2002 Actual Loan Outstanding at Beginning <strong>of</strong> Period B1April 30, 2002 Actual Loan Outstanding at End <strong>of</strong> Sub-Period 1 E 1May 31, 2002 Actual Loan Outstanding at End <strong>of</strong> Sub-Period 2 E 2June 30, 2002 Actual Loan Outstanding at End <strong>of</strong> Sub-Period 3 E 3July 31, 2002 Actual Loan Outstanding at End <strong>of</strong> Sub-Period 4 E 4August 31, 2002 Actual Loan Outstanding at End <strong>of</strong> Sub-Period 5 E 5September 30, 2002 Actual Loan Outstanding at End <strong>of</strong> Sub-Period 6 E 6October 31, 2002 Actual Loan Outstanding at End <strong>of</strong> Sub-Period 7 E 7November 30, 2002 Actual Loan Outstanding at End <strong>of</strong> Sub-Period 8 E 8December 31, 2002 Actual Loan Outstanding at End <strong>of</strong> Sub-Period 9 E 9January 31, 2003 Actual Loan Outstanding at End <strong>of</strong> Sub-Period 10 E 10February 28, 2003 Actual Loan Outstanding at End <strong>of</strong> Sub-Period 11 E 11March 31, 2003 Actual Loan Outstanding at End <strong>of</strong> Sub-Period 12 E 1213 Data Points Actual Loan Outstanding Amount Sum <strong>of</strong> B1 +E1 + E2 + … E1290
<strong>Performance</strong> <strong>Standards</strong> - Concept, Definitions, Calculation and Methodological IssuesThe calculation <strong>of</strong> Operating Cost Ratio from financial statements is illustrated below:Step 1 – Use the formula given belowOperating Costs_________________________________________________________Average Loan Portfolio OutstandingStep 2 - Take the Operating Cost for Year 2001 – it is 21,800 {refer Table 8 (a), IS 20) for Year 2001}Sl. Description 2001 2002 2003IS 20 Total Operating Costs (A) 21,800 26,200 28,600Numerator <strong>of</strong> FormulaStep 3 - Take the Average Loan Portfolio Outstanding for Year 2001 – it is 90,000 (refer to Portfolio Report –Table 13, P6 for Year 2001)Sl. Description 2001 2002 2003P6 Average Loan Portfolio Outstanding (B) 90,000 122,000 150,000Denominator <strong>of</strong> FormulaStep 4 - Divide Operating Cost by Average Loan Portfolio Outstanding and as shown below, we getOperating Cost Ratio as 24.22% for year 2001Operating Cost Ratio 2001 2001 2002Operating Cost (A) 21,800 26,200 28,600Average Loan Portfolio Outstanding (B) 90,000 122,000 150,000Operating Cost Ratio Value = A/B = 24.22% 21.48% 19.07%Step 5 - Likewise, as given above, Operating Cost Ratio for Years 2002 and 2003 are 21.48% and 19.07%respectively.91
<strong>Tracking</strong> <strong>Financial</strong> <strong>Performance</strong> <strong>Standards</strong> <strong>of</strong> Micr<strong>of</strong>inance Institutions5.2.2 Total Cost RatioOperating Costs during period + Cost <strong>of</strong> Funds + Loan Loss Provision________________________________________________________________________Average Outstanding Loan PortfolioTrend - A decreasing Total Cost Ratio is positive but sufficient attention must be given to the cost <strong>of</strong> fundsaspects and also loan loss provision createdStandard Proposed by <strong>Sa</strong>-<strong>Dhan</strong> – Total Cost Ratio should not exceed 30%5.2.2.1 What is meant by the Total Cost Ratio? - Simple DefinitionF Total Cost Ratio is a percentage (%)F Like the operating cost ratio, this ratio is an indicator <strong>of</strong> the overall efficiency <strong>of</strong> a lending institution. Thelower the total Cost Ratio, the higher the efficiency <strong>of</strong> an institutionF However, because costs <strong>of</strong> funds and loan loss provision are included here, greater care must be exercisedwhile interpreting the ratio5.2.2.2 What does it measure?F If the performing assets are primarily loans funds, this ratio shows how much the institution must spendon all costs (salaries, rent, <strong>of</strong>fice, vehicles, sourcing capital and making provisions etc.) to keep a unit <strong>of</strong>money loaned out for one year’s time.F If an institution selects an efficient methodology and employs a highly productive staff, the total cost ratiowill drop, resulting in a more sustainable institution. In an organisation, a downward trend in this ratiohighlights the increasing efficiency <strong>of</strong> the organisation. But, again because the cost <strong>of</strong> funds and loan lossprovision are included, a decreasing ratio may not necessarily be good (or positive) because the numeratorcan be decreased by accessing subsidised funds as well as having lower provisions than mandated by theportfolio quality.5.2.2.3 What minimum records are required for calculating the ratio?F Loan ledger with disbursement, schedule and repayment data on each individual loan backed-up acomprehensive credit policy outlining various terms and conditionsF Aggregation <strong>of</strong> the loan ledger data with regard to delinquent and current loans – either a simple agingtable or comprehensive portfolio reportF Key financial statements like the Balance Sheet and Income Statement, appropriately constructed5.2.2.4 What events/activities affect (distort) the Total Cost Ratio?F Portfolio size, loan size, methodology and salary incentives have an impact on this ratio. Portfolio sizematters and while small MFIs can become more efficient by growing, beyond a point, the importance <strong>of</strong>economics <strong>of</strong> scale diminishes rapidly and other factors become crucial.F Loan size certainly has a much stronger impact on efficiency.92
<strong>Performance</strong> <strong>Standards</strong> - Concept, Definitions, Calculation and Methodological IssuesF Also, the operating expenses <strong>of</strong> rural MFIs are much higher since their clients are more widely dispersed.Hence, rural programmes tend to have higher total cost ratiosF Standardisation <strong>of</strong> micro-finance operations should also help in a reduced total cost ratioF This ratio is also affected by unreported and/or hidden subsidiesF Organisations providing micro-credit as well as other services can allocate costs in such a way that theircredit operations look more efficient than they really areF When MFIs allocate costs to subsidiaries or do not carry them on the books at all, for instance whendonors meet certain costs, such as paying for consultants or health workers collect loans/savings – this ratiois affectedF Finally, because the cost <strong>of</strong> funds and loan loss provision are included, a decreasing ratio may not necessarilybe good (or positive) because the numerator can be decreased by accessing subsidized funds as well ashaving lower provisions than mandated by the portfolio quality5.2.2.5 How to calculate the ratio?1. From the income statement {refer Table 8 (a)}, sum all expenses related to micro-financing, including cost<strong>of</strong> fund and loan loss provision. These typically would included:I. Operational Costs {refer Table 8 (a), IS 20)}a) <strong>Sa</strong>laries and Benefits {refer Table 8 (a), IS 14)}b) Administrative Expenses {refer Table 8 (a), IS 15)}c) Occupancy Expenses {refer Table 8 (a), IS 16)}d) Travel {refer Table 8 (a), IS 17)}e) Depreciation {refer Table 8 (a), IS 18)}f) Other {refer Table 8 (a), IS 19)}II. Cost <strong>of</strong> Funds {refer Table 8 (a), IS 9)}III. Loan Loss Provisions {refer Table 8 (a), IS 11)}2. From the portfolio report (refer Table 13 - row P6), calculate the average outstanding portfolio during theperiod (for instance, a year) using the following procedure:a) Divide the period (year) into appropriate sub-periods – for example, a year could be dividedinto 12 sub-periods <strong>of</strong> a month each (see Table 14)b) Take the actual loans outstanding at the beginning <strong>of</strong> the period (say April 1 st , 2001)c) Add to this the sum <strong>of</strong> loans outstanding at the end <strong>of</strong> each sub-period (i.e., month)d) Then compute Average Loan Outstanding as followse) Average Loan Outstanding (During Period) = B + E1 + E2 +E3+ ... E 12133. Divide Total Costs during period by Avg. Loans Outstanding to get Total Cost Ratio93
<strong>Tracking</strong> <strong>Financial</strong> <strong>Performance</strong> <strong>Standards</strong> <strong>of</strong> Micr<strong>of</strong>inance InstitutionsThe calculation <strong>of</strong> Total Cost Ratio from financial statements is illustrated below :Step 1 – Use the formula given belowOperating Costs + Cost <strong>of</strong> Funds + Loan Loss Provision__________________________________________________Average Loan Portfolio OutstandingStep 2 - Take the Operating Cost, <strong>Financial</strong> Expenses, and Loan loss Provision amountfor Year 2001 – it is 34,200=(21800+2,400+10,000) {refer Table 8 (a), IS 20, IS 09 & IS 11) for Year 2001}Sl. Description 2001 2002 2003IS 20 Total Operating Costs (A) 21,800 26,200 28,600IS 09 Total <strong>Financial</strong> Expenses (B) 2,400 7,000 7,400IS 11 Provision for loan Losses (C) 10,000 6,000 5,000TOTAL 34,200 39,200 41,000Numerator <strong>of</strong> FormulaStep 3 - Take the Average Loan Portfolio Outstanding for Year 2001 – it is 90,000 (refer to Portfolio Report –Table 13, row P6 for Year 2001)Sl. Description 2001 2002 2003P6 Average Loan Portfolio Outstanding (D) 90,000 122,000 150,000Denominator <strong>of</strong> FormulaStep 4 - Divide (Operating Cost + Cost <strong>of</strong> Funds + Loan loss provision) by Average Loan Portfolio Outstandingand as shown below, we get Total Cost Ratio as 38.00% for year 2001Total Cost Ratio 2001 2001 2002Operating Cost (A) + Cost <strong>of</strong> Funds (B) + Loan loss provision (C) 34,200 39,200 41,000Average Loan Portfolio Outstanding (D) 90,000 122,000 150,000Total Cost Ratio Value = (A+B+C) / D = 38.00% 32.13% 27.33%Step 5 - Likewise, as given above, Total Cost Ratio for Years 2002 and 2003 are 32.13% and 27.33% respectively.94
<strong>Performance</strong> <strong>Standards</strong> - Concept, Definitions, Calculation and Methodological IssuesProductivity Ratio1. By calculating and comparing productivity ratios over time, MFIs can determine whether they are indeedmaximizing (optimizing) the use <strong>of</strong> their resources2. Productivity refers to the volume <strong>of</strong> business (output) that is generated for a given resource (input) – e.g.20 field workers (input), managing 7,000 clients (output) that are generating income for MFI.3. These ratios focus on the productivity <strong>of</strong> the credit <strong>of</strong>ficers {see section 4.3 (12) for definition}, because,they are the primary generators <strong>of</strong> revenue. In fact, increasingly, credit <strong>of</strong>ficers are getting to be viewed aspr<strong>of</strong>it centers (by MFIs), whereby they are expected to generate revenue in excess <strong>of</strong> all their expenses(direct and allocated to them).5.2.3 Active Borrowers Per Credit OfficerAverage Number <strong>of</strong> Active Borrowers_____________________________________________Average Number <strong>of</strong> Credit OfficersTrend – An increasing number <strong>of</strong> active borrowers {see section 4.3 (3) for definition} per Credit Officer ispositive. This again is based on the experience curve phenomenon according to which, with passage <strong>of</strong> time,the staff get more efficient at what they have been doing and therefore, will be able to do more <strong>of</strong> this workwithout (negatively) affecting quality.Standard Proposed by <strong>Sa</strong>-<strong>Dhan</strong> – Active borrowers/credit <strong>of</strong>ficer should be 250-350 Clients5.2.3.1 What does the ratio Active borrowers Per Credit Officer mean? - Simple DefinitionF Active borrowers per credit <strong>of</strong>ficer is a number (#) ratioF In simple terms, it highlights the “number <strong>of</strong> active clients serviced by a credit <strong>of</strong>ficer”F It measures the overall productivity <strong>of</strong> the MFI’s total human resources in managing clients who have anoutstanding loan balance and are thereby contributing to the financial revenue <strong>of</strong> MFI.F This indicator is valuable for monitoring staff productivity and for determining institutional operatingefficiency. The caseload is determined by the methodological aspects <strong>of</strong> the institution, with well-designedinstitutions capable <strong>of</strong> reaching higher numbers <strong>of</strong> borrowers per loan <strong>of</strong>ficer.5.2.3.2 What does it measure?F It captures the productivity <strong>of</strong> staff – the higher the ratio the more productive the institution.F Indirectly, the ratio says a fair amount about how well the MFI has adapted its processes and procedures toits business purpose <strong>of</strong> lending to micro-finance clientsF Low staff productivity usually does not mean that staff work less, but that they are tied up in excessive andtime-consuming paperwork and procedures (like filling-up <strong>of</strong> SHG records etc)F The no. <strong>of</strong> active borrowers per credit <strong>of</strong>ficer varies depending on the method <strong>of</strong> credit delivery andwhether or not loans are made to individuals, to individuals as group members, or to groupsF For each MFI there is an optimal no. <strong>of</strong> clients that each credit <strong>of</strong>ficer can manage effectivelyF While salary costs may appear lower when credit <strong>of</strong>ficers carry a large no. <strong>of</strong> clients, too many clients mayresult in higher loan losses, which can be more than <strong>of</strong>fsetting lower administrative costs.95
<strong>Tracking</strong> <strong>Financial</strong> <strong>Performance</strong> <strong>Standards</strong> <strong>of</strong> Micr<strong>of</strong>inance Institutions5.2.3.3 What minimum records are required for calculating the ratio?F Loan ledger with disbursement, schedule and repayment data on each individual loan backed-up a comprehensivecredit policy outlining various terms and conditionsF Aggregation <strong>of</strong> the loan ledger data with regard to delinquent and current loans – either a simple ageingtable or comprehensive portfolio reportF Key financial statements like the Balance Sheet and Income Statement, appropriately constructedF Staffing details including portfolio and other data disaggregated by credit <strong>of</strong>ficers5.2.3.4 What strategic issues affect (distort) the ratio?F Defining a credit <strong>of</strong>ficer is very crucial - A credit <strong>of</strong>ficer is a full-time employee whom the MFI acknowledgesas such and it is normally understood that the person works at least for 8 hours a day and minimum <strong>of</strong> 5days a week.F Given the various methodological and other problems associated with productivity ratios, using averageamounts (both in the numerator and denominator) is preferable.F The distinction <strong>of</strong> active borrowers is also important to avoid possible confusion with (1) number <strong>of</strong> activeloans, when a single loan goes to a group <strong>of</strong> individuals, and (2) cumulative loans disbursed during theperiod as opposed to “active “ borrowers who currently have outstanding loans.F For the purpose <strong>of</strong> this manual, it is assumed that each loan reported is held by one borrower. Where thatis not the case, borrowers would have to be counted separately.F When comparing this ratio with other MFIs (or between different branches or different lending productswith in the same MFI), it is also necessary to take into account the average loan term because this greatlyaffects the number <strong>of</strong> borrowers a credit <strong>of</strong>ficer need not spend as much time processing renewals as shewould if the loan terms were shorter. If this is the case, a credit <strong>of</strong>ficer should in theory be able to carrymore active borrowers than a credit <strong>of</strong>ficer working with shorter loan terms (assuming all other factors arethe same).F Some MFIs lend only to groups (SHGs) and here the conceptual decision <strong>of</strong> whether, the group should betreated as the borrower or if the members <strong>of</strong> the group should be so considered, is a difficult choice. Ineither case, there are advantages and disadvantages but the key issue is that it would be fair and appropriateto discern and determine the correct level <strong>of</strong> analysis with regard to who should be taken as the borrower.This aspect gets particularly complicated as illustrated by the following example - consider that an MFIlends to a group with 23 members but loans are in turn taken only by 7 members. For the purpose <strong>of</strong>computing this ratio, should we say that this loan was given to a group <strong>of</strong> 23 members or it was distributedamong 7 members. It is a tough situation and arguments can be made for both cases. Therefore, it isimperative that when comparisons are made across MFIs with different methodologies, this aspect <strong>of</strong> theunit <strong>of</strong> analysis (in terms <strong>of</strong> who is the borrower) must be conceptually clarified upfront.F A key aspect for this and other productivity ratios is that while credit <strong>of</strong>ficers could indeed be efficient,there could be a whole lot <strong>of</strong> other staff contributing to inefficiency. Hence, all measures that use credit<strong>of</strong>ficers in the denominator should be interpreted with caution96
<strong>Performance</strong> <strong>Standards</strong> - Concept, Definitions, Calculation and Methodological Issues5.2.3.5 How to calculate the ratio?1) Have clear and upfront definitions <strong>of</strong> active borrowers and credit <strong>of</strong>ficers2) Calculate the average number <strong>of</strong> active borrowers during the period (for instance, a year) – this should beavailable in the portfolio report or aggregated loan ledger or other reporting formats3) Calculate the average number <strong>of</strong> credit <strong>of</strong>ficers during the period (for instance, a year) - this should also beavailable in the portfolio report4) Divide the average number <strong>of</strong> active borrowers by the average number <strong>of</strong> credit <strong>of</strong>ficers to obtain the ratiovalueAs noted earlier, period averages are much more meaningful when they are computed on a monthly or at leasta quarterly basis. When using such sub-period averages, the numerator is the opening balance plus the sum <strong>of</strong>the balance at the end <strong>of</strong> each sub-period, while the denominator is the number <strong>of</strong> sub-periods plus one.As an example, a quarterly average would be calculated as:P avg = (Pº + P¹+P 2 +P 3 +P 4 )(4+1)The calculation <strong>of</strong> Active Borrowers Per Credit Officer from Portfolio Report is illustrated below:Step 1 – Use the formula given belowAverage Number <strong>of</strong> Active Borrowers____________________________________Average Number <strong>of</strong> Credit OfficersStep 2 - Take the Average Number <strong>of</strong> Active Borrowers for Year 2001 – it is 2,170 (Please refer to PortfolioReport, Table 13, Row P4, Column III for Average No. <strong>of</strong> Active Borrowers for Year 2001)Sl. Description 2001 2002 2003P4 Average Number <strong>of</strong> Active Borrowers (A) 2,170 2,870 3,350Numerator <strong>of</strong> FormulaStep 3 - Take the Average Number <strong>of</strong> Credit Officers for Year 2001 – it is 8 (Please refer to Table 13, Row P12,Column III for Average Number <strong>of</strong> Credit Officers for Year 2001)Sl. Description 2001 2002 2003P12 Average Number <strong>of</strong> Credit Officers (B) 8 12 12Denominator <strong>of</strong> FormulaStep 4 - Divide Average Number <strong>of</strong> Active Borrowers by Average Number <strong>of</strong> Credit Officers and as shownbelow, we get Active Borrowers Per Credit Officer as 271for year 2001Active Borrowers Per Credit Officer 2001 2002 2003Average Number <strong>of</strong> Active Borrowers (A) 2170 2870 3350Average Number <strong>of</strong> Credit Officers (B) 8 12 12Active Borrowers Per Credit Officer Value = A/B = 271 239 279Step 5 - Likewise, as given above, the average number <strong>of</strong> active borrowers per credit <strong>of</strong>ficer for Years 2002and 2003 are 239 and 279 respectively.97
<strong>Tracking</strong> <strong>Financial</strong> <strong>Performance</strong> <strong>Standards</strong> <strong>of</strong> Micr<strong>of</strong>inance Institutions5.3 FINANCIAL VIABILITY STANDARDS1. <strong>Financial</strong> viability refers to the ability <strong>of</strong> an MFI to cover its expenses with earned revenue.2. Revenue is generated when the assets <strong>of</strong> an MFI are invested or put to productive use.3. Expenses are incurred to earn that revenue.4. Thus, to determine financial viability, revenue is compared to expenses through self-sufficiency indicators.5. If revenue is greater that expenses, the MFI is self-sufficient. Some <strong>of</strong> the commonly used indicators <strong>of</strong> selfsufficiencyare:F Operational Self-SufficiencyF <strong>Financial</strong> Self-SufficiencyLevels <strong>of</strong> Self-Sufficiency – From Four to Two• As the micr<strong>of</strong>inance industry matures, the definition <strong>of</strong> self-sufficiency has begun to narrow• A few years ago people spoke about four levels <strong>of</strong> self-sufficiency that an MFI should progressivelyaim to achieve.• Some analysts considered an MFI to be operationally self-sufficiency (level one) if the revenue itgenerated from operations covered its operating costs; level 2 self-sufficiency meant that the MFIcovered its operational costs plus loan loss provisions from operating revenue• Reaching level three meant that an MFI generated enough revenue to cover financing costs, operatingexpenses, and loan provisions.• Level four (financial self-sufficiency) referred to revenue that covered non-financial and financialexpenses calculated on a commercial basis- “pr<strong>of</strong>it without subsidy” (Christen and others 1995).• Currently, however, most people in the micr<strong>of</strong>inance industry refer to only two levels <strong>of</strong> self-sufficiency:operational self-sufficiency and financial self-sufficiency.The various statements/reports/records required for calculating Viability Ratio are given belowPortfolio Report with Ageing AnalysisBalance SheetIncome StatementStatements/Reports Required for Calculation <strong>of</strong> Viability RatiosLoan Ledger (Individual loan account details)98
<strong>Performance</strong> <strong>Standards</strong> - Concept, Definitions, Calculation and Methodological Issues5.3.1 Operating Self-SufficiencyOperating Income (Loans + Investments)________________________________________________________Operating Costs + Loan Loss Provisions + Financing CostsTrend – An increasing Operating Self-Sufficiency ratio is positiveStandard Proposed by <strong>Sa</strong>-<strong>Dhan</strong> – Operating Self-Sufficiency should equal 100%5.3.1.1 What is meant by Operating Self-Sufficiency? - Simple DefinitionF Operating self-sufficiency is a percentage (%)F Operating Self-Sufficiency indicates whether or not enough revenue has been earned to cover the MFI’stotal costs – operational expenses, loan loss provisions and financial costs.5.3.1.2 What does it measure?F It is an important measure <strong>of</strong> sustainability <strong>of</strong> the lending operationsF Looking at the ratio as a self-sufficiency figure allows determination <strong>of</strong> the extent to which operations arebecoming (increasingly) self-sustaining.F Operational self-sufficiency thus indicates whether or not enough revenue has been earned to cover theMFI’s direct costs, excluding the (adjusted) cost <strong>of</strong> capital but including any actual financing costs inincurred.F If an MFI does not reach operational self-sufficiency, eventually its equity (loan fund capital) will bereduced by losses (unless additional grants can be raised to cover operating shortfalls). This means thatthere will be a smaller amount <strong>of</strong> funds to loan to borrowers, (which could lead to closing the MFI oncethe funds run out).F To increase its self-sufficiency, the MFI must either increase its yield (return on assets) or decrease itsexpenses (financing costs, provisions for loan losses, or operating costs).5.3.1.3 What minimum records are required for calculating the Ratio?F Loan ledger with disbursement, schedule and repayment data on each individual loan backed-up a comprehensivecredit policy outlining various terms and conditionsF Aggregation <strong>of</strong> the loan ledger data with regard to delinquent and current loans – either a simple ageingtable or comprehensive portfolio reportF Key financial statements like the Balance Sheet and Income Statement, adjusted for loan losses, depreciation& accrued interest99
<strong>Tracking</strong> <strong>Financial</strong> <strong>Performance</strong> <strong>Standards</strong> <strong>of</strong> Micr<strong>of</strong>inance InstitutionsDefining Operational Self- Sufficiency – Alternative View Points• The definition <strong>of</strong> operational self-sufficiency varies among different MFIs and donors.• The difference centres on the inclusion <strong>of</strong> financing costs. Whereas actual financing costs used to beincluded only in levels three and four (as mentioned earlier), some analysts include them in calculatingboth operational and financial self-sufficiency and some only in calculating financial self-sufficiency.• Some MFIs argue that operational self-sufficiency should not include financing costs, because not allMFIs incur financing costs equally, which thus makes the comparison <strong>of</strong> self-sufficiency ratios betweeninstitutions less relevant.• While some MFIs fund all <strong>of</strong> their loans with grants or concessional loans and do not need to borrowfunds–or collect savings–and thus either do not incur any financing costs or incur minimal costs.• Other MFIs, as they move progressively toward financial viability, are able to access concessional orcommercial borrowings and thus incur financing costs.• However, all MFIs incur operating expenses and the cost <strong>of</strong> making loan loss provisions, and they shouldbe measured on the management <strong>of</strong> these costs alone.• Furthermore, these MFIs argue that they should not be penalised for accessing commercial fundingsources (through the inclusion <strong>of</strong> financing costs in the formula), nor should MFIs that are able t<strong>of</strong>inance all <strong>of</strong> their loans with donor funds be rewarded.• The choice <strong>of</strong> which formula to use is personal, because both are correct. However, it is important thatwhen comparing institutions, the analyst determine that the same formula has been used, because nostandard definition has yet been established.5.3.1.4 What events/activities affect (distort) the ratio?F This ratio is also affected by unaccounted, unreported and/or hidden subsidies with regard to operationsF Organisations providing micro-credit as well as other services can allocate costs in such a way that theircredit operations look more sustainable than they really areF When MFIs allocate costs to subsidiaries or do not carry them on the books at all, for instance whendonors meet certain costs, such as paying for consultants or health workers collect loans/savings – this ratiois affected5.3.1.5 How to calculate the ratio?1. From the income statement, sum up all operating income. This would include:F Interest on Current and Past Due Loans {refer Table 8 (a), IS 1)}F Loan Fees and Service Charges {refer Table 8 (a), IS 2)}F Late Fees on Loans {refer Table 8 (a), IS 3)}F Interest on Investment {refer Table 8 (a), IS 5)}GRANT INCOME SHOULD NOT BE INCLUDED2. From the income statement {refer Table 8 (a)}, sum all expenses related Micr<strong>of</strong>inancing, including cost <strong>of</strong>fund and loan loss provision. These typically would included:I. Operational Costs 13 {refer Table 8 (a), IS 20)}a) <strong>Sa</strong>laries and Benefits {refer Table 8 (a), IS 14)}b) Administrative Expenses {refer Table 8 (a), IS 15)}13The cost <strong>of</strong> promotion <strong>of</strong> SHGs should be treated as an expense for the period100
<strong>Performance</strong> <strong>Standards</strong> - Concept, Definitions, Calculation and Methodological Issuesc) Occupancy Expenses {refer Table 8 (a), IS 16)}d) Travel {refer Table 8 (a), IS 17)}e) Depreciation {refer Table 8 (a), IS 18)}f) Other {refer Table 8 (a), IS 19)}II. Cost <strong>of</strong> Funds {refer Table 8 (a), IS 9)}III. Loan Loss Provisions {refer Table 8 (a), IS 11)}3. Divide Total Operating Income by Total Direct Expenses (Operating + Loan Loss Provision + FinancingCosts) to get Operational Self-Sufficiency.The calculation <strong>of</strong> Operational Self-Sufficiency from Income Statement is illustrated below:Step 1 – Use the formula given belowOperating Income (Loans + Investments)____________________________________________________________Operating Costs + Financing Costs + Loan Loss ProvisionStep 2 - Take the Operating Income (Loans + Investments) for Year 2001 – it is 27,200 {refer to IncomeStatement - Table 8 (a), IS 6, for Year 2001}Sl. Description 2001 2002 2003IS 6 Total Operating Income (A) 27,200 37,700 43,000Numerator <strong>of</strong> FormulaStep 3 - Take the Operating Cost, <strong>Financial</strong> Expenses, and Loan loss Provision amountfor Year 2001 – it is 34,200=(21800+2,400+10,000) {refer Table 8 (a), IS 20, IS 09 & IS 11) for Year 2001}Sl. Description 2001 2002 2003IS 20 Total Operating Costs (B) 21,800 26,200 28,600IS 09 Total <strong>Financial</strong> Expenses (C) 2,400 7,000 7,400IS 11 Provision for loan Losses (D) 10,000 6,000 5,000TOTAL 34,200 39,200 41,000Denominator <strong>of</strong> FormulaStep 4 - Divide Operating Income (Loans + Investments) by Operating Costs + Financing Costs + Loan LossProvision as shown below, we get Operational Self-Sufficiency as 79.53% for year 2001Operational Self-Sufficiency 2001 2002 2003Total Operating Income (A) 27,200 37,700 43,000Operating Costs (A) + Financing Costs (C) + Loan Loss Provision (D) 34,200 39,200 41,000Operational Self-Sufficiency Value = A/(B+C+D) = 79.53% 96.17% 104.88%Step 5 - Likewise, as given above, Operational Self-Sufficiency for Years 2001 and 2002 are 96.17% and104.88% respectively.101
<strong>Tracking</strong> <strong>Financial</strong> <strong>Performance</strong> <strong>Standards</strong> <strong>of</strong> Micr<strong>of</strong>inance InstitutionsANNEXURES102
<strong>Performance</strong> Indicators <strong>of</strong> Micr<strong>of</strong>inance Institutions : Some Popular Tools used WorldwideAnnex1PERFORMANCE INDICATORS FOR MICROFINANCEINSTITUTIONS : SOME POPULAR TOOLS USEDWORLDWIDESl.No.Name <strong>of</strong>Tool/InstitutionBroad performance areaIndicators to measure performance1. CAMEL, ACCIONCAMEL analyses thefive traditionalaspects considered tobe most important inthe operation <strong>of</strong> afinancialintermediary.These five areasreflect the financialcondition and generaloperational strength<strong>of</strong> the MFI and arebriefly summarised inthe next column.1. C-Capital adequacy. The capital position <strong>of</strong> theinstitution and its capacity to support growth <strong>of</strong>the loan portfolio as well as a potentialdeterioration in assets are assessed. The CAMELanalysis looks at the institution’s ability to raiseadditional equity in the case <strong>of</strong> losses and itsability and policies to establish reserves againstthe inherent risk in its operations.2. A-Asset quality. The overall quality <strong>of</strong> the loanportfolio and other assets, includinginfrastructure (for example, <strong>of</strong>ficer location andenvironment), is examined. This requiresanalysing the level <strong>of</strong> portfolio at risk and write<strong>of</strong>fs,as well as the appropriateness <strong>of</strong> the portfolioclassification system, collection procedures, andwrite-<strong>of</strong>f policies.Quantitative• Leverage• Reserve adequacyQualitative• Ability to raise equityQuantitative• Portfolio at Risk(> 30 days past due)• Write-<strong>of</strong>fsQualitative• Portfolio classification system• Productivity <strong>of</strong> long-term assets• Infrastructure3. M-Management. Human resource policy, thegeneral management <strong>of</strong> the institution,management information systems, internalcontrol and auditing, and strategic planning andbudgeting are examined as distinct areas thatreflects the overall quality <strong>of</strong> management.Qualitative• Governance/Management• Human resources• Processes, controls, and audit• Information technology system• Strategic planning and budgeting4. E-Earning. The key components <strong>of</strong> revenues andexpense are analysed, including the level <strong>of</strong>operational efficiency and the institution’sinterest rate policy as well as the overall resultsas measured by return on equity and return onassets.Quantitative• Adjusted return on equity• Operational efficiency• Adjusted return on assetsQualitative• Interest rate Policy4. L-Liquidity. This component <strong>of</strong> the analysislooks at the institution’s ability to projectfunding needs in general and credit demand inparticular. The liability structure <strong>of</strong> theinstitution, as well as the productivity <strong>of</strong> itscurrent assets, is also an important aspect <strong>of</strong>the overall assessment <strong>of</strong> an institution’sliquidity management.Quantitative• Productivity <strong>of</strong> other current assetsQualitative• Liability Structure• Availability <strong>of</strong> Funds to MeetCredit Demand• Cash Flow ProjectionsSource: <strong>Sa</strong>ltzman, Rock and <strong>Sa</strong>linger 1998103
<strong>Tracking</strong> <strong>Financial</strong> <strong>Performance</strong> <strong>Standards</strong> <strong>of</strong> Micr<strong>of</strong>inance InstitutionsSl.No.Name <strong>of</strong>Tool/Institution2. Micr<strong>of</strong>inance InformationExchange (MIX)MIX is a not for pr<strong>of</strong>itprivate organisation thatsupports the growth &development <strong>of</strong> a healthyMicr<strong>of</strong>inance sector.Through its publication -Micro Banking Bulletinthat is one <strong>of</strong> the principaloutputs <strong>of</strong> Micro bankingstandards project fundedby CGAP, it collectsfinancial & portfolio dataprovided voluntarily byMFIs, primarily to helpMFI managers and boardmembers to understandtheir performance vis-a-visother MFIs.Secondary objectiveincludes establishingindustry performancestandards and enhancetransparency <strong>of</strong> financialreporting <strong>of</strong> MFIs worldwide.To address the issue <strong>of</strong>diversity in operatingenvironment <strong>of</strong> MFIs,while comparing thefinancial and portfoliodata, it has adopted a peergroup framework, wherefinancial performance <strong>of</strong>MFIs are compared amongpeer group members on 7broad parameters.Broad performance areaInstitutional maturity, size andoutreachPr<strong>of</strong>itability and SustainabilityIncome and ExpensesEfficiencyProductivityPortfolio qualityCapital and Liability structureIndicators to measure performance• Age <strong>of</strong> institution• Number <strong>of</strong> <strong>of</strong>fices• Number <strong>of</strong> personnel• Number <strong>of</strong> active borrowers• Percent <strong>of</strong> women borrowers• Adjusted return on Assets• Adjusted return on equity• Operational self-sufficiency• <strong>Financial</strong> self-sufficiency• Adjusted pr<strong>of</strong>it margin• Adjusted operating income ratio• Adjusted total expense ratio• Yield on gross portfolio• Yield on gross portfolio (real)• Adjusted financial expense ratio• Adjustment expense ratio• Loan loss provision expense ratio• Adjusted personnel expense ratio• Adjusted administrative expense ratio• Adjusted operating expense ratio• Adjusted operating expense / Loan portfolio• Adjusted personnel expense / Loan portfolio• Adjusted administrative expense/Loan portfolio• Average salary / GNP per capita• Personnel productivity(No. <strong>of</strong> active clients/No. <strong>of</strong> all staff)• Loan <strong>of</strong>ficer productivity(No. <strong>of</strong> clients/No. <strong>of</strong> loan <strong>of</strong>ficer)• Personnel allocation ratio(No. <strong>of</strong> loan <strong>of</strong>ficer/No. <strong>of</strong> staff)• Average outstanding loan size• Depth(Avg. outstanding loan size/GNP per capita)• Portfolio at risk (> 30 days)• Portfolio at risk (> 90 days)• Commercial funding liabilities ratio• Capital / Asset ratioSource: Micro-Banking Bulletin (November 2002)104
<strong>Performance</strong> Indicators <strong>of</strong> Micr<strong>of</strong>inance Institutions : Some Popular Tools used WorldwideSl.No.Name <strong>of</strong>Tool/InstitutionBroad performance areaIndicators to measure performance3. GIRAFE, PlaNet FinanceThe G.I.R.A.F.E ratingand evaluation instrumentwas developed by PlaNetFinance. This ratingevaluation is bothquantitative andqualitative to cover the fullrange <strong>of</strong> risks faced by apotential investor.G.I.R.A.F.E focuses on sixareas <strong>of</strong> assessment. Thesix areas <strong>of</strong> assessment aredivided into 26 factors;both quantitative andqualitative. The qualitativefactors cover mostly thegovernance, theinformation systems andrisks coverage issues. Thequantitative factors need afinancial analysis andpreliminary adjustments,in order to make financialinformation comparablebetween institutions.1. G - Governance anddecision making process2. I - Information andmanagement tools3. R - Risk analysis andcontrol4. A - Activities and loanportfolio5. F - Financing: liabilitiesand equity6. E - Efficiency andpr<strong>of</strong>itability1. Maturity <strong>of</strong> institution2. Balance and efficiency <strong>of</strong> the governance system3. Technical organization <strong>of</strong> governance4. Weight <strong>of</strong> governance in relation to expenses5. Internal skills6. Staff turnover ratio7. Training efficiency1. Technical support for information systems2. Information management3. Organization <strong>of</strong> technical departments1. Identification <strong>of</strong> risks2. Coverage <strong>of</strong> risks by internal control1. Global balance <strong>of</strong> assets on balance sheet2. Relevance <strong>of</strong> services3. Loan portfolio management4. Write <strong>of</strong>f ratio5. Portfolio at risk (> 31 days)1. Overall assessment2. Ratio <strong>of</strong> transformation equities into assets1. Administrative efficiency ratio2. Operating efficiency ratio3. Staff ratio4. Adjusted return on average assets5. Adjusted return on average equity6. Operating self-sufficiency7. <strong>Financial</strong> self-sufficiencySource: PlaNet Finance, 2000105
<strong>Tracking</strong> <strong>Financial</strong> <strong>Performance</strong> <strong>Standards</strong> <strong>of</strong> Micr<strong>of</strong>inance InstitutionsSl.No.Name <strong>of</strong>Tool/InstitutionBroad performance areaIndicators to measure performance4. Small EnterpriseEducation andPromotion(SEEP)This guide setsout a frameworkfor analysing, thefinancialcondition <strong>of</strong> anMFI. Theframework isdivided intothree groups,each <strong>of</strong> whichcomprises a set <strong>of</strong>ratios.1. The first group <strong>of</strong>ratios analyses thefinancial sustainability<strong>of</strong> the MFI – or theability <strong>of</strong> an MFI tomeet the needs <strong>of</strong> itsclientele withoutreliance on externalassistance.Return on performing assets =<strong>Financial</strong> cost ratio =Loan loss provision ratio =Operating cost ratio =Adjusted cost <strong>of</strong> capital =<strong>Financial</strong> incomeAverage performing assets<strong>Financial</strong> costsAverage performing assetsLoan loss provisionsAverage performing assetsOperating expensesAverage performing assets[(Inflation X (net worth –net fixed assets)] +[(inflation – int. rate paid)X conc. loans]Average performing assetsDonations and grants ratio =Donations and grantsAverage performing assetsOperating self-sufficiency =<strong>Financial</strong> incomeFin. & Opr. costs +Loan loss provision<strong>Financial</strong> self-sufficiency =<strong>Financial</strong> incomeFin. & Opr. costs +Loan loss provision +Imputed cost <strong>of</strong> capitalContd. next page106
<strong>Performance</strong> Indicators <strong>of</strong> Micr<strong>of</strong>inance Institutions : Some Popular Tools used WorldwideSl.No.Name <strong>of</strong>Tool/Institution4. Small EnterpriseEducation andPromotion(SEEP)Broad performance area2. The second group <strong>of</strong>ratios analysesfinancial efficiency <strong>of</strong>MFIs. They must beconcerned withserving as manypeople as possiblewith their resources.Indicators to measure performanceOperating costsCost per unit <strong>of</strong> money lent =Total amount disbursedOperating costsCost per loan made =Number <strong>of</strong> loans made3. The third group <strong>of</strong>ratios helps MFIsmonitor their portfolioquality. If the quality<strong>of</strong> the portfolio ispoor, the MFI cannotcontinue to operate inthe long term.No. <strong>of</strong> active borrowers =per credit <strong>of</strong>ficerPortfolio per credit <strong>of</strong>ficer =Portfolio in arrears =Portfolio at risk =Loan loss ratio =Reserve ratio =Average no. <strong>of</strong> active borrowersAverage no. <strong>of</strong> credit <strong>of</strong>ficersAverage loan outstandingAverage no. <strong>of</strong> credit <strong>of</strong>ficersPayments in arrearsValue <strong>of</strong> loans outstandingBalance <strong>of</strong> loans in arrearsValue <strong>of</strong> loans outstandingAmount written <strong>of</strong>fAverage loans outstandingLoan loss reserveValue <strong>of</strong> loans outstandingSource: SEEP Network, 1995107
<strong>Tracking</strong> <strong>Financial</strong> <strong>Performance</strong> <strong>Standards</strong> <strong>of</strong> Micr<strong>of</strong>inance InstitutionsSl.No.Name <strong>of</strong>Tool/InstitutionBroad performance areaIndicators to measure performance5. PEARLS, WorldCouncil <strong>of</strong> CreditUnions (WOCCU)PEARLS is a system<strong>of</strong> 45 financial ratiosthat the WOCCUuses worldwide tomonitor the performanceand creditunions. It wasoriginally designedand implementedwith Guatemalancredit unions in thelate 1980s.The WOCCU nowuses it to create auniversal financiallanguage that eachcredit union canspeak and understand,to generatecomparative creditunion rankings, andto provide theframework for asupervisor unit at thesecond tier. Each ratiohas a standard targetor goal that eachcredit union shouldstrive to achieve.1. P - Protection (7 ratios). Refers toadequate protection <strong>of</strong> assets.Protection is measured by comparingthe adequacy <strong>of</strong> the provision for loanlosses against the amount <strong>of</strong> delinquentloans. Protection was deemed adequateif a credit union had sufficientprovisions to cover 100 percent <strong>of</strong> allloans delinquent for more than 12months and 35 percent <strong>of</strong> all loansdelinquent for 1-12 months.2. E - Efficiency financial structure (9ratio). Determines growth potential,earnings capacity, and overall financialstrength. Ratios measure assets,liabilities, and capital, and theirassociated targets constitute an idealstructure for credit unions.3. A - Asset quality (3 ratios). Ratiosmeasure the impact <strong>of</strong> assets that donot generate income.1. Allowance for loan losses / Allowancesrequired for loans delinquent > 12 months2. Net allowance for loan losses / Allowancesrequired for loans delinquent < 12 months3. Total charge-<strong>of</strong>f <strong>of</strong> delinquent loans >12months4. Annual loan charge-<strong>of</strong>fs5. Accumulated loan recoveries/Accumulated loan charge-<strong>of</strong>fs6. Solvency7. Allowances for investment losses/Non-regulated investments1. Net loans/Total assets2. Liquid investments / Total assets3. <strong>Financial</strong> investments / Total assets4. Non-financial investments / Total assets5. <strong>Sa</strong>vings deposits / Total assets6. External credit / Total assets7. Member share capital / Total assets8. Institutional capital / Total assets9. Net institutional capital/ Total assets1. Total loan delinquency / Gross loanportfolio2. Non-earning assets / Total assets3. Net institutional & Transitory capital +Non interest-bearing liabilities / NonearningassetsContd. next page108
<strong>Performance</strong> Indicators <strong>of</strong> Micr<strong>of</strong>inance Institutions : Some Popular Tools used WorldwideSl.No.Name <strong>of</strong>Tool/InstitutionBroad performance area5. PEARLS, WOCCU 4. R - Rate <strong>of</strong> return and costs (12 ratios).Disaggregates the essential components<strong>of</strong> net earnings (by investments to helpmanagement calculate investmentyields and evaluate operating expense.The result more clearly indicatewhether the credit union is earning andpaying market rate on its assets,liabilities and capital.5. L - Liquidity (3 ratios). Reveals if thecredit union is administering its cashto meet deposit withdrawalrequirements and liquidity reserverequirements, while minimising theamount <strong>of</strong> idle funds.6. S - Signs <strong>of</strong> growth (11 ratios).Measures both financial andmembership growth. By comparingasset growth to other key areas it ispossible to detect changes in thebalance sheet structure that could havea positive or negative impact onearnings. Growth <strong>of</strong> institutionalcapital is the indicator <strong>of</strong> pr<strong>of</strong>itabilityand success, particularly if it isproportionately greater than the growthin assets.Indicators to measure performance1. Net loan income / Average net loanportfolio2. Total liquid investment income /Avg. liquid investments3. Total fin. investment income /Avg. fin. Investments4. Total non-fin. investment income /Avg. non-fin. investments5. Total interest cost on savings deposit/Avg. savings deposit6. Total interest cost on external credit /Avg. external credit7. Total dividend paid on shares /Avg. member shares8. Total gross income margin /Avg. total assets9. Total operating expenses /Avg. total assets10. Total loan loss provision expense /Avg. total assets11. Non-Recurring Income or Expense /Avg. total assets12. Net income / Avg. total assets1. (Short-term investments + Liquid assets- Short-term payables) / <strong>Sa</strong>vings deposits2. Liquidity reserves / <strong>Sa</strong>vings deposits3. Non-earning liquid assets / Total assets1. Growth in loans to members2. Growth in liquid investments3. Growth in financial investments4. Growth in non-financial investments5. Growth in savings deposits6. Growth in external credit7. Growth in share capital8. Growth in institutional capital9. Growth in net institutional capital10. Growth in membership11. Growth in total assetsSource:: Richardson, 2001109
<strong>Tracking</strong> <strong>Financial</strong> <strong>Performance</strong> <strong>Standards</strong> <strong>of</strong> Micr<strong>of</strong>inance InstitutionsSl.No.Name <strong>of</strong>Tool/Institution6. Women's World Banking(WWB)WWB has been a leader inbuilding consensus, firstamong leading MFIs, thenwith donors and policymakerson the keyindicators needed tomeasure performance <strong>of</strong>MFIs. The performanceindicators recommendedby WWB are divided intoqualitative andquantitative categoriesThe emphasis is on MFIsachieving minimum agreedperformance standards andtaking significantincremental steps toimprove performance.Broad performance areaQuantitativePortfolio Size and QualityEfficiencySelf-sufficiency/ Pr<strong>of</strong>itabilityKey Demographic Data onClientsInterest RatesQualitativeReach <strong>of</strong> client group - focus onthe poorMFI Management, Structuresand SystemsIndicators to measure performance• Gross portfolio outstanding - at beginning andend <strong>of</strong> year• Total number <strong>of</strong> loans disbursed during theperiod• Repayment rate on time and/or as <strong>of</strong> 30 days• Portfolio at risk on time and/or as <strong>of</strong> 30 days• Cost per unit <strong>of</strong> money lent - based on amount<strong>of</strong> loans disbursed in the period based on avg.portfolio outstanding• Number <strong>of</strong> loans per credit staff person• Operational self-sufficiency <strong>of</strong> credit & savingsoperations and overall, including and excludingcosts <strong>of</strong> funds• Overall financial self-sufficiency• Return on performing assets• Average loan size• Percentage <strong>of</strong> loans below $500• Number <strong>of</strong> active borrowers• Percentage <strong>of</strong> borrowers below poverty line• Percentage <strong>of</strong> repeat credit clients for previousyears• Number <strong>of</strong> savers• Total deposits at beginning and end <strong>of</strong> the period• Percentage <strong>of</strong> borrowers who are women• Percentage <strong>of</strong> savers who are women• Percentage <strong>of</strong> board members who are women• Percentage <strong>of</strong> total staff that are women• Positive interest rates charged to clients in relationto inflation, commercial bank price rate, andadministrative costs <strong>of</strong> inflation• Resource Base• Reduction in subsidies, donor dependence• Evidence <strong>of</strong> focus on the poor• Methodology• Use <strong>of</strong> collateral substitutes• <strong>Sa</strong>vings• Vision and mission• Governance• <strong>Financial</strong>, credit and management informationsystems• Legal structures• <strong>Financial</strong> reporting• Management and staff• Business plan, financial projections• Effective operating systemsSource: Women’s World Banking 2001110
Glossary <strong>of</strong> <strong>Financial</strong> TermsAnnex2GLOSSARY OF FINANCIAL TERMSTermAccountDefinitionAccount form <strong>of</strong> Balance SheetAccount PayableAccount ReceivableAccountantFormal record that represents, in words, money or other unit <strong>of</strong> measurement,certain resources, claims to such resources, transactions or other events thatresult in changes to those resources and claims. An individual form or recordused to record and summarize information related to each asset, each liability,and each aspect <strong>of</strong> owner's equity.The form used to record additions anddeductions for each individual asset, liability, capital, revenue, and expense.A balance sheet with assets on the left-hand side and liabilities and capital onthe right-hand side.Amount owed to a creditor for delivered goods or completed services. A liabilitycreated by a purchase made on credit.Claim against a debtor for an uncollected amount, generally from a completedtransaction <strong>of</strong> sales or services rendered.Person skilled in the recording and reporting <strong>of</strong> financial transactions.Accountants' Report Formal document that communicates an independent accountant's: (1)expression <strong>of</strong> limited assurance on <strong>Financial</strong> Statements as a result <strong>of</strong>performing inquiry and analytic procedures (Review Report); (2) results <strong>of</strong>procedures performed (Agreed-Upon Procedures Report); (3) non-expression<strong>of</strong> opinion or any form <strong>of</strong> assurance on a presentation in the form <strong>of</strong> financialstatements information that is the representation <strong>of</strong> management (CompilationReport); or (4) an opinion on an assertion made by management in accordancewith the Statements on <strong>Standards</strong> for Attestation Engagements (AttestationReport). An accountants' report does not result from the performance <strong>of</strong> anAudit.AccountingAccounting ChangeAccounting CycleAccounting EquationAccounting PeriodRecording and reporting <strong>of</strong> financial transactions, including the origination<strong>of</strong> the transaction, its recognition, processing, and summarisation in the<strong>Financial</strong> Statements. The process <strong>of</strong> recording, summarizing, analyzing, andinterpreting financial (money-related) activities to permit individuals andorganizations to make informed judgments and decisions.The process <strong>of</strong>identifying, measuring, and communicating economic information to permitinformed judgments and decisions by users <strong>of</strong> the information.Change in (1) an accounting principle; (2) an accounting estimate; or (3) thereporting entity that necessitates disclosure and explanation in publishedfinancial reports.The steps involved in the recording and summarizing processes <strong>of</strong> accounting.The principal accounting procedures employed to process transactions duringa fiscal period.The equation that expresses the relationship between the accounting elementsin a simple mathematical form: Assets = Liabilities + Owner's Equity.The period <strong>of</strong> time for which operating and financial statements are regularlyprepared. A period that is typically one year; however, it can be any length <strong>of</strong>time for which accounting records are maintained, <strong>of</strong>ten for a month.111
<strong>Tracking</strong> <strong>Financial</strong> <strong>Performance</strong> <strong>Standards</strong> <strong>of</strong> Micr<strong>of</strong>inance InstitutionsTermAccounts PayableAccounts Payable LedgerAccounts ReceivableAccounts Receivable AccountAccounts Receivable LedgerAccounts Receivable TurnoverAccrual BasisAccrualAccrued ExpensesAccrued RevenueAccrued <strong>Sa</strong>lariesAccumulated DepreciationAcid-Test RatioAdditionAdequate Disclosure PrincipleAdjusting EntriesAging ScheduleDefinitionThe liability that results from purchasing goods or services on credit.Amountsentities owe suppliers for goods and services. Listed in the current liabilitiessection on the statement <strong>of</strong> financial position.A subsidiary ledger that lists the individual accounts <strong>of</strong> creditors. Also calledthe creditors' ledger.The asset arising from selling goods or services on credit to customers. Listedin the current assets section on the statement <strong>of</strong> financial position.An asset account that shows the total currency (dollar or rupee or pound)amount due from credit customers.A subsidiary ledger containing only accounts <strong>of</strong> credit customers; also calledthe customers' (debtors) ledger.A measure that indicates how quickly an entity is collecting its accountsreceivable. Calculated by dividing net credit sales by average net accountsreceivable.Method <strong>of</strong> accounting that recognizes revenue when earned, rather than whencollected. Expenses are recognized when incurred rather than when paid. Thebasis <strong>of</strong> accounting that requires that revenue is recorded when earned, nomatter when cash is received, and that expenses are recorded when incurred,no matter when cash is paid.An expense or a revenue that gradually increases with the passage <strong>of</strong> time.Expenses that build up or accumulate during the current period but will notbe paid until the next period. Also called accrued liabilities.Unbilled amountsearned by others during a given period which are not yet dueRevenue that has been earned in the current accounting period but will not bereceived until the next period. Also called accrued assets. Accrued interest isan example from the financial services and micro-finance sector<strong>Sa</strong>laries that are unpaid (and unrecorded) at the end <strong>of</strong> an accounting period.Also called accrued wages.Total depreciation pertaining to an asset or group <strong>of</strong> assets from the time theassets were placed in services until the date <strong>of</strong> the financial statement. Thetotal depreciation from the start <strong>of</strong> the life <strong>of</strong> a physical asset to any point intime.This total is the Contra Account to the related asset account.The ratio <strong>of</strong> the sum <strong>of</strong> cash, receivables, and marketable securities to currentliabilities.The ratio <strong>of</strong> quick assets to current liabilities. A yardstick commonlyused is a 1-to-1 ratio. Also called quick ratio.A capital expenditure that literally adds on to an existing physical asset. Thecost <strong>of</strong> an addition is debited to the physical asset account.States that financial statements or the explanatory notes and schedules that gowith the statements must disclose all relevant data about the financial position<strong>of</strong> an entityEntries made at the end <strong>of</strong> an accounting period to bring the balances <strong>of</strong>certain accounts up to date.A schedule in which accounts receivable are grouped into age categories andan estimated bad debts rate is applied to each age category.112
Glossary <strong>of</strong> <strong>Financial</strong> TermsTermAging the ReceivablesAllowance MethodAmortizationAmortizationAnalytical ProceduresAnnual ReportAnnuityApportionmentAppropriation <strong>of</strong> RetainedEarningsAppropriationsAssetDefinitionA way <strong>of</strong> estimating bad debts expense when using the balance sheet approach.The process <strong>of</strong> analyzing the accounts receivable and classifying them accordingto various age groupings with the due date being the base point for determiningage.A method <strong>of</strong> accounting for bad debts in which the amount estimated to beuncollectible is established at the end <strong>of</strong> an accounting period in an adjustingentry. Uncollectible accounts are then written <strong>of</strong>f by debiting Allowance forDoubtful Accounts.The method <strong>of</strong> accounting for uncollectible receivables,by which advance provision for the uncollectibles is made.Gradual and periodic reduction <strong>of</strong> any amount, such as the periodic writedown <strong>of</strong> a bond premium, the cost <strong>of</strong> an intangible asset or periodic payment<strong>of</strong> mortgages or other debt.The periodic write-<strong>of</strong>f <strong>of</strong> the cost <strong>of</strong> an intangible asset. The periodic expenseattributed to the decline in usefulness <strong>of</strong> an intangible asset or the allocation<strong>of</strong> bond premium or discount over the life <strong>of</strong> a bond issue.Substantive tests <strong>of</strong> financial information which examine relationships amongdata as a means <strong>of</strong> obtaining evidence. Such procedures include: (1) comparison<strong>of</strong> financial information with information <strong>of</strong> comparable prior periods; (2)comparison <strong>of</strong> financial information with anticipated results (e.g., forecasts);(3) study <strong>of</strong> relationships between elements <strong>of</strong> financial information that shouldconform to predictable patterns based on the entity's experience; (4)comparison <strong>of</strong> financial information with industry norms.Report to the stockholders <strong>of</strong> a company which includes the company's annual,audited Balance Sheet and related statements <strong>of</strong> earnings, stockholders' orowners' equity and cash flows, as well as other financial and businessinformation. A report a company publishes for its stockholders at the end <strong>of</strong>each fiscal year. The report includes required elements such as an auditors'report and the company's statement <strong>of</strong> earnings, statement <strong>of</strong> financial position,and statement <strong>of</strong> cash flows. The report also includes elements such as lettersand articles by the company's executives, information on its financial condition,and significant events.Series <strong>of</strong> payments, usually payable at specified time intervals.The process <strong>of</strong> dividing operating expenses among departments.A portion <strong>of</strong> retained earnings earmarked for a specific purpose, such asexpansion or the retirement <strong>of</strong> debt. The amount appropriated may not beused for cash or stock dividends.The process <strong>of</strong> authorizing future payments from budgeted income. Onlymoney that is appropriated can be spent.Any item <strong>of</strong> economic value, either physical in nature (such as land or buildings)or a right to ownership, as expressed in cost or some other value, owned by anindividual or entity. Anything <strong>of</strong> value. Any interest in real or personal property,which can be appropriated for the payment <strong>of</strong> debt. Anything companiesown. These things might be physical assets such as buildings, trucks, inventories<strong>of</strong> products, equipment, and cash. Or these things might be intangible assetssuch as goodwill, trademarks, and patents. Listed as a category on the statement<strong>of</strong> financial position.113
<strong>Tracking</strong> <strong>Financial</strong> <strong>Performance</strong> <strong>Standards</strong> <strong>of</strong> Micr<strong>of</strong>inance InstitutionsTermAuditAudit EngagementAudit RiskAudit <strong>Sa</strong>mplingAuditing <strong>Standards</strong>AuditorAuditors' OpinionAutomated Data ProcessingAuxiliary RecordAverage Collection Period forAccounts ReceivableBacklogBad DebtBalanceDefinitionA review <strong>of</strong> (1) the operating, administrative, and financial activities <strong>of</strong> anagency for conformance with all legal and administrative requirements andconformance with the principles <strong>of</strong> economy and efficiency; or (2) selectedclaims, cost proposals, grants, loans, or similar agreements entered into by anagency for conformance with the principles <strong>of</strong> economy and efficiency.Agreement between an audit firm and its client to perform an audit.The risk that the auditor may unknowingly fail to modify appropriately his orher opinion on financial statements that are materially misstated.Application <strong>of</strong> an audit procedure to less than 100% <strong>of</strong> the items within anaccount balance or class <strong>of</strong> transactions for the purpose <strong>of</strong> evaluating somecharacteristic <strong>of</strong> the balance or class.Guidelines to which an auditor adheres. auditing standards encompass theauditor's pr<strong>of</strong>essional qualities, as well as his or her judgment in performingan audit and in preparing the auditors' report.Person who audits financial accounts and records kept by others. a person orfirm an entity hires as an independent third party to review its financialinformation. The auditor's main purpose is to make sure the statement <strong>of</strong>earnings, statement <strong>of</strong> financial position, and statement <strong>of</strong> cash flows fairlypresent the company's financial condition, and that they comply with auditingstandards set forth by the various regulatory bodiesA summary <strong>of</strong> the findings <strong>of</strong> a firm <strong>of</strong> certified public accountants (Charteredaccountants) that audits, or examines, a company's financial statements. Thisreport is included in the company's annual report. Also called auditors' reportand report <strong>of</strong> independent accountants.The general term applied to the processing <strong>of</strong> data by mechanical or electronicequipment that operates with a minimum <strong>of</strong> manual intervention.A business record that is not essential but is helpful in maintaining recordsthat are essential; an example is the petty cash payments record.A rough measure <strong>of</strong> the length <strong>of</strong> time accounts receivable have beenoutstanding. Calculated by dividing 365 days by the accounts receivableturnover.The amount <strong>of</strong> a company's unfilled orders at the end <strong>of</strong> the year. When thecompany fills the orders the following year, it records the revenue on thestatement <strong>of</strong> earnings. Frequently, a company will give its perspective on backlogin the management discussion section in the annual report.A debt that is not collectible and is therefore worthless to the creditor. All orportion <strong>of</strong> an Account, loan, or note receivable considered to beuncollectible.An account receivable that, for one reason or another, cannot becollected.Sum <strong>of</strong> debit entries minus the sum <strong>of</strong> credit entries in an account. if positive,the difference is called a debit balance; if negative, a credit balance. Thebalance <strong>of</strong> an account is determined by footing (adding) the debit side,footing the credit side, and calculating the difference between the two sides.114
Glossary <strong>of</strong> <strong>Financial</strong> TermsTermBalance Form <strong>of</strong> AccountBalance <strong>of</strong> an AccountBalance SheetBalance Sheet ApproachBank Checking AccountBank DiscountBank ReconciliationBank StatementBankruptcyBoard <strong>of</strong> DirectorsBook <strong>of</strong> Original EntryBook ValueBook Value <strong>of</strong> Asset.Book ValueBookkeepingDefinitionA ledger account form with four amount columns that many businesses preferto use because the balance is always known and it is easy to see whether thebalance is a debit or a credit. Also called the four-column account form.The amount <strong>of</strong> difference between the debits and the credits that have beenentered into an account.<strong>Financial</strong> statement presenting measures <strong>of</strong> the assets, liabilities and owner'sequity or net worth <strong>of</strong> business firm or nonpr<strong>of</strong>it organization as <strong>of</strong> a specificmoment in time. Basic financial statement, usually accompanied by appropriatedisclosures that describe the basis <strong>of</strong> accounting used in its preparation andpresentation <strong>of</strong> a specified date the entity's assets, liabilities and the equity <strong>of</strong>its owners. also known as a statement <strong>of</strong> financial condition. A listing <strong>of</strong> afirm's assets, liabilities, and owner's equity at a specific point in time. Otherterms used to describe the balance sheet are statement <strong>of</strong> financial positionand position statement.A method <strong>of</strong> estimating the bad debts expense under the allowance method inwhich the expense is based on aging the accounts receivable.An amount <strong>of</strong> cash on deposit with a bank that the bank must pay at thewritten order <strong>of</strong> the depositor.Interest deducted in advance by a bank.Making the bank statement balance agree with the checkbook balance.Themethod <strong>of</strong> analysis that details the items that are responsible for the differencebetween the cash balance reported in the bank statement and the balance <strong>of</strong>the cash account in the ledger.A monthly report showing the bank's record <strong>of</strong> the checking account.A condition in which a firm does not have sufficient cash to pay its creditors.Legal process, governed by federal statute, whereby the debts <strong>of</strong> an insolventperson are liquidated after being satisfied to the greatest extent possible by thedebtor's assets during bankruptcy, the debtor's assets are held and managedby a court appointed trustee.Individuals responsible for overseeing the affairs <strong>of</strong> an entity, including theelection <strong>of</strong> its <strong>of</strong>ficers. People elected by a corporation's stockholders to overseethe business & appoint the <strong>of</strong>ficers.The journal is referred to as the book <strong>of</strong> original entry because it is the firstplace in which transactions are formally recorded.Amount, net or contra account balances, that an asset or liability shows onthe balance sheet <strong>of</strong> a company. also known as carrying value. The differencebetween the cost <strong>of</strong> an asset and its accumulated depreciation.The cost <strong>of</strong> an asset less the balance <strong>of</strong> any related contra asset accountThe value <strong>of</strong> an asset, a liability, or a stockholders' equity account. For a fixedasset, it is typically the cost <strong>of</strong> the asset minus accumulated depreciation. Ascompanies continue to use fixed assets to generate revenue, the book valueslessen, and sometimes ultimately reach zero.The recording <strong>of</strong> business data in a prescribed manner.115
<strong>Tracking</strong> <strong>Financial</strong> <strong>Performance</strong> <strong>Standards</strong> <strong>of</strong> Micr<strong>of</strong>inance InstitutionsTermBreak-Even PointBridge LoanBudgetBudgeted Balance SheetBudgeted Income StatementBusinessBusiness Entity ConceptBusiness PlanBusiness SegmentBusiness TransactionBylawsCash on DeliveryCall LoanCanceled ChecksCapitalCapital ExpenditureCapital Expenditures BudgetCapital LeaseDefinitionThe point in operations where total sales exactly equal total fixed and variablecosts; the point <strong>of</strong> zero pr<strong>of</strong>it or loss.Short-term loan to provide temporary financing until more permanentfinancing is available.<strong>Financial</strong> plan that serves as an estimate <strong>of</strong> future cost, revenues or both. Aformal statement <strong>of</strong> management's financial plans for the future.A balance sheet that estimates each element <strong>of</strong> financial condition at a specifiedfuture time.An income statement that estimates net income for the next fiscal period,based on all income statement budgets.An organization that operates with the objective <strong>of</strong> earning a pr<strong>of</strong>it.The principle that states that, for accounting purposes, a business is a distincteconomic entity or unit that is separate from its owner and from any otherbusiness.A document that describes an organization's current status and plans for severalyears into the future. It generally projects future opportunities for theorganization and maps the financial, operations, marketing and organizationalstrategies that will enable the organization to achieve its goals.Any division <strong>of</strong> an organization authorized to operate, within prescribed orotherwise established limitations, under substantial control by its ownmanagement.The occurrence <strong>of</strong> an event or <strong>of</strong> a condition that must be recorded in theaccounting records.Collection <strong>of</strong> formal, written rules governing the conduct <strong>of</strong> a corporation'saffairs (such as what <strong>of</strong>ficers it will have, what their responsibilities are, andhow they are to be chosen). Bylaws are approved by a corporation'sstockholders, if a stock corporation, or other owners, if a non-stock corporation.A set <strong>of</strong> policies that act as a corporation's constitution.Terms set by the seller that call for payment when the goods are deliveredLoan repayable on demand. Also known as demand loanChecks that have been paid by the bank out <strong>of</strong> the depositor's account.Broadly, all the money and other property <strong>of</strong> a corporation or other enterpriseused in transacting its business.A cost that adds to the utility <strong>of</strong> an asset for more than one accountingperiod.Examples include additions, betterments, and extraordinary repairs.Capital expenditures increase either the value or the life <strong>of</strong> the asset and aredebited to either the plant asset account or its accumulated depreciationaccount, depending on the type <strong>of</strong> expenditure.A budget used for long-term planning <strong>of</strong> when physical assets will need to bereplaced.A lease, which includes one or more <strong>of</strong> four provisions that result in treatingthe leased asset as a purchased asset in the accounts.116
Glossary <strong>of</strong> <strong>Financial</strong> TermsTermCapital MarketsCapital StatementCapital StockCapitalCapitalizationCapitalized CostCapitalized InterestCapitalized LeaseCashCash BasisCash BudgetCash EquivalentsCash Flow FinancingCash FlowsCash Payments JournalCash Receipts JournalDefinitionThose financial markets, including institutions and individuals, that exchangesecurities, especially long-term debt instruments.A summary <strong>of</strong> the changes in the capital <strong>of</strong> a business entity during a specificperiod <strong>of</strong> time.Ownership shares <strong>of</strong> a corporation authorized by its Articles <strong>of</strong> Incorporation.The money value assigned to a corporation's issued shares. The balance sheetaccount with the aggregate amount <strong>of</strong> the par value or stated value <strong>of</strong> all stockissued by a corporation. Shares <strong>of</strong> ownership in a corporation.The rights (equity) <strong>of</strong> the owners in a business enterprise.Long-term debt, preferred stock and net worth. The loan capital <strong>of</strong> acommunity development loan fund; includes that which has been borrowedfrom and is repayable to third parties as well as that which is earned or ownedby the loan fund (i.e. "permanent capital").Expenditure identified with goods or services acquired and measured by theamount <strong>of</strong> cash paid or the market value <strong>of</strong> other property, capital stock, orservices surrendered. Expenditures that are written <strong>of</strong>f during two or moreaccounting periods.Interest cost incurred during the time necessary to bring an Asset to thecondition and location for its intended use and included as part <strong>of</strong> the HistoricalCost <strong>of</strong> acquiring the asset.Lease recorded as an asset acquisition accompanied by a corresponding liabilityby the lessee.In its most basic meaning, cash is currency (paper money) and coin. Thedefinition in a business context also includes checks, money orders, traveler'schecks, cashier's checks, bank drafts, and receipts from credit card sales.Method <strong>of</strong> bookkeeping by which revenues and expenditures are recordedwhen they are received and paid. A basis <strong>of</strong> accounting where revenue isrecorded only when cash is received, and expenses are recorded only whencash is paid.A budget that estimates the expected cash to be received and spent over aperiod <strong>of</strong> time.Short-term (generally less than three months), highly liquid Investments thatare convertible to known amounts <strong>of</strong> cash. Highly liquid, short-terminvestments that can be turned to cash with little or no delayShort-term loan providing additional cash to cover cash shortfalls inanticipation <strong>of</strong> revenue, such as the payment(s) <strong>of</strong> receivables.Net <strong>of</strong> cash receipts and cash disbursements relating to a particular activityduring a specified accounting period. Cash receipts and cash payments fromoperating activities, investing activities, and financing activities.A special journal used for recording all disbursements <strong>of</strong> cash. Also called thecash disbursements journal.A special journal used to record all receipts <strong>of</strong> cash, regardless <strong>of</strong> the source.117
<strong>Tracking</strong> <strong>Financial</strong> <strong>Performance</strong> <strong>Standards</strong> <strong>of</strong> Micr<strong>of</strong>inance InstitutionsTermCashCertificate <strong>of</strong> Deposit (CD)ChargesChart <strong>of</strong> AccountsCheckCheck RegisterCheck StubCheckbookClassified Balance SheetClassified Income StatementClosing EntriesClosing ProcessCollateralCombined <strong>Financial</strong> StatementCombined JournalCommunity-Based FinanceInstitution:DefinitionAny medium <strong>of</strong> exchange that a bank will accept at face value. Currency andchecks on hand and deposits in banks. Listed in the current assets section onthe statement <strong>of</strong> financial position.Formal instrument issued by a bank upon the deposit <strong>of</strong> funds which may notbe withdrawn for a specified time period. Typically, an early withdrawal willincur a penalty.Charges or fees by the bank that are subtracted directly from the depositor'saccount and appear on the bank statement. Also called bank charges.A directory or listing <strong>of</strong> accounts in the ledger. A listing <strong>of</strong> all the accountsused by a business enterprise.A written order directing a bank to pay a specified sum <strong>of</strong> money to a designatedperson or business.A modified form <strong>of</strong> the cash payments journal used to record all transactionspaid by check.Part <strong>of</strong> a check that remains in the checkbook as a permanent record <strong>of</strong> thecheck.A bound book <strong>of</strong> checks with stubs; the depositor's record <strong>of</strong> the checkingaccount.A balance sheet that divides the assets and liabilities sections into the followingsubsections: current assets and long-term assets, and current liabilities andlong-term liabilities.An income statement divided into the following sections: revenue cost <strong>of</strong>goods sold (funds), operating expenses, and other income and expenses.Entries made at the end <strong>of</strong> an accounting period to transfer the balances <strong>of</strong> thetemporary accounts to the owner's capital account. An entry necessary toeliminate the balance <strong>of</strong> a temporary account in preparation for the followingaccounting period.The process <strong>of</strong> transferring the balances <strong>of</strong> temporary accounts to the owner'scapital account.Assets pledged to secure the repayment <strong>of</strong> a loan. Asset provided to a creditoras security for a loan.<strong>Financial</strong> Statement comprising the accounts <strong>of</strong> two or more entities.A multicolumn journal used by small businesses to help save journalizing andposting time. It has two special columns for recording debits and credits tocash, various other special columns for recording transactions that occur <strong>of</strong>ten,and two general columns for recording transactions that occur less <strong>of</strong>ten. Alsocalled a combination journal.The term "Community-based finance institution" (CBFI) has been formulatedto define organizations which enable low-income groups to participate fullyand democratically in the development process and which have their roots inthe community. Frequently, these organizations are referred to as co-operatives,but some community-based organizations are in fact not co-operatives butgroups with a similar structure and objectives [UN-ESCAP (1991)].118
Glossary <strong>of</strong> <strong>Financial</strong> TermsTermComparative <strong>Financial</strong>StatementCompliance AuditCompound Interest PrinciplesComposite-Rate DepreciationMethodComprehensive IncomeConservatismConsistencyConsistencyConsolidated <strong>Financial</strong>StatementsConsolidated StatementContingent LiabilityContinuing OperationsCo-Operative:Correcting EntryDefinition<strong>Financial</strong> Statement presentation in which the current amounts andthe corresponding amounts for previous periods or dates also are shown. Aside-by-side comparison <strong>of</strong> a company's financial statements for two or moreaccounting periods.Review <strong>of</strong> financial records to determine whether the entity is complying withspecific procedures or rules.Interest computed on principal plus interest earned in previous periods.A method <strong>of</strong> depreciation based on the use <strong>of</strong> a single rate that applies toentire groups <strong>of</strong> assets.Change in equity <strong>of</strong> a business enterprise during a period from transactionsand other events and circumstances from sources not shown in the incomestatement. The period includes all changes in equity except those resultingfrom investments by owners and distributions to owners.An investment strategy aimed at long-term capital appreciation with low risk;moderate; cautious; opposite <strong>of</strong> aggressive behavior; show possible losses butwait for actual pr<strong>of</strong>its. Concept which directs the least favorable effect on netincome.Accounting postulate which stipulates that, except as otherwise noted in the<strong>Financial</strong> Statement, the same accounting policies and procedures have beenfollowed from period to period by an organization in the preparation andpresentation <strong>of</strong> its financial statements.The accounting principle that requires a firm to continue to use a methodonce chosen, rather than switch from method to method arbitrarily or fortemporary advantage. The concept that assumes that the same generallyaccepted accounting principles have been applied in the preparation <strong>of</strong>successive financial statements.Combined <strong>Financial</strong> Statements <strong>of</strong> a parent company and one ormore <strong>of</strong> its subsidiaries as one economic unit.A financial statement resulting from combining parent and subsidiary companystatements.Potential liability arising from a past transaction or a subsequent event. Apossible liability, such as on a discounted note <strong>of</strong> a customer, that may becomea real liability if certain events occur. A potential obligation that will materializeonly if certain events occur in the future.Portion <strong>of</strong> a business entity expected to remain active.A co-operative, as defined by the International Labour Organization is anassociation <strong>of</strong> persons, usually <strong>of</strong> limited means, who have voluntarily joinedtogether to achieve a common economic end through the formation <strong>of</strong> ademocratically controlled business organization, making equitablecontributions to the capital required and accepting a fair share <strong>of</strong> the risks andbenefits <strong>of</strong> the undertaking [UN-ESCAP (1991)].An entry used to correct certain types <strong>of</strong> errors in the ledger.119
<strong>Tracking</strong> <strong>Financial</strong> <strong>Performance</strong> <strong>Standards</strong> <strong>of</strong> Micr<strong>of</strong>inance InstitutionsTermCostCost AccountingCreditCredit BalanceCredit PeriodCredit TermsCredit Union:CreditCreditorCurrent AssetCurrent Cost StatementsDefinitionThe financial measure <strong>of</strong> resources consumed in accomplishing a specificpurpose such as performing a service, carrying out an activity, or completinga unit <strong>of</strong> work or a specific project. An input into the manufacturing <strong>of</strong> aproduct. There are three common inputs in manufacturing: (1) raw materials,(2) direct labor, and (3) factory overhead.Procedures used for rationally classifying, recording, and allocating current orpredicted costs that relate to a certain product or production process. Thefield <strong>of</strong> accounting that is used to determine the dollar value <strong>of</strong> goods that aremanufactured. Accounts that are presented on the income statement; used todetermine the cost <strong>of</strong> goods sold to customers.Entry on the right side <strong>of</strong> a Double-entry bookkeeping system that representsthe reduction <strong>of</strong> an Asset or expense or the addition to a liability or revenue.(See Debit.) The allowance <strong>of</strong> cash, goods, or services in the present, withpayment expected in the future. To credit (Cr.) an account means to enter anamount on the right, or credit, side <strong>of</strong> the account.Balance remaining after one <strong>of</strong> a series <strong>of</strong> bookkeeping entries. This amountrepresents a liability or income to the entity. (See Balance.) Occurs when theamount on the credit side <strong>of</strong> an account is greater than the amount on thedebit side.The amount <strong>of</strong> time a seller allows a credit customer to pay for a purchase.The terms for payment set by a seller <strong>of</strong> goods or services; includes the amount<strong>of</strong> time before payment is due and the rate <strong>of</strong> discount (if any) for payingearly.In the financial sector, co-operatives which enable savings to be made andloans to be taken are generally known as "credit unions" which are registeredunder the legislation dealing with co-operatives in each country. The basiccredit union is composed <strong>of</strong> a group <strong>of</strong> people having a "common bond" whomay be resident in the same neighbourhood or employed at the same place <strong>of</strong>work, or it can be a religious or ethnic grouping. The principal reason for theemphasis on a common bond is that the social pressure <strong>of</strong> the group isconsidered a very important condition as security for loans It is a form <strong>of</strong>collateral which is not available in conventional finance [UN-ESCAP (1991)].(1) The right side <strong>of</strong> an account; (2) the amount entered on the right side <strong>of</strong>an account; (3) to enter an amount on the right side <strong>of</strong> an account.Party that loans money or other assets to another party. A business or personto whom a debt is owed.Asset that one can reasonably expect to convert into cash, sell, or consume inoperations within a single operating cycle, or within a year if more than onecycle is completed each year. Cash and assets that will be sold, used up, orturned into cash within the current accounting period, usually one year. Besidescash, examples are receivables, supplies, and merchandise inventory.The financial statements that result when historical costs reported inconventional statements are adjusted for specific price-level changes, so thatall elements <strong>of</strong> the statements are reported at their current costs.120
Glossary <strong>of</strong> <strong>Financial</strong> TermsTermCurrent LiabilitiesCurrent RatioCurrent ValueDebitDebit BalanceDebtDebt ServiceDebtorDecentralized BranchAccountingDeclining-BalanceDepreciation MethodDefaultDefinitionDebts that are due for payment within one year. Examples are accounts payable,salaries payable, sales tax payable, and the current portion <strong>of</strong> notes payable.Obligations a company has to others, such as creditors, suppliers, & taxauthorities, payable within one year. Listed in the liabilities category on thestatement <strong>of</strong> financial position. Obligation whose liquidation is expected torequire the use <strong>of</strong> existing resources classified as current assets, or the creation<strong>of</strong> other current liabilities. A liability that will be due within a short time(usually one year or less) and that is to be paid out <strong>of</strong> current assets.Current assets divided by current liabilities -- a measure <strong>of</strong> liquidity. Generally,the higher the ratio, the greater the "cushion" between current obligationsand a firm's ability to meet them. The ratio obtained by dividing currentassets by current liabilities. It is an indicator <strong>of</strong> a firm's ability to pay its shorttermdebts as they become due. The ratio <strong>of</strong> current assets to current liabilities.(1) Value <strong>of</strong> an asset at the present time as compared with the asset's HistoricalCost. (2) In finance, the amount determined by discounting the future revenuestream <strong>of</strong> an asset using compound interest principles.Entry on the left side <strong>of</strong> a double-entry bookkeeping system that representsthe addition <strong>of</strong> an Asset or expense or the reduction to a Liability or Revenue.(See Credit.) To debit (Dr.) an account means to enter an amount on the left,or debit, side <strong>of</strong> the account.Balance remaining after one or a series <strong>of</strong> bookkeeping entries. This amountrepresents an Asset or an expense <strong>of</strong> the entity. (See Balance.) Occurs whenthe amount(s) on the debit side <strong>of</strong> an account is greater than the amount(s) onthe credit side.An amount owed for funds borrowed. The debt may be owed to anorganization's own reserves, individuals, banks, or other institutions. Generally,the debt is secured by a note, bond, mortgage, or other instrument that statesrepayment and interest provisions. The note, in turn, may be secured by a lienagainst property or other assets. General name for money, notes, bonds, goodsor services which represent amounts owed.Amount <strong>of</strong> payment due regularly to meet a debt agreement; usually a monthly,quarterly or annual obligation.Party owing money or other Assets to a Creditor.A system <strong>of</strong> accounting for branches in which each branch keeps its ownrecords and prepares its own financial statements.A method <strong>of</strong> depreciation that provides declining periodic depreciation chargesto expense over the estimated life <strong>of</strong> a asset.A failure to discharge a duty. The term is most <strong>of</strong>ten used to describe theoccurrence <strong>of</strong> an event that cuts short the rights or remedies <strong>of</strong> one <strong>of</strong> theparties to an agreement or legal dispute, for example, the failure <strong>of</strong> themortgagor to pay a mortgage installment, or to comply with mortgagecovenants. Failure to meet any financial obligation. Default triggers a creditor'srights and remedies identified in the agreement and under the law.121
<strong>Tracking</strong> <strong>Financial</strong> <strong>Performance</strong> <strong>Standards</strong> <strong>of</strong> Micr<strong>of</strong>inance InstitutionsTermDeferralDeferred ChargeDeferred CreditsDeferred ExpensesDeferred IncomeDeferred RevenueDeficitDeflationDelinquentDemand LoanDepletionDeposit MethodDeposit SlipDepositorDepreciationDepreciation ExpenseDefinitionA postponement <strong>of</strong> the recognition <strong>of</strong> an expense already paid or a revenuealready received. Expenses and revenue that have been recorded in the currentaccounting period but are not incurred or earned until a future period.Cost incurred for subsequent periods which are reflected as assets. Anothername for deferred expenses, usually applying to advance payments that covermore than a year.Another name for deferred revenue, usually applying to amounts receivedmore than a year in advance.Advance payments for goods or services that benefit more than one accountingperiod.Income received but not earned until all events have occurred. Deferred incomeis reflected as a liability.The advance receipt <strong>of</strong> revenue that will not be earned until a future accountingperiod.<strong>Financial</strong> shortage that occurs when liabilities exceed assets. A debit balancein the Retained Earnings account.A period when prices in general are falling and the purchasing power <strong>of</strong> thecurrency (dollar or pound or rupee) is increasing.In a monetary context, something that has been made payable and is overdueand unpaid,Loan repayable on demand. Also known as a Call Loan.Method <strong>of</strong> computing a deduction to account for a reduction in value <strong>of</strong>extractable natural resources. The expense resulting from the using up <strong>of</strong> anatural resource. The cost <strong>of</strong> metal ores and other minerals removed from theearth.Related to the sales <strong>of</strong> real estate, under this method the seller does not recognizeany pr<strong>of</strong>its, does not record a note receivable, and continues to reflect theproperty and related debt in the seller's financial statements, recording thebuyer's initial investment and subsequent payments as a deposit.A form that is prepared when coin, currency, or checks are deposited in abank account. It indicates the depositor's name and account number andsummarizes the amount deposited. Also called deposit ticket.The business or person under whose name a checking account is opened.Expense allowance made for wear and tear on an asset over its estimated usefullife. (See Accelerated Depreciation and Straight-line Depreciation.) Anallocation process in which the cost <strong>of</strong> a long-term asset (except land) is dividedover the periods in which the asset is used in the production <strong>of</strong> the business'srevenue. The periodic cost expiration <strong>of</strong> all plant assets except land. Anallowance for wear or age made to the value <strong>of</strong> a fixed asset, allocating its costover its estimated useful life. Listed in the assets category on the statement <strong>of</strong>financial position.The expense that results from the allocation process <strong>of</strong> depreciation.122
Glossary <strong>of</strong> <strong>Financial</strong> TermsTermDirect ExpenseDirect MethodDirect Write-Off MethodDisbursementDisclaimer <strong>of</strong> OpinionDisclosureDiscountDividendDividend YieldDividendDividends In ArrearsDouble Declining-BalanceMethodDouble-Entry AccountingDouble-Entry BookkeepingDraweeDrawerDrawing AccountDefinitionAn expense that is associated with a specific department; an expense thatbenefits only that department and that would not exist if the department didnot exist.A format for the statement <strong>of</strong> cash flows that discloses each major class <strong>of</strong> cashinflow and cash outflow from operating activities. It shows the amount <strong>of</strong>cash received or paid for revenues and expenses reported on the incomestatement. This is the method recommended by the FASB.A method <strong>of</strong> accounting for bad debts in which the expense is recorded at thetime <strong>of</strong> the write-<strong>of</strong>f <strong>of</strong> a customer's account. A method <strong>of</strong> accounting foruncollectible receivables, whereby an expense is recognized only when specificaccounts are judged to be uncollectible.Payment by cash or check. Represents the amount <strong>of</strong> checks issued andelectronic fund transfers, cash or other payments made.Statement by an auditor indicating inability to express an opinion on thefairness <strong>of</strong> the financial statements provided and the reason for the inability.Process <strong>of</strong> divulging accounting information so that the content <strong>of</strong> financialstatements is understood.Reduction from the full amount <strong>of</strong> a price or debt.A distribution <strong>of</strong> corporate earnings to the stockholders <strong>of</strong> the company.A measure <strong>of</strong> pr<strong>of</strong>itability that tells the investor the rate earned on investment.Calculated by dividing the dividend per share <strong>of</strong> stock by the market price pershare.A distribution <strong>of</strong> earnings <strong>of</strong> a corporation to its owners (stockholders).Distribution <strong>of</strong> earnings to owners <strong>of</strong> a corporation in cash, other Assets <strong>of</strong>the corporation, or the corporation's capital stock. Cash or stock paymentsfrom a company's pr<strong>of</strong>its distributed to stockholders, an equal amount foreach share <strong>of</strong> stock owned. Listed as dividends on the statement <strong>of</strong> stockholders'equity.Passed dividends on cumulative preferred stock.A depreciation method that allows greater depreciation in the early years <strong>of</strong>the life <strong>of</strong> a plant asset and less depreciation in later years. This is achieved byapplying a constant rate to each year's decreasing book value.Each business transaction affects the accounting elements in at least two ways.Recording both effects <strong>of</strong> a transaction is called double-entry accounting. Asystem fro recording transactions based on recording increases and decreasesin accounts so that debits always equal credits.Method <strong>of</strong> recording financial transactions in which each transaction is enteredin two or more accounts and involves two-way, self-balancing posting. Totaldebits must equal total credits.The bank on which a check is drawn.The business or person who writes a check.A temporary owner's equity account that is used when an owner withdrawscash or other assets from the business for personal use.123
<strong>Tracking</strong> <strong>Financial</strong> <strong>Performance</strong> <strong>Standards</strong> <strong>of</strong> Micr<strong>of</strong>inance InstitutionsTermDual EffectDue DateEarned CapitalEarned IncomeEarnings per Share (Eps)Earnings ReportEncumbranceEndorsementEquipmentEquityEscrowExempt OrganizationExpenditureDefinitionThe principle that states that all business transactions are recorded as havingat least two effects on the basic accounting elements.The date on which a note must be paid. Also called the maturity date.Capital that arises from pr<strong>of</strong>itable operations <strong>of</strong> the corporation; usually calledretained earnings.Wages, salaries, pr<strong>of</strong>essional fees, and other amounts received as compensationfor services rendered.Measure <strong>of</strong> performance calculated by dividing the net earnings <strong>of</strong> a companyby the average number <strong>of</strong> shares outstanding during a period. The portion <strong>of</strong>a company's pr<strong>of</strong>it assigned to each share <strong>of</strong> stock. For example, if the pr<strong>of</strong>itis currency (Dollar, Rupees, Pounds) 1 million and 500,000 shares areoutstanding, the earnings per share would be currency (Dollar, Rupees, Pounds)1 million ÷ 500,000 shares = currency (Dollar, Rupees, Pounds) 2. Listed inthe per share <strong>of</strong> common stock amounts category on the statement <strong>of</strong> earnings.A financial statement that reports the results <strong>of</strong> a company's business operations(revenue and expenses) for a set period, usually one year. Also called an incomestatement, statement <strong>of</strong> earnings, statement <strong>of</strong> operations, and statement <strong>of</strong>pr<strong>of</strong>it and loss.(1) Mortgage or other lien on the entity's assets; (2) Anticipated expenditure;(3) Uncompleted or undelivered portion <strong>of</strong> a purchase commitment. Expectedliabilities.A signature or stamp on the back <strong>of</strong> a check that transfers ownership <strong>of</strong> thecheck to the bank or another person.The physical assets needed by a business in order to operate.The value <strong>of</strong> property in an organization greater than total debt held on it.Equity investments typically take the form <strong>of</strong> an owner's share in the business,and <strong>of</strong>ten, a share in the return, or pr<strong>of</strong>its. Equity investments carry greaterrisk than debt, but the potential for greater return should balance the risk.Residual interest in the assets <strong>of</strong> an entity that remains after deducting itsliabilities. Also, the amount <strong>of</strong> a business' total assets less total liabilities. Also,the third section <strong>of</strong> a balance sheet, the other two being assets and liabilities.The right or claim to the properties <strong>of</strong> a business enterprise. The part <strong>of</strong> acompany's assets that belongs to the stockholders. In other words, the amountthat would remain if a company sold all <strong>of</strong> its assets and paid <strong>of</strong>f all <strong>of</strong> itsliabilities. Listed as stockholders' equity on the statement <strong>of</strong> financial positionand on the statement <strong>of</strong> stockholders' equity.Money or property put into the custody <strong>of</strong> a third party for delivery to agrantee, only after fulfillment <strong>of</strong> specified conditions.Organization which is generally exempt from paying income tax. Exemptorganizations include religious organizations, charitable organizations, socialclubs, and others.Payment, either in cash, by assuming a liability, or by surrendering asset.124
Glossary <strong>of</strong> <strong>Financial</strong> TermsTermExpenseExternal Reporting<strong>Financial</strong> Forecast<strong>Financial</strong> Institution<strong>Financial</strong> StatementsFinancing ActivitiesFiscal PeriodFiscal YearFixed AssetsFixed CostsFlexible BudgetFootingForecastForeclosureDefinitionThe amount <strong>of</strong> assets consumed or services used in the process <strong>of</strong> earningrevenue. The costs <strong>of</strong> operating a business. Unlike the cost <strong>of</strong> an asset, the cost<strong>of</strong> an expense does not provide a future benefit to the business. Therefore, itseffect is a reduction in owner's equity. Costs such as salaries, rent, <strong>of</strong>fice supplies,advertising, and taxes. Listed in the operating expenses category on thestatement <strong>of</strong> earnings.Reporting to stockholders and the public, as opposed to internal reportingfor management's benefit.A statement indicating an enterprise's financial plans and expectations for thefuture.Organization engaged in any <strong>of</strong> the many aspects <strong>of</strong> finance includingcommercial banks, development banks, thrift institutions, investment banks,securities brokers and dealers, credit unions, investment companies, insurancecompanies, and real estate investment trusts.Presentation <strong>of</strong> financial data including balance sheets, income statementsand statements <strong>of</strong> cash flow, or any supporting statement that is intended tocommunicate an entity's financial position at a point in time and its results <strong>of</strong>operations for a period then ended. Summaries <strong>of</strong> financial activities.Transactions that involve cash receipts or payments from changes in longtermliabilities and stockholders' equity--such as selling stock to stockholdersand paying dividends, and borrowing from creditors and repaying these loans.The period <strong>of</strong> time that covers a complete accounting cycle. A fiscal year is afiscal period covering twelve months; it does not necessarily coincide with thecalendar year.Period <strong>of</strong> 12 consecutive months chosen by an entity as its accounting periodwhich may or may not be a calendar year. A 12-month time period that mayor may not be from January 1 to December 31 or April 1 to March 31. Theannual accounting period adopted by an enterprise.Any tangible asset with a life <strong>of</strong> more than one year used in an entity'soperations. Anything companies use for more than one year to manufacture,display, store, and transport products. Often called "property, plant, andequipment" because that's what fixed assets usually are. Listed after currentassets in the assets category on the statement <strong>of</strong> financial position.Costs that do not change as production changes; costs that occur even withoutany productionA budget that is actually a series <strong>of</strong> budgets for different levels <strong>of</strong> productionactivityThe total <strong>of</strong> the debit column or credit column <strong>of</strong> an account.Prospective financial statements that are an entity's expected financial position,results <strong>of</strong> operations, and cash flowsSeizure <strong>of</strong> collateral by a creditor when default under a loan agreement occurs.125
<strong>Tracking</strong> <strong>Financial</strong> <strong>Performance</strong> <strong>Standards</strong> <strong>of</strong> Micr<strong>of</strong>inance InstitutionsTermFranchiseFraudFunds StatementFungibilityGeneral ExpenseGeneral LedgerGoing ConcernGoing Concern ConceptGoodwillDefinitionLegal arrangement whereby the owner <strong>of</strong> a trade name, franchisor, contractswith a party that wants to use the name on a non-exclusive basis to sell goodsor services, franchisee. Frequently, the franchise agreement grants strictsupervisory powers to the franchisor over the franchisee which, nevertheless,is an independent business.Willful misrepresentation by one person <strong>of</strong> a fact inflicting damage on anotherperson.The statement <strong>of</strong> changes in financial position.The quality <strong>of</strong> money that makes one individual specimen indistinguishablefrom another. Anything used as money (gold, shells, bank notes) must havethis quality. The fungibility <strong>of</strong> money makes it difficult for lenders to ensurethat borrowers use the loan funds in the way lenders wish; one way they try toget round "misuse <strong>of</strong> funds" is to lend in kind. Often a person will borrowmoney for one stated purpose, but the effect <strong>of</strong> the loan is to finance anotheractivity. <strong>Sa</strong>y, for example, that I intend to improve my house using savings butsomeone <strong>of</strong>fers me a home improvement loan on attractive terms. The effect<strong>of</strong> the loan is not to increase quality <strong>of</strong> the housing stock, as the lender intended,but to enable me to undertake some other activity I could not otherwise havefinanced buying a motorcycle, taking a holiday, or perhaps partying everynight. Micro finance lenders such as donors and NGOs tend to dislike thisbecause (a) they don't think poor people should use their limited incomes onsuch things, and (b) it reduces the funds available for lending to other potentialclients or beneficiaries.Expense incurred in the general operation <strong>of</strong> a business. Expenses related to(1) running a firm's <strong>of</strong>fice or (2) any other operating activities that do notinvolve the sale <strong>of</strong> merchandise. Also called administrative expenses.Collection <strong>of</strong> all asset, liability, owners’ equity, revenue, and expense accounts.A ledger containing the financial statement accounts. The principal ledger,when used in conjunction with subsidiary ledgers that contains all <strong>of</strong> thebalance sheet and income statement accounts.Assumption that a business can remain in operation long enough for all <strong>of</strong> itscurrent plans to be carried out.The concept that assumes that a business entity has a reasonable expectation<strong>of</strong> continuing in business at a pr<strong>of</strong>it for an indefinite period <strong>of</strong> time.Premium paid in the acquisition <strong>of</strong> an entity over the fair value <strong>of</strong> its identifiabletangible and intangible assets less liabilities assumed. An intangible asset madeup <strong>of</strong> such factors as an excellent reputation, a fine location, a superior productline, or outstanding management skills. Used to give a partner a greater capitalcredit than the amount <strong>of</strong> assets invested. An intangible asset that adds valueto the worth <strong>of</strong> a company; for example, the reputation <strong>of</strong> its products, services,or personnel. Listed in the assets category (sometimes as "Investments andsundry assets") on the statement <strong>of</strong> financial position.126
Glossary <strong>of</strong> <strong>Financial</strong> TermsTermGoverning DocumentsGranteeGrantorGuaranteed LoanGuarantyHistorical CostHorizontal AnalysisImprovementIncomeIncome from OperationsIncome StatementIndependent Auditors' ReportIndirect ExpenseIndirect LaborInflationInformal Finance SystemOfficial legal documents that dictate how an entity is operated. The governingdocuments <strong>of</strong> a corporation include articles <strong>of</strong> incorporation and Bylaws; apartnership includes the partnership agreement; a trust includes the trustagreement or trust indenture; and an LLC includes the Articles <strong>of</strong> organizationand operating agreement.Person to whom property is transferred.(1) Person who transfers property. (2) Person who creates a trust.A pledge to cover the payment <strong>of</strong> debt or to perform some obligation if theperson liable fails to perform. When a third party guarantees a loan, it promisesto pay in the event <strong>of</strong> a default by the borrower.Legal arrangement involving a promise by one person to perform theobligations <strong>of</strong> a second person to a third person, in the event the secondperson fails to perform.Original cost <strong>of</strong> an asset to an entity.DefinitionThe comparison <strong>of</strong> each item in a company's financial statements in the currentperiod with the same item from a previous accounting period or periods. Thepercentage analysis <strong>of</strong> increases and decreases in corresponding items incomparative financial statements.Expenditure directed to a particular asset to improve its performance or usefullife.Inflow <strong>of</strong> revenue during a period <strong>of</strong> time. (See Net Income.)Gross pr<strong>of</strong>it minus operating expenses. Also called operating income. Theexcess <strong>of</strong> gross pr<strong>of</strong>it over total operating expenses.Summary <strong>of</strong> the effect <strong>of</strong> revenues and expenses over a period <strong>of</strong> time. Asummary <strong>of</strong> a business's revenue and expenses for a specific period <strong>of</strong> time,such as a month or a year. Other terms used to describe the income statementare earnings statement, operating statement, statement <strong>of</strong> operations, and pr<strong>of</strong>itand loss statement.A report accompanying financial statements, which chartered accountants(CPAs) express an opinion as to the fairness <strong>of</strong> the statements.An expense <strong>of</strong> operating a business that is not associated with a specificdepartment; an expense that benefits an entire business and would continueto exist even if a specific department were eliminated.The cost <strong>of</strong> those employees who work in the company, but not on the productitself. Example - Accountants not working in the credit programA period when prices in general are rising and the purchasing power <strong>of</strong> thecurrency (dollar or rupee or pound sterling) is declining."Informal" refers to types <strong>of</strong> institutions. Most community-based financialinstitutions are formal organizations, although they are not normally targetedfor a particular purpose. While every group exhibits some degree <strong>of</strong> formality,the term "informal" is used principally to describe traditional systems <strong>of</strong> savingsand loans.127
<strong>Tracking</strong> <strong>Financial</strong> <strong>Performance</strong> <strong>Standards</strong> <strong>of</strong> Micr<strong>of</strong>inance InstitutionsInsolventIntangible AssetInterestInterim <strong>Financial</strong> StatementsInterim FinancingInterim StatementInternal AuditInternal ControlInternal TransactionsWhen an entity's Liabilities exceed its Assets.Asset having no physical existence such as trademarks and patents. A longlivedasset that is useful in the operations <strong>of</strong> an enterprise, is not held for sale,and is without physical qualities. Long-term assets used in a business that lackphysical substance. Examples include patents, copyrights, trademarks, andfranchises. Anything nonphysical, such as goodwill, trademarks, and patents,that have value for a company. Listed in the assets category (sometimes as"Investments and sundry assets") on the statement <strong>of</strong> financial position. Wouldpositive peer pressure in micro-finance be such an intangible assetPayment for the use or forbearance <strong>of</strong> money. The charge for credit; calculatedas (principal) X (rate) X (time)<strong>Financial</strong> Statements that report the operations <strong>of</strong> an entity for less than oneyearShort-term loan to provide temporary financing until more permanentfinancing is availableA financial statement issued for a period covering less than a fiscalyearStatements that are prepared during the fiscal year for periods <strong>of</strong> less than12 months--such as monthly, quarterly, and semiannuallyAudit performed within an entity by its staff rather than an independentcertified public accountant.Process designed to provide reasonable assurance regarding achievement <strong>of</strong>various management objectives such as the reliability <strong>of</strong> financial reports. Theprocedures used within a company to protect its assets.Transactions, such as adjustments, that occur within a company and do notaffect parties outside the companyInvestment Expenditure used to purchase goods or services that could produce a returnto the investor. A company's equity ownership in unconsolidated subsidiariesand affiliates. Listed in the category <strong>of</strong> assets (for example, "Investments andsundry assets") on the statement <strong>of</strong> financial position.InvoiceJournalJournalizingLeaseLeaseholdTermDefinitionA business document that contains the names and addresses <strong>of</strong> the buyer andthe seller, the date and terms <strong>of</strong> the sale, a description <strong>of</strong> the goods, the price<strong>of</strong> the goods, and the mode <strong>of</strong> transportation used to ship the goods. Theseller calls the invoice a sales invoice; the buyer calls it a purchase invoice. Thebill provided by the seller (referred to as a sales invoice) to a purchaser (referredto as a purchase invoice) for items purchased.Any book containing original entries <strong>of</strong> daily financial transactions. A formin which transactions are recorded in chronological order (by order <strong>of</strong> date).The process <strong>of</strong> recording transactions in a journal.Conveyance <strong>of</strong> land, buildings, equipment or other assets from one person(Lessor) to another (Lessee) for a specific period <strong>of</strong> time for monetary or otherconsideration, usually in the form <strong>of</strong> rent. A contractual agreement conveyingthe right to use an asset for a stated period <strong>of</strong> time.Property interest a lessee owns in the leased property.128
Glossary <strong>of</strong> <strong>Financial</strong> TermsTermLedgerLegal CapitalLesseeLessorLetter <strong>of</strong> CreditLeverageLiabilitiesLiabilities, Total LiabilitiesLimited LiabilityLine <strong>of</strong> CreditLiquid AssetLiquid Assets - CashLiquidationLiquidityLoan AgreementLong-Term DebtDefinitionAny book <strong>of</strong> accounts containing the summaries <strong>of</strong> debit and credit entries.Acollective grouping <strong>of</strong> accounts. The group <strong>of</strong> accounts used by an enterprise.The amount <strong>of</strong> earnings that a corporation must retain before a dividend canbe paid to stockholders; usually equals the par value <strong>of</strong> the stock outstanding.Person or entity that has the right to use property under the terms <strong>of</strong> a lease.Owner <strong>of</strong> property, the temporary use <strong>of</strong> which is transferred to another (Lessee)under the terms <strong>of</strong> a lease.Conditional bank commitment issued on behalf <strong>of</strong> a customer to pay a thirdparty in accordance with certain terms and conditions. The two primary typesare commercial letters <strong>of</strong> credit and standby letters <strong>of</strong> credit.Using long-term debt to secure funds for an organization. In the socialinvestment world, <strong>of</strong>ten refers to financial participation by other private, publicor individual sources The use <strong>of</strong> borrowed funds to earn a greater return thanthe cost <strong>of</strong> the borrowed funds.The tendency <strong>of</strong> the rate earned on stockholders'equity to vary from the rate earned on total asserts because the amount earnedon assets acquired through the use <strong>of</strong> funds provided by creditors varies fromthe interest paid to these creditors. A company's use <strong>of</strong> debt, instead <strong>of</strong> itsequity, to support its assets and grow.Debts owed by the business.A company's debts to a lender, a supplier <strong>of</strong> goodsand services, a tax authority, a landlord, and others. Listed as a category on thestatement <strong>of</strong> financial position. Debts or obligations owed by one entity(debtor) to another entity (creditor) payable in money, goods, or services. Adebt <strong>of</strong> a business enterprise.Total value <strong>of</strong> financial claims on a firm's assets. Equals total assets minus networth.Limitation <strong>of</strong> shareholders' losses to the amount invested means thatstockholders <strong>of</strong> a corporation are not personally liable for the debts <strong>of</strong> thecompanyAgreement by a bank that a company may borrow at any time up to anestablished limit.An asset that can be quickly converted into cash. Examples include cash andmarketable securities.cash equivalents, and marketable securities.Winding up an activity by distributing its assets to the appropriate partiesand settling its debts. The process <strong>of</strong> winding up a business.Refers to how quickly an asset can be turned into cash, used up, or expire;used in reference to assets, which are listed on the balance sheet in the order <strong>of</strong>their liquidity.A written contract between a lender and a borrower that sets out the rightsand obligations <strong>of</strong> each party regarding a specified loan.Debt with a maturity <strong>of</strong> more than one year from the current date. Debt acompany will repay after one year. Listed in the liabilities category on thestatement <strong>of</strong> financial position.129
<strong>Tracking</strong> <strong>Financial</strong> <strong>Performance</strong> <strong>Standards</strong> <strong>of</strong> Micr<strong>of</strong>inance InstitutionsTermLong-Term InvestmentLong-Term LiabilitiesLossManagement AccountingMarginMarket RateMarketable SecuritiesMatching PrincipleMatchingMaturity DateMaturity ValueMonetary ItemsNatural Business YearNatural Business YearNegotiableDefinitionAn investment that is not intended to be a ready source <strong>of</strong> cash in the normaloperations <strong>of</strong> a business and that is listed in the "investments" section <strong>of</strong> thebalance sheet. Investments that management intends to hold for more thanone year.Debts that will not come due for payment within one year. Examples arelong-term notes payable and mortgages payable. A liability that is not due fora comparatively long time (usually more than one year).Excess <strong>of</strong> expenditures over revenue for a period or activity.Reporting designed to assist management in decision-making, planning, andcontrol. Also known as managerial accounting.Excess <strong>of</strong> selling price over the unit cost.The rate <strong>of</strong> interest a company must pay to borrow funds currently.Stocks and other negotiable instruments which can be easily bought and soldon either listed exchanges or over-the-counter markets. <strong>Financial</strong> assets, suchas stocks and bonds, that companies can convert to cash. Listed as assets onthe statement <strong>of</strong> financial position. An investment in a security that can bereadily sold when cash is needed.A fundamental concept <strong>of</strong> basic accounting. In any one given accountingperiod, you should try to match the revenue you are reporting with the expensesit took to generate that revenue in the same time period, or over the periods inwhich you will be receiving benefits from that expenditure. A simple exampleis depreciation expense. If you buy a car that will last for many years, youdon't write <strong>of</strong>f the cost <strong>of</strong> that car all at once. Instead, you take depreciationdeductions over the car's estimated useful life. Thus, you've "matched" theexpense, or cost, <strong>of</strong> the building with the benefits it produces, over the course<strong>of</strong> the years it will be in service. A fundamental rule <strong>of</strong> basic accounting. Inany one given accounting period, you should try to match the revenue you arereporting with the expenses it took. Requires that revenue earned during anaccounting period be <strong>of</strong>fset by the expenses that were necessary to producethat revenue, so that the accurate net income or net loss for the period can bereportedThe principle <strong>of</strong> accounting that all revenues should be matched with theexpenses incurred in earning those revenues during a period <strong>of</strong> time.The date on which the principal (amount) must be repaidThe principal plus the interest on an instrument; the amount that must bepaid to the payee on the maturity date <strong>of</strong> the instrument. The amount due atthe maturity or due date <strong>of</strong> an instrument.Definite fixed amounts stated in terms <strong>of</strong> currency units, either by law or bycontract agreement. Money or a claim to receive money or an obligation topay a fixed amount <strong>of</strong> money.A fiscal year ending at a business's lowest point <strong>of</strong> activity.A year that ends when a business's activities have reached the lowest point inits annual operating cycle.Able to be transferred by endorsement to another party.130
Glossary <strong>of</strong> <strong>Financial</strong> TermsTermNet AssetsNet EarningsNet IncomeNet LossNet Pr<strong>of</strong>itNet Realizable ValueNet ReceivablesNet Working CapitalNet WorthNon Current AssetsNote PayableNote ReceivableNotesOperating ActivitiesOperating ExpensesOperating Expenses BudgetDefinitionExcess <strong>of</strong> the value <strong>of</strong> securities owned, cash, receivables, and other assets overthe liabilities <strong>of</strong> the company.A company's total revenue less total expenses, showing what a company earned(or if lost, called net loss) for a set period, usually one year. Listed <strong>of</strong>ten literallyas the "bottom line" on the statement <strong>of</strong> earnings. Also called net income andnet pr<strong>of</strong>it.Excess or deficit <strong>of</strong> total revenues and gains compared with total expenses andlosses for an accounting period. Occurs when revenue earned during anaccounting period exceeds the expenses <strong>of</strong> the same period. The final figure inthe income statement when revenues exceed expenses. A company's totalrevenue less total expenses, showing what a company earned (or lost, callednet loss) for a set period, usually one year. Listed <strong>of</strong>ten literally as the "bottomline" on the statement <strong>of</strong> earnings. Also called net earnings and net pr<strong>of</strong>it.The final figure in the income statement when expenses exceed revenues.A company's total revenue less total expenses, showing what a company earned(or lost, called net loss) for a set period, usually one year. Listed <strong>of</strong>ten literallyas the "bottom line" on the statement <strong>of</strong> earnings. Also called net earningsand net income.The difference between the balance in the Accounts Receivable account andthe Allowance for Doubtful Accounts account; the actual amount <strong>of</strong> receivablesthat the firm expects to collect.Another name for net realizable value.Current assets minus current liabilities.Similar to equity, the excess <strong>of</strong> assets over liabilities. The owner's equity in abusiness.The amount <strong>of</strong> a company's stockholders' equity. Listed as totalstockholders' equity on the statement <strong>of</strong> financial position.Anything <strong>of</strong> long-term value to a company, including fixed assets and intangibleassets. Listed in the assets category (after current assets) on the statement <strong>of</strong>financial position.A formal written promise to pay a specified amount at a definite future date.A written promise to pay, representing an amount owed by a business.A written promise to pay, representing an amount to be received by a business.An annual report section that provides information essential to fullyunderstanding the financial statements. Notes explain the financial statements'numbers and any significant events affecting them. Notes also provideadditional detail and provide supplementary financial information. Also calledfootnotes.Transactions that enter into the calculation <strong>of</strong> net income; operating activitiesaffect the income statement.Expenses incurred in the normal operation <strong>of</strong> the business.A budget that estimates operating expenses for the next fiscal period.131
<strong>Tracking</strong> <strong>Financial</strong> <strong>Performance</strong> <strong>Standards</strong> <strong>of</strong> Micr<strong>of</strong>inance InstitutionsTermOperating ExpensesOpportunity CostPayroll RegisterPensionPetty Cash FundPetty Cash Payments RecordPetty Cash VoucherPetty CashierPledged AssetPortfolioPostingPosting ErrorsPrepaid ExpensePrincipalPrinciple <strong>of</strong> MaterialityPrinciple <strong>of</strong> Objective EvidencePrior Period AdjustmentDefinitionCosts related to a company's operations. Examples are salaries, advertising,sales commissions, travel, and entertainment. Listed as a category on thestatement <strong>of</strong> earnings.The potential benefit that is foregone from not following the best (financiallyoptimal) alternative course <strong>of</strong> action.Summary <strong>of</strong> the gross earnings, deductions, and net pay for all employees fora specific payroll period.Retirement plan <strong>of</strong>fered by an employer for the benefit <strong>of</strong> an employee, usuallyat retirement, through a trustee who controls the assets. (See employee benefitplan.)A small amount <strong>of</strong> cash kept in the <strong>of</strong>fice for making small payments foritems such as postage and <strong>of</strong>fice supplies. A special cash fund used to payrelatively small amounts.An auxiliary record, one that is used to record payments from the petty cashfund. At the end <strong>of</strong> the month, the record is summarized and used as a basisfor a journal entry.A voucher used when payment is made from the petty cash fund. It shows theamount <strong>of</strong> the payment, the purpose, and the account to be debited.The person designated to disburse money from the petty cash fund.Asset placed in a trust and used as collateral for a debt.A combination <strong>of</strong> assets held for its investment benefits, including financialand non-financial returns. The asset mix is usually varied in kind and size tomaintain an acceptable level <strong>of</strong> risk and return.The process <strong>of</strong> transferring amounts from the journal to the ledger. The process<strong>of</strong> transferring debits and credits from a journal to the accounts.Errors that result from incorrect transfers from the journal to an account orfrom the ledger to the trial balance.Cost incurred to acquire economically useful goods or services that are expectedto be consumed in the revenue-earning process within the operating cycle. Apurchased commodity or service that has not been consumed at the end <strong>of</strong> anaccounting period. Another name for deferred expenses, usually applying toadvance payments that cover a year or less.In commercial law, the principal is the amount that is received, in the case <strong>of</strong>a loan, or the amount from which flows the interest. Face amount <strong>of</strong> a security,exclusive <strong>of</strong> any premium or interest. The basis for interest computations.The amount <strong>of</strong> money borrowed or the amount <strong>of</strong> credit extended. Also calledthe face value.States that proper accounting procedures have to be strictly followed only forevents and transactions that would have an effect on a business's financialstatements.States that source documents should form the foundation for recording businesstransactions.Correction <strong>of</strong> a material error related to a prior period or periods, excludedfrom the determination <strong>of</strong> net income.132
Glossary <strong>of</strong> <strong>Financial</strong> TermsTermPr<strong>of</strong>it CenterPr<strong>of</strong>itabilityProjectionPromissory NoteProxyQuick AssetsR&DRateRatioRatio AnalysisReal AccountRealization PrincipleReceivablesReconciliationRefinancing AgreementReinsuranceReport <strong>of</strong> IndependentAccountantsAny segment <strong>of</strong> a business that incurs expenses while producing revenue.The ability <strong>of</strong> a business to earn a reasonable return on the owners' investments.The ability <strong>of</strong> a firm to earn income.Prospective financial statements that include one or more hypotheticalassumptions.Promise to pay. Written contract between a borrower and a lender that issigned by the borrower and provides evidence <strong>of</strong> the borrower's indebtednessto the lender. Evidence <strong>of</strong> a debt with specific amount due and interest rate.The note may specify a maturity date or it may be payable on demand. Thepromissory note may or may not accompany other instruments such as amortgage providing security for the payment there<strong>of</strong>. (See demand loan.) Awritten promise to pay a sum <strong>of</strong> money at a definite time in the future. Alsocalled a note.Document authorizing someone other than the shareholder to exercise theright to vote the stock owned by the shareholder.Current assets that can be converted to cash right away, such as receivablesand marketable securities. The sum <strong>of</strong> cash, receivables, and marketablesecurities.See Research and Development.The annual percent charged on the principal.A fractional relationship <strong>of</strong> one number to another.A measure <strong>of</strong> the relativesize <strong>of</strong> two numbers. Usually, financial ratios are expressed as a times multiple(x) or a percentage (%). Ratios provide a quick way to compare a company toits performance over time, to other companies in the same industry, and tothe industry average.Comparison <strong>of</strong> actual or projected data for a particular company to otherdata for that company or industry in order to analyze trends or relationships.A balance sheet account.DefinitionThe principle that states that revenue should be recorded when it is earned,even though cash may not be collected until later.Accounts receivable; an amount that is owed the business, usually by one <strong>of</strong>its customers as a result <strong>of</strong> the ordinary extension <strong>of</strong> credit, Amounts <strong>of</strong> moneydue from customers or other debtors.Comparison <strong>of</strong> two numbers to demonstrate the basis for the differencebetween them.Arrangement to provide funding to replace existing financing, the mostcommon being a refinance <strong>of</strong> a home mortgage.Process by which an insurance company obtains insurance on its insuranceclaims with other insurers in order to spread the risk.A summary <strong>of</strong> the findings <strong>of</strong> a firm <strong>of</strong> independent certified public accountantsthat audits, or examines, a company's financial statements. This report isincluded in the company's annual report. Also called auditors' report andauditors' opinion.133
<strong>Tracking</strong> <strong>Financial</strong> <strong>Performance</strong> <strong>Standards</strong> <strong>of</strong> Micr<strong>of</strong>inance InstitutionsTermReserveRestructuringRevenueRevenue ExpendituresRevenue RecognitionReversing Entry<strong>Sa</strong>laried Employees<strong>Sa</strong>lary<strong>Sa</strong>lvage ValueSchedule <strong>of</strong> Accounts PayableSchedule <strong>of</strong> AccountsReceivableSecuritiesSecuritySelf-Sufficiency:Short-TermDefinitionAccount used to earmark a portion <strong>of</strong> equity or fund balance to indicate thatit is not available for expenditure.Reorganization within an entity. Restructuring may occur in the form <strong>of</strong>changing the components <strong>of</strong> capital, renegotiating the terms <strong>of</strong> debtagreements, etc.Income earned from carrying out the activities <strong>of</strong> a firm.The amount chargedto customers for goods sold or services rendered.The total flow <strong>of</strong> funds intoa company, mostly for sales <strong>of</strong> its goods or services. Listed as the first categoryon the statement <strong>of</strong> earnings. <strong>Sa</strong>les <strong>of</strong> products, merchandise, and services;and earnings from interest, dividend and rent.An expenditure that benefits only the current period.Expenditures for a plantasset that benefit only the current accounting period. Examples include repairsand maintenance expenses. Revenue expenditures are debited to expenseaccounts.Method <strong>of</strong> determining whether or not income has met the conditions <strong>of</strong>being earned and realised or is realisable.An entry made at the start <strong>of</strong> a new accounting period to reverse an adjustingentry made at the end <strong>of</strong> the previous period. A reversing entry is the exactopposite <strong>of</strong> the adjusting entry. An entry that reverses a specific adjustingentry to facilitate the recording <strong>of</strong> routine transactions in the subsequent period.Individuals who work for a fixed amount for a definite period <strong>of</strong> time, such asa week, a month, or a year.A fixed amount paid to employees for a certain period <strong>of</strong> time, such as a weekor a month.Selling price assigned to retired fixed assets or merchandise unsalable throughusual channels. The amount that an asset is expected to be worth at the end <strong>of</strong>its productive life. Also called scrap value, trade-in value, and residual value.A listing <strong>of</strong> the individual creditor balances in the accounts payable ledger.A listing <strong>of</strong> the balances in the accounts receivable ledger.Investments, including stocks and bonds. Listed as assets on the statement <strong>of</strong>financial position.A pledge made to secure the performance <strong>of</strong> a contract or the fulfillment <strong>of</strong> anobligation. Examples <strong>of</strong> securities include real estate, equipment stocks or aco-signer. Mortgages are a form <strong>of</strong> security with strong legal standing, becausethey are publicly registered following a formal legal procedure. A mortgagegives the lender holding a mortgage security the right to reclaim the assetbeing financed, if repayment is not made. Any kind <strong>of</strong> transferable certificate<strong>of</strong> ownership including equity securities and debt securities.Self-sufficiency occurs when a micro-credit programme can cover all <strong>of</strong> itsoperating expenses (including loan losses and the cost <strong>of</strong> capital) entirely withinternally-generated sources <strong>of</strong> income.Current; ordinarily due within one year.134
Glossary <strong>of</strong> <strong>Financial</strong> TermsSolvencySpecial JournalSpecial ReportSpreadTermStatement <strong>of</strong> Cash FlowsStatement <strong>of</strong> Changesin <strong>Financial</strong> PositionStatement <strong>of</strong> EarningsStatement <strong>of</strong> <strong>Financial</strong>ConditionThe ability <strong>of</strong> a firm to pay its debts as they come due.A journal designed to record a single type <strong>of</strong> transaction. Journals used bybusinesses to record transactions that are similar in nature; examples are thepurchases journal and the cash payments journal. Also called special-purposejournals.Special report is a term applied to auditors' reports issued in connection withvarious types <strong>of</strong> financial presentations, including: <strong>Financial</strong> statements thatare prepared in conformity with a comprehensive basis <strong>of</strong> accounting otherthan generally accepted accounting principles. Specified elements, accountsor items <strong>of</strong> a financial statement. Compliance with aspects <strong>of</strong> contractualagreements or regulatory requirements related to audited financial statements.<strong>Financial</strong> presentations to comply with contractual agreements or regulatoryprovisions. <strong>Financial</strong> information presented in prescribed forms or schedulesthat require a prescribed form <strong>of</strong> auditor's reports.Difference between two prices, usually a buying and selling price. This happenswith interest in the case <strong>of</strong> micro-financeA statement <strong>of</strong> cash flows is one <strong>of</strong> the basic financial statements that is requiredas part <strong>of</strong> a complete set <strong>of</strong> financial statements prepared in conformity withgenerally accepted accounting principles. It categorizes net cash provided orused during a period as operating, investing and financing activities, andreconciles beginning and ending cash and cash equivalents. A financialstatement that provides information about the cash flows from operatingactivities, investing activities, and financing activities during an accountingperiod and the net increase or decrease in cash that occurred. A financialstatement that reports the flow <strong>of</strong> cash in and out <strong>of</strong> a company for a setperiod, usually one year. It reports the operating activities, investing activitiesand financing activities <strong>of</strong> the company.A basic financial statement devoted exclusively to reporting changes in financialposition for a specified period <strong>of</strong> time.A financial statement that reports the results <strong>of</strong> a company's business operations(revenue and expenses) for a set period, usually one year. Also called an earningsreport, income statement, statement <strong>of</strong> operations, and statement <strong>of</strong> pr<strong>of</strong>itand loss.Basic financial statement, usually accompanied by appropriate disclosuresthat describe the basis <strong>of</strong> accounting used in its preparation and presentationas <strong>of</strong> a specified date, the entity's assets, liabilities and the equity <strong>of</strong> its owners.Also known as balance sheet.Statement <strong>of</strong> <strong>Financial</strong> Position A financial statement that reports a company's assets and the claims againstthem - liabilities and stockholders' equity - at a set date noted on the statement.Also called the balance sheet.Statement <strong>of</strong> OperationsDefinitionA financial statement that reports the results <strong>of</strong> a company's business operations(revenue and expenses) for a set period, usually one year. Also called an earningsreport, income statement, statement <strong>of</strong> earnings, and statement <strong>of</strong> pr<strong>of</strong>it andloss.135
TermStatement <strong>of</strong> Pr<strong>of</strong>it and LossStraight-Line DepreciationStraight-Line DepreciationMethodSubsidiary LedgersSustainability:TangibleTangible AssetTermTerm LoanTimeTransactionTrendTrial BalanceTroubled Debt RestructuringUnaudited <strong>Financial</strong>StatementsUncollectible AccountUnearned IncomeA financial statement that reports the results <strong>of</strong> a company's business operations(revenue and expenses) for a set period, usually one year. Also called an earningsreport, income statement, statement <strong>of</strong> earnings, and statement <strong>of</strong> operations.Accounting method that reflects an equal amount <strong>of</strong> wear and tear duringeach period <strong>of</strong> an asset's useful life. For instance, the annual straight-linedepreciation <strong>of</strong> a currency (Dollor, Rupees, Pounds) 2,500 asset expected tolast five years is currency (Dollor, Rupees, Pounds) 500. (See accelerateddepreciation.)A method <strong>of</strong> depreciation that provides for equal periodic charges to expenseover the estimated life <strong>of</strong> an asset.Ledgers that contain only one type <strong>of</strong> account; the example in this chapter isthe accounts payable ledger.Sustainability is the ability <strong>of</strong> a micro credit programme to maintain itsoperations and continue to provide service to its customers or clients. AProgramme is sustainable when a combination <strong>of</strong> external grants, loans, andinternally generated revenues are sufficient to cover all programme expensesover the long term.All physical assets used by a business are tangible (capable <strong>of</strong> being touched).Assets having a physical existence, such as cash, land, buildings, machinery, orclaims on property, investments or goods in process. (See intangible assets.)Refers to the maturity or length <strong>of</strong> time until final repayment on a loan, bond,sale or other contractual obligation.Loan for a specified time period.The number <strong>of</strong> years, months, or days for which interest is charged. Alsocalled the term.Any activity that changes the value <strong>of</strong> a firm's assets, liabilities, or owner'sequity.A pattern in a company's financial performance over time. For example, if acompany's sales have been increasing over many months or years, analystswould describe this pattern as a sales growth trend.A listing <strong>of</strong> all ledger accounts with their balances to test the equality <strong>of</strong> debitsand credits; it is usually prepared at the end <strong>of</strong> each month. A summary listing<strong>of</strong> the balances and the titles <strong>of</strong> the accounts.Agreement between debtor and creditor which amends the terms <strong>of</strong> a debtthat has little chance <strong>of</strong> being paid in accordance with its contractual terms.The agreement may involve the transfer <strong>of</strong> assets in full or partial satisfaction<strong>of</strong> the debt.<strong>Financial</strong> statements which have not undergone a detailed auditexamination by an independent certified public accountant (CPA).Another name for bad debt.DefinitionPayments received for services which have not yet been performed.
Glossary <strong>of</strong> <strong>Financial</strong> TermsTermUnearned RevenueUnrestricted FundsVariable CostsVertical AnalysisVoucherVoucher RegisterVoucher SystemVoucherWageWorking CapitalWrite <strong>of</strong>fYieldDefinitionAnother name for deferred revenue, usually applying to amounts received ayear or less in advance. Revenue received in advance <strong>of</strong> its being earned.Resources <strong>of</strong> a not-for-pr<strong>of</strong>it entity that have no restrictions as to use or purpose.(See Fund Accounting and Restricted Fund.)Costs that vary in total as production varies, but remain the same per unitregardless <strong>of</strong> how many units are produced.The expression <strong>of</strong> each item in a company's financial statement as a percent <strong>of</strong>a base figure, in order to see the relative importance <strong>of</strong> each item. For thebalance sheet, the base is total assets; for the income statement, the base is netsales. The percentage analysis <strong>of</strong> component parts in relation to the total <strong>of</strong>the parts in a single financial statement.A method <strong>of</strong> accounting for cash payments in which all payments are authorizedin advance and kept track <strong>of</strong> internally through five components: voucher,voucher register, unpaid voucher file, check register, and paid voucher file.The journal in which all vouchers are recorded.A method <strong>of</strong> accounting for cash payments in which all payments are authorizedin advance and kept track <strong>of</strong> internally through five components: voucher,voucher register, unpaid voucher file, check register, and paid voucher file.Records, methods, and procedures employed in verifying and recordingliabilities and paying and recording cash payments.A document that serves as evidence <strong>of</strong> authority to pay cash.A fixed hourly rate paid to an employee.Technically, means current assets and current liabilities. The term is commonlyused a synonymous with net working capital. The term <strong>of</strong>ten also is used torefer to all short-term funding needs for operations (excluding debt serviceand fixed assets). A company's investment in current assets that are used tomaintain normal business operations. Net working capital, which is the excess<strong>of</strong> current assets over current liabilities, is also interchangeable with workingcapital. Both reflect the resources in circulation to meet operating needs andobligations as they come due. Excess <strong>of</strong> current assets over current liabilities.The excess <strong>of</strong> a firm's current assets over its current liabilities. A strong workingcapital means that the firm is likely to be able to carry on its current operations.The excess <strong>of</strong> total current assets over total current liabilities at some point intime.When an investment, such as a loan, becomes seriously delinquent or in defaultand is determined to be uncollectible, the lender may choose to charge theoutstanding investment amount as an expense or a loss.Return on an investment an investor receives from dividends or interestexpressed as a percentage <strong>of</strong> the cost <strong>of</strong> the security.
REFERENCESBarrel, Margaret, Michael J. McCord, and Robin R. Bell (1994), Fundamentals <strong>of</strong> Accounting for Micro-creditProgrammes, Washington, D.C.: U.S. Agency for International Development (USAID). GEMINI TechnicalNote 6.Barrel, Margaret, Michael J. McCord, and Robin R. Bell (1995), <strong>Financial</strong> Management Ratio: AnalysingPr<strong>of</strong>itability in Micro-credit Programs, Washington, D.C.: USAID. GEMINI Technical Note 7.Consultative Group to Assist the Poorest (1997), Format for Appraisal <strong>of</strong> Micro-finance Institutions, Washington,D.C.: World Bank.Christen, Robert Peck (1997), Banking Services for the Poor: Managing for <strong>Financial</strong> Success, Washington,D.C: ACCION International.Christen, Robert, Elisabeth Rhyne, Robert Vogel, and Cressida McKean (1995), Maximising the Outreach <strong>of</strong>Micro-enterprise Finance: An Analysis <strong>of</strong> Successful Micro-finance Programs, Washington. D.C.: USAID, Programand Operations Assessment Report 10.DAI/FINNET (2001), Micr<strong>of</strong>inance Institution <strong>Standards</strong>: A Tool for Improving <strong>Performance</strong>, Haiti, DAI/FINNET Technical Note 2.Eliot, Nicola (1996), Basic Accounting for Credit and <strong>Sa</strong>vings Schemes, London: Oxfam Basic Guides.Ledgerwood, Joanna (1996), <strong>Financial</strong> Management Training for Micr<strong>of</strong>inance Organization: Finance StudyGuide, New York: PACT Publications.Ledgerwood, Joanna and Kerri Moloney (1996), <strong>Financial</strong> Management Training for Micr<strong>of</strong>inance Organisations:Accounting Study Guide, New York: PACT Publications.Micro-Banking Bulletin (Issue No. 8, November 2002), Focus on Standardization, Washington. D.C.:Micr<strong>of</strong>inance Information Exchange.Paxton, Julia, and Carlos Cuevas (1997), Outreach and Sustainability <strong>of</strong> Member-Based Rural <strong>Financial</strong>Intermediaries, Washington. D.C.: World Bank.Paxton, Julia, and Cecile Fruman (1998), Outreach and Sustainability <strong>of</strong> <strong>Sa</strong>vings-First vs. Credit-First <strong>Financial</strong>Institutions: A Comparative Analysis <strong>of</strong> Eight Micro-finance Institutions in Africa, Washington, D.C.: WorldBank.PlaNet Finance (2000), GIRAFE Rating Methodology, Paris: PlaNet Finance.Richardson, David C. (2001), Pearls Monitoring System, Madison, USA: World Council <strong>of</strong> Credit Unions,Toolkit Series Number 4.<strong>Sa</strong>ltzman, Sonia B., Rachel Rock, and Darcy <strong>Sa</strong>linger (1998), <strong>Performance</strong> and <strong>Standards</strong> in Micro-finance:ACCION; Experience with the CAMEL Instrument, Washington, D.C.: ACCION International, DiscussionDocument 7.
Small Enterprise Education and Promotion (SEEP) Network (1995), <strong>Financial</strong> Ratio Analysis <strong>of</strong> Micro-FinanceInstitutions, New York: PACT Publications.Stearns, Katherine (1991), The Hidden Beast: Delinquency in Microenterprise Program, Washington, D.C.:ACCION International.Vogel, Robert C. (1998), Measurement <strong>of</strong> Loan Repayment <strong>Performance</strong>: Basic Considerations and Major Issue,Washington, D.C.: World Bank.Economic Development Institute (September 1994), Measuring the <strong>Performance</strong> <strong>of</strong> Small Enterprise Lenders,Washington, D.C.: World Bank.Waterfield, Charles, Nick Ramsing (1998), Management Information Systems for Micro-finance Institutions: AHandbook, Washington, D.C.: CGAPWomen’s World Banking (2001), <strong>Performance</strong> Indicators and Benchmarks, New York: Women’s World Banking.Yaron, Jacob, McDonald P. Benjamin Jr., and Gerda L. Piprek (1997), Rural Finance: Issues, Design, and BestPractices, Washington, D.C.: World Bank, Monograph Series 14Yaron, Jacob 1992. Assessing Development Finance Institutions: A Public Interest Analysis, Washington, D.C.:World Bank, Discussion Paper 174.PLUS SEVERAL INTERNAL DOCUMENTS OF SA-DHAN INCLUDING ITS STANDARDS STRTEGYFRAMEWORK, SUB-GROUP MINUTES AND OTHER REFERENCES.