Annual Report 2010 - Scana Industrier ASA
Annual Report 2010 - Scana Industrier ASA
Annual Report 2010 - Scana Industrier ASA

Create successful ePaper yourself
Turn your PDF publications into a flip-book with our unique Google optimized e-Paper software.
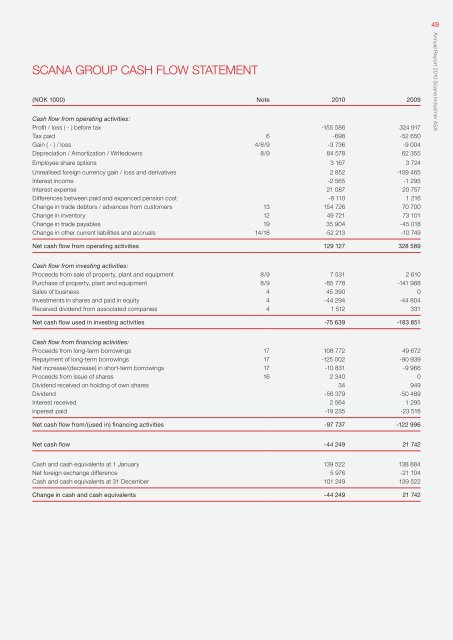
49<strong>Scana</strong> GROUP Cash flow STATEMENT(NOK 1000) Note <strong>2010</strong> 2009Cash flow from operating activities:Profit / loss ( - ) before tax -155 586 324 917Tax paid 6 -698 -52 650Gain ( - ) / loss 4/8/9 -3 736 -9 004Depreciation / Amortization / Writedowns 8/9 84 578 62 355Employee share options 3 167 3 724Unrealised foreign currency gain / loss and derivatives 2 852 -109 465Interest income -2 565 -1 295Interest expense 21 087 20 757Differences between paid and expenced pension cost -8 110 1 216Change in trade debtors / advances from customers 13 154 726 70 700Change in inventory 12 49 721 73 101Change in trade payables 19 35 904 -45 018Change in other current liabilities and accruals 14/18 -52 213 -10 749<strong>Annual</strong> <strong>Report</strong> <strong>2010</strong> <strong>Scana</strong> <strong>Industrier</strong> <strong>ASA</strong>Net cash flow from operating activities 129 127 328 589Cash flow from investing activities:Proceeds from sale of property, plant and equipment 8/9 7 531 2 610Purchase of property, plant and equipment 8/9 -85 778 -141 988Sales of business 4 45 390 0Investments in shares and paid in equity 4 -44 294 -44 804Received dividend from associated companies 4 1 512 331Net cash flow used in investing activities -75 639 -183 851Cash flow from financing activities:Proceeds from long-term borrowings 17 108 772 49 672Repayment of long-term borrowings 17 -125 002 -90 939Net increase/(decrease) in short-term borrowings 17 -10 831 -9 966Proceeds from issue of shares 16 2 340 0Dividend received on holding of own shares 34 949Dividend -56 379 -50 489Interest received 2 564 1 295inperest paid -19 235 -23 518Net cash flow from/(used in) financing activities -97 737 -122 996Net cash flow -44 249 21 742Cash and cash equivalents at 1 January 139 522 138 884Net foreign exchange difference 5 976 -21 104Cash and cash equivalents at 31 December 101 249 139 522Change in cash and cash equivalents -44 249 21 742