Download Annual Report, 2.44 MB - Xyratex
Download Annual Report, 2.44 MB - Xyratex
Download Annual Report, 2.44 MB - Xyratex
- No tags were found...

You also want an ePaper? Increase the reach of your titles
YUMPU automatically turns print PDFs into web optimized ePapers that Google loves.
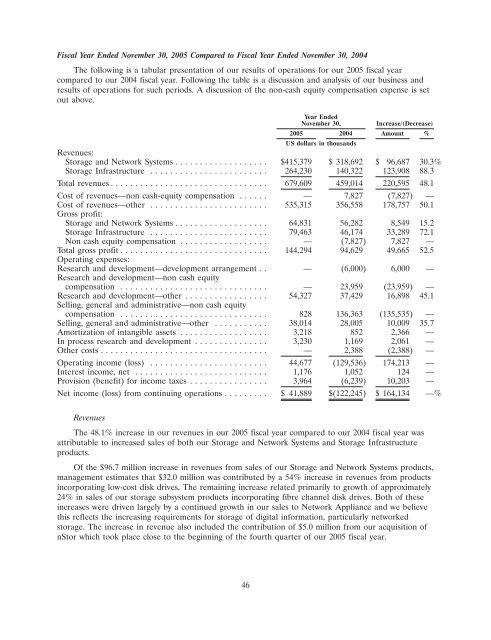
Fiscal Year Ended November 30, 2005 Compared to Fiscal Year Ended November 30, 2004The following is a tabular presentation of our results of operations for our 2005 fiscal yearcompared to our 2004 fiscal year. Following the table is a discussion and analysis of our business andresults of operations for such periods. A discussion of the non-cash equity compensation expense is setout above.Year EndedNovember 30,Increase/(Decrease)2005 2004 Amount %US dollars in thousandsRevenues:Storage and Network Systems ................... $415,379 $ 318,692 $ 96,687 30.3%Storage Infrastructure ........................ 264,230 140,322 123,908 88.3Total revenues ................................ 679,609 459,014 220,595 48.1Cost of revenues—non cash-equity compensation ...... — 7,827 (7,827) —Cost of revenues—other ........................ 535,315 356,558 178,757 50.1Gross profit:Storage and Network Systems ................... 64,831 56,282 8,549 15.2Storage Infrastructure ........................ 79,463 46,174 33,289 72.1Non cash equity compensation .................. — (7,827) 7,827 —Total gross profit .............................. 144,294 94,629 49,665 52.5Operating expenses:Research and development—development arrangement . . — (6,000) 6,000 —Research and development—non cash equitycompensation .............................. — 23,959 (23,959) —Research and development—other ................. 54,327 37,429 16,898 45.1Selling, general and administrative—non cash equitycompensation .............................. 828 136,363 (135,535) —Selling, general and administrative—other ........... 38,014 28,005 10,009 35.7Amortization of intangible assets .................. 3,218 852 2,366 —In process research and development ............... 3,230 1,169 2,061 —Other costs .................................. — 2,388 (2,388) —Operating income (loss) ........................ 44,677 (129,536) 174,213 —Interest income, net ........................... 1,176 1,052 124 —Provision (benefit) for income taxes ................ 3,964 (6,239) 10,203 —Net income (loss) from continuing operations ......... $ 41,889 $(122,245) $ 164,134 —%RevenuesThe 48.1% increase in our revenues in our 2005 fiscal year compared to our 2004 fiscal year wasattributable to increased sales of both our Storage and Network Systems and Storage Infrastructureproducts.Of the $96.7 million increase in revenues from sales of our Storage and Network Systems products,management estimates that $32.0 million was contributed by a 54% increase in revenues from productsincorporating low-cost disk drives. The remaining increase related primarily to growth of approximately24% in sales of our storage subsystem products incorporating fibre channel disk drives. Both of theseincreases were driven largely by a continued growth in our sales to Network Appliance and we believethis reflects the increasing requirements for storage of digital information, particularly networkedstorage. The increase in revenue also included the contribution of $5.0 million from our acquisition ofnStor which took place close to the beginning of the fourth quarter of our 2005 fiscal year.46