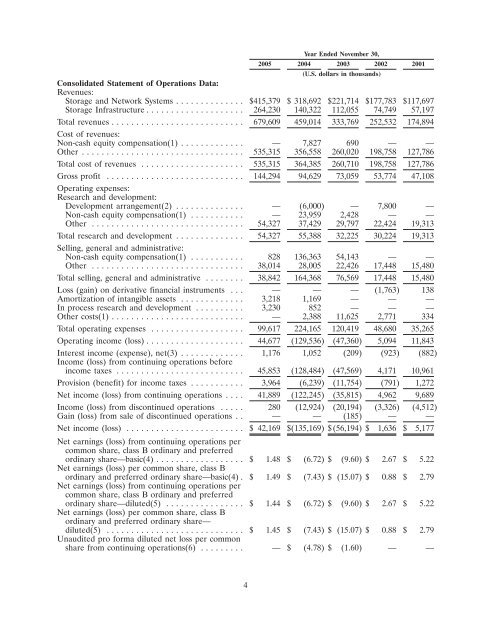
Year Ended November 30,2005 2004 2003 2002 2001(U.S. dollars in thousands)Consolidated Statement of Operations Data:Revenues:Storage and Network Systems .............. $415,379 $ 318,692 $221,714 $177,783 $117,697Storage Infrastructure .................... 264,230 140,322 112,055 74,749 57,197Total revenues ........................... 679,609 459,014 333,769 252,532 174,894Cost of revenues:Non-cash equity compensation(1) ............. — 7,827 690 — —Other ................................. 535,315 356,558 260,020 198,758 127,786Total cost of revenues ..................... 535,315 364,385 260,710 198,758 127,786Gross profit ............................ 144,294 94,629 73,059 53,774 47,108Operating expenses:Research and development:Development arrangement(2) .............. — (6,000) — 7,800 —Non-cash equity compensation(1) ........... — 23,959 2,428 — —Other ............................... 54,327 37,429 29,797 22,424 19,313Total research and development .............. 54,327 55,388 32,225 30,224 19,313Selling, general and administrative:Non-cash equity compensation(1) ........... 828 136,363 54,143 — —Other ............................... 38,014 28,005 22,426 17,448 15,480Total selling, general and administrative ........ 38,842 164,368 76,569 17,448 15,480Loss (gain) on derivative financial instruments . . . — — — (1,763) 138Amortization of intangible assets ............. 3,218 1,169 — — —In process research and development .......... 3,230 852 — — —Other costs(1) ........................... — 2,388 11,625 2,771 334Total operating expenses ................... 99,617 224,165 120,419 48,680 35,265Operating income (loss) .................... 44,677 (129,536) (47,360) 5,094 11,843Interest income (expense), net(3) ............. 1,176 1,052 (209) (923) (882)Income (loss) from continuing operations beforeincome taxes .......................... 45,853 (128,484) (47,569) 4,171 10,961Provision (benefit) for income taxes ........... 3,964 (6,239) (11,754) (791) 1,272Net income (loss) from continuing operations .... 41,889 (122,245) (35,815) 4,962 9,689Income (loss) from discontinued operations ..... 280 (12,924) (20,194) (3,326) (4,512)Gain (loss) from sale of discontinued operations . . — — (185) — —Net income (loss) ........................ $ 42,169 $(135,169) $(56,194) $ 1,636 $ 5,177Net earnings (loss) from continuing operations percommon share, class B ordinary and preferredordinary share—basic(4) .................. $ 1.48 $ (6.72) $ (9.60) $ 2.67 $ 5.22Net earnings (loss) per common share, class Bordinary and preferred ordinary share—basic(4) . $ 1.49 $ (7.43) $ (15.07) $ 0.88 $ 2.79Net earnings (loss) from continuing operations percommon share, class B ordinary and preferredordinary share—diluted(5) ................ $ 1.44 $ (6.72) $ (9.60) $ 2.67 $ 5.22Net earnings (loss) per common share, class Bordinary and preferred ordinary share—diluted(5) ............................ $ 1.45 $ (7.43) $ (15.07) $ 0.88 $ 2.79Unaudited pro forma diluted net loss per commonshare from continuing operations(6) ......... — $ (4.78) $ (1.60) — —4
(1) In accordance with U.S. GAAP, we were required to record a non-cash equity compensationexpense of $168.1 million in continuing operations and $12.9 million in discontinued operations inour 2004 fiscal year in connection with our initial public offering. We were also required to recorda non-cash equity compensation expense of $57.3 million in continuing operations and$19.9 million in discontinued operations in our 2003 fiscal year in connection with a transaction inwhich funds managed by HgCapital acquired a significant shareholding in <strong>Xyratex</strong> Group Limited.These expenses resulted from the removal of transferability restrictions on the shares and optionsas a consequence of the initial public offering or which were sold to funds managed by HgCapital.We also recorded expenses of the initial public offering and the HgCapital transaction totaling$2.4 million and $11.6 million in our 2004 and 2003 fiscal years, respectively.(2) Relates to a loan of $6.0 million and other payments of $1.8 million associated with a developmentarrangement with a supplier. These payments were recorded as an expense in our fiscal year endedNovember 30, 2002 as it was believed that repayment was dependent on the successful efforts ofthe related research and development. In February 2004, this supplier was acquired by anothercompany and in August 2004 the loan was repaid. Accordingly, we have reduced operatingexpenses by $6.0 million in our 2004 fiscal year. However, it is not possible to predict whether thepayment of $1.8 million will have any significant future benefit.(3) Interest income in our 2004 fiscal year includes interest received of $1.1 million on the $6.0 millionloan described in footnote (2) above.(4) Based on the weighted average (in thousands) of 28,329, 18,195, 3,730, 1,856 and 1,856<strong>Xyratex</strong> Ltd common shares and <strong>Xyratex</strong> Group Limited, class B ordinary and preferred ordinaryshares outstanding for the years ended November 30, 2005, 2004, 2003, 2002 and 2001,respectively. The computation of earnings per share does not include outstanding <strong>Xyratex</strong> GroupLimited class A ordinary and preferred ordinary shares and class C ordinary shares, which weresubject to transferability restrictions that lapsed on the earlier of an initial public offering or a saleor liquidation of <strong>Xyratex</strong> Group Limited. Under U.S. GAAP, these shares are not treated asoutstanding when computing net earnings per share.(5) Based on the weighted average (in thousands) of 29,031 <strong>Xyratex</strong> Ltd common shares outstandingfor the year ended November 30, 2005. The number of shares used in the computation of dilutedearnings per share for earlier fiscal years is the same as that used in the computation of basicearnings per share.(6) As described in Note 1 to the consolidated financial statements, upon completion of our IPO, theshareholders of <strong>Xyratex</strong> Group Limited exchanged the outstanding class A and class B preferredordinary shares and class C ordinary shares for common shares of <strong>Xyratex</strong> Ltd in the ratios1.036378, 0.945 and 1.071671, respectively. The pro forma effects of this exchange have beenreflected in the unaudited pro forma net loss per common share for the years ended November 30,2004 and 2003.The weighted average number of common shares used in the calculation of pro forma basic anddiluted net loss per common share for the year ended November 30, 2004 and November 30, 2003assumes the conversion of the class A and B ordinary and preferred ordinary shares, and the class Cordinary shares to common shares occurred on December 1, 2002 using the conversion ratios above.5