bok%3A978-3-658-02462-8.pdf?auth66=1398409209_a0514c2b8e531c058ab8b810a0cad74d&ext=
bok%3A978-3-658-02462-8.pdf?auth66=1398409209_a0514c2b8e531c058ab8b810a0cad74d&ext=
bok%3A978-3-658-02462-8.pdf?auth66=1398409209_a0514c2b8e531c058ab8b810a0cad74d&ext=
- No tags were found...

Create successful ePaper yourself
Turn your PDF publications into a flip-book with our unique Google optimized e-Paper software.
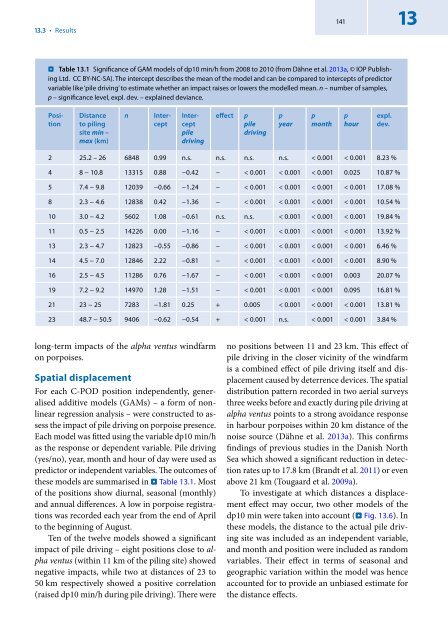
13.3 • Results141 13..Table 13.1 Significance of GAM models of dp10 min/h from 2008 to 2010 (from Dähne et al. 2013a, © IOP PublishingLtd. CC BY-NC-SA). The intercept describes the mean of the model and can be compared to intercepts of predictorvariable like ‘pile driving’ to estimate whether an impact raises or lowers the modelled mean. n – number of samples,p – significance level, expl. dev. – explained deviance.Distanceto pilingsite min –max (km)nPositionInterceptInterceptpiledrivingeffectppiledrivingpyearpmonthphourexpl.dev.2 25.2 – 26 6848 0.99 n.s. n.s. n.s. n.s. < 0.001 < 0.001 8.23 %4 8 − 10.8 13315 0.88 −0.42 − < 0.001 < 0.001 < 0.001 0.025 10.87 %5 7.4 − 9.8 12039 −0.66 −1.24 − < 0.001 < 0.001 < 0.001 < 0.001 17.08 %8 2.3 − 4.6 12838 0.42 −1.36 − < 0.001 < 0.001 < 0.001 < 0.001 10.54 %10 3.0 − 4.2 5602 1.08 −0.61 n.s. n.s. < 0.001 < 0.001 < 0.001 19.84 %11 0.5 − 2.5 14226 0.00 −1.16 − < 0.001 < 0.001 < 0.001 < 0.001 13.92 %13 2.3 − 4.7 12823 −0.55 −0.86 − < 0.001 < 0.001 < 0.001 < 0.001 6.46 %14 4.5 − 7.0 12846 2.22 −0.81 − < 0.001 < 0.001 < 0.001 < 0.001 8.90 %16 2.5 − 4.5 11286 0.76 −1.67 − < 0.001 < 0.001 < 0.001 0.003 20.07 %19 7.2 − 9.2 14970 1.28 −1.51 − < 0.001 < 0.001 < 0.001 0.095 16.81 %21 23 − 25 7283 −1.81 0.25 + 0.005 < 0.001 < 0.001 < 0.001 13.81 %23 48.7 − 50.5 9406 −0.62 −0.54 + < 0.001 n.s. < 0.001 < 0.001 3.84 %long-term impacts of the alpha ventus windfarmon porpoises.Spatial displacementFor each C‐POD position independently, generalisedadditive models (GAMs) – a form of nonlinearregression analysis – were constructed to assessthe impact of pile driving on porpoise presence.Each model was fitted using the variable dp10 min/has the response or dependent variable. Pile driving(yes/no), year, month and hour of day were used aspredictor or independent variables. The outcomes ofthese models are summarised in . Table 13.1. Mostof the positions show diurnal, seasonal (monthly)and annual differences. A low in porpoise registrationswas recorded each year from the end of Aprilto the beginning of August.Ten of the twelve models showed a significantimpact of pile driving – eight positions close to alphaventus (within 11 km of the piling site) showednegative impacts, while two at distances of 23 to50 km respectively showed a positive correlation(raised dp10 min/h during pile driving). There wereno positions between 11 and 23 km. This effect ofpile driving in the closer vicinity of the windfarmis a combined effect of pile driving itself and displacementcaused by deterrence devices. The spatialdistribution pattern recorded in two aerial surveysthree weeks before and exactly during pile driving atalpha ventus points to a strong avoidance responsein harbour porpoises within 20 km distance of thenoise source (Dähne et al. 2013a). This confirmsfindings of previous studies in the Danish NorthSea which showed a significant reduction in detectionrates up to 17.8 km (Brandt et al. 2011) or evenabove 21 km (Tougaard et al. 2009a).To investigate at which distances a displacementeffect may occur, two other models of thedp10 min were taken into account (. Fig. 13.6). Inthese models, the distance to the actual pile drivingsite was included as an independent variable,and month and position were included as randomvariables. Their effect in terms of seasonal andgeographic variation within the model was henceaccounted for to provide an unbiased estimate forthe distance effects.