- Page 1 and 2:
Federal Maritime and Hydrographic A
- Page 3 and 4:
Cover photos:alpha ventus offshore
- Page 5 and 6:
Federal Maritime and Hydrographic A
- Page 11 and 12:
XTable of Contents5.3 Learning from
- Page 13 and 14:
XIITable of Contents12.5.6 Estimati
- Page 15 and 16:
List of AuthorsDr. Sven AdlerSwedis
- Page 17 and 18:
List of AuthorsXVIIDr. Jochen Kraus
- Page 19 and 20:
List of AuthorsXIXKatharina Teschke
- Page 21 and 22:
3 1Current situation of offshoredev
- Page 23 and 24:
1.2 • Legal basis of offshore win
- Page 26 and 27:
8Chapter 1 • Current situation of
- Page 28 and 29:
11 2The Spatial Offshore GridPlan f
- Page 30:
2.2 • Accompanying Strategic Envi
- Page 34 and 35:
3.2 • Offshore challenges17 3..Fi
- Page 36 and 37:
3.3 • Operation of the offshore w
- Page 38 and 39:
3.7 • Outlook: alpha ventus as a
- Page 40 and 41:
3.7 • Outlook: alpha ventus as a
- Page 42 and 43:
26Chapter 4 • The RAVE research i
- Page 44 and 45:
28Chapter 4 • The RAVE research i
- Page 46 and 47:
31 5Accompanying ecologicalresearch
- Page 48 and 49:
5.1 • Environmentally compatible
- Page 50 and 51:
5.2 • Identifying environmental r
- Page 52 and 53:
Literature37 5..Fig. 5.4 Colonisati
- Page 54 and 55:
40Chapter 6 • Conservation featur
- Page 56 and 57:
42Chapter 6 • Conservation featur
- Page 58 and 59:
44Chapter 6 • Conservation featur
- Page 60 and 61:
46Chapter 7 • Challenges, results
- Page 62 and 63:
48Chapter 7 • Challenges, results
- Page 64 and 65:
51 IIMain sectionChapter 8Chapter 9
- Page 66 and 67:
53 8Oceanographic andgeological res
- Page 68 and 69:
8.2 • Methods55 8. . Fig. 8.1 (a)
- Page 70 and 71:
8.2 • Methods57 8era, which then
- Page 72 and 73:
8.2 • Methods59 8..Fig. 8.6 Diagr
- Page 74 and 75:
8.3 • Results and discussion61 8.
- Page 76 and 77:
8.3 • Results and discussion63 8.
- Page 78 and 79:
Literature65 8Information box: FINO
- Page 80 and 81:
68Chapter 9 • Increase of benthic
- Page 82 and 83:
70Chapter 9 • Increase of benthic
- Page 84 and 85:
72Chapter 9 • Increase of benthic
- Page 86 and 87:
74Chapter 9 • Increase of benthic
- Page 88 and 89:
76Chapter 9 • Increase of benthic
- Page 90 and 91:
78Chapter 9 • Increase of benthic
- Page 92 and 93:
80Chapter 9 • Increase of benthic
- Page 94 and 95:
83 10Effects of the alpha ventusoff
- Page 96 and 97:
10.1 • Introduction85 10..Fig. 10
- Page 98 and 99:
10.1 • Introduction87 10Near the
- Page 100 and 101:
10.2 • Methods89 10Hydroacoustic
- Page 102 and 103:
10.3 • Results and discussion91 1
- Page 104 and 105:
Literature93 10of the average stoma
- Page 106 and 107:
95 11Effects of the alpha ventusoff
- Page 108 and 109:
11.1 • Introduction97 11. . Fig.
- Page 110 and 111:
11.2 • Methods99 11..Fig. 11.3 Ke
- Page 112 and 113:
11.3 • Results101 11..Fig. 11.4 D
- Page 114 and 115:
11.3 • Results103 11..Fig. 11.7 D
- Page 116 and 117:
11.3 • Results105 11..Fig. 11.10
- Page 118 and 119:
11.4 • Discussion107 11Generally,
- Page 120 and 121:
Literature109 11..Fig. 11.13 One of
- Page 122 and 123: 111 12Of birds, blades and barriers
- Page 124 and 125: 12.3 • Bird migration over the Ge
- Page 126 and 127: 12.4 • Methods115 12oping dedicat
- Page 128 and 129: 12.4 • Methods117 12VARSVARS (Vis
- Page 130 and 131: 12.5 • Results and discussions119
- Page 132 and 133: 12.5 • Results and discussions121
- Page 134 and 135: 12.5 • Results and discussions123
- Page 136 and 137: 12.5 • Results and discussions125
- Page 138 and 139: 12.5 • Results and discussions127
- Page 140 and 141: 12.6 • Perspectivesferent viewing
- Page 142 and 143: Literature131 12Cooper BA, Day RH,
- Page 144 and 145: 134Chapter 13 • Effects of alpha
- Page 146 and 147: 136Chapter 13 • Effects of alpha
- Page 148 and 149: 138Chapter 13 • Effects of alpha
- Page 150 and 151: 140Chapter 13 • Effects of alpha
- Page 152 and 153: 142Chapter 13 • Effects of alpha
- Page 154 and 155: 144Chapter 13 • Effects of alpha
- Page 159: Literature149 13porpoises (Phocoena
- Page 162 and 163: 14.2 • Methods153 14. . Fig. 14.1
- Page 164 and 165: 14.1 • Introduction155 14..Table
- Page 166 and 167: 14.2 • Methods157 14..Fig. 14.4 T
- Page 168 and 169: 14.2 • Methods159 14..Fig. 14.6 T
- Page 170 and 171: 14.2 • Methods161 14..Fig. 14.10
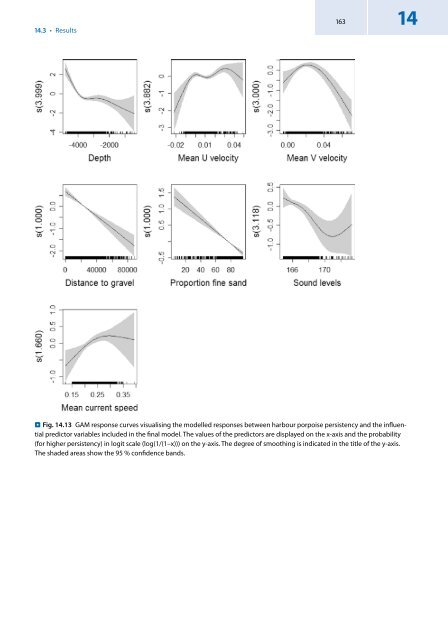
- Page 174 and 175: 14.3 • Results165 14..Fig. 14.15
- Page 176 and 177: 14.4 • Discussion167 1414.4 Discu
- Page 178 and 179: Literature169 1420 km for harbor po
- Page 180 and 181: 172Chapter 15 • Underwater constr
- Page 182 and 183: 174Chapter 15 • Underwater constr
- Page 184 and 185: 176Chapter 15 • Underwater constr
- Page 186 and 187: 178Chapter 15 • Underwater constr
- Page 188 and 189: 180Chapter 15 • Underwater constr
- Page 190 and 191: 182Chapter 16 • Noise mitigation
- Page 192 and 193: 184Chapter 16 • Noise mitigation
- Page 194 and 195: 186Chapter 16 • Noise mitigation
- Page 196 and 197: 188Chapter 16 • Noise mitigation
- Page 198 and 199: 190Chapter 16 • Noise mitigation
- Page 200 and 201: 193 17Cumulative impactsof offshore
- Page 202 and 203: 17.4 • Underwater noise and marin
- Page 204 and 205: Literature197 17..Fig. 17.2 State o
- Page 206 and 207: 199BackmatterLinks200Federal Mariti
- Page 208: Links201North Sea and Baltic Sea Mo