EMIS - UN-Habitat
EMIS - UN-Habitat
EMIS - UN-Habitat

Create successful ePaper yourself
Turn your PDF publications into a flip-book with our unique Google optimized e-Paper software.
Building an Environmental Management Information System<br />
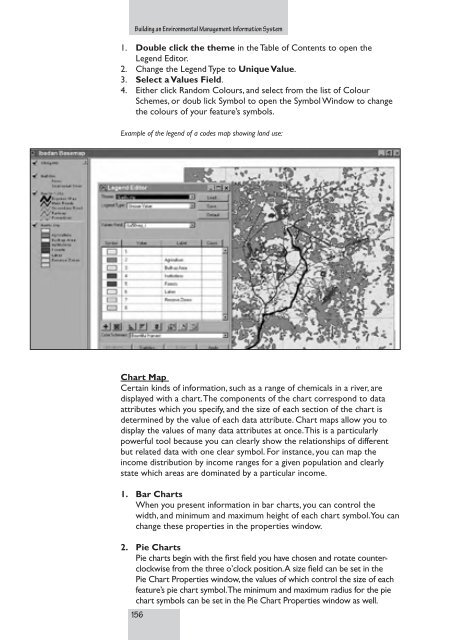
1. Double click the theme in the Table of Contents to open the<br />
Legend Editor.<br />
2. Change the Legend Type to Unique Value.<br />
3. Select a Values Field.<br />
4. Either click Random Colours, and select from the list of Colour<br />
Schemes, or doub lick Symbol to open the Symbol Window to change<br />
the colours of your feature’s symbols.<br />
Example of the legend of a codes map showing land use:<br />
Chart Map<br />
Certain kinds of information, such as a range of chemicals in a river, are<br />
displayed with a chart.The components of the chart correspond to data<br />
attributes which you specify, and the size of each section of the chart is<br />
determined by the value of each data attribute. Chart maps allow you to<br />
display the values of many data attributes at once.This is a particularly<br />
powerful tool because you can clearly show the relationships of different<br />
but related data with one clear symbol. For instance, you can map the<br />
income distribution by income ranges for a given population and clearly<br />
state which areas are dominated by a particular income.<br />
1. Bar Charts<br />
When you present information in bar charts, you can control the<br />
width, and minimum and maximum height of each chart symbol.You can<br />
change these properties in the properties window.<br />
2. Pie Charts<br />
Pie charts begin with the first field you have chosen and rotate counterclockwise<br />
from the three o’clock position.A size field can be set in the<br />
Pie Chart Properties window, the values of which control the size of each<br />
feature’s pie chart symbol.The minimum and maximum radius for the pie<br />
chart symbols can be set in the Pie Chart Properties window as well.<br />
156