presentation, part 1 - Molecular Evolution
presentation, part 1 - Molecular Evolution
presentation, part 1 - Molecular Evolution
- No tags were found...

Create successful ePaper yourself
Turn your PDF publications into a flip-book with our unique Google optimized e-Paper software.
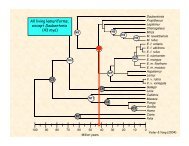
Table 4 Posterior means and 95% credibility intervals for divergence timesmtDNA(3 <strong>part</strong>itions)Node complete 2 speciesN1) Northern Clade10.0(6.3, 15.2)N2) Southern Clade8.8(5.3, 13.6)N3) Microcebus12.0(7.8, 17.9)N4) Microcebus/Mirza24.2(16.8, 33.4)N5) Cheirogaleidae 1 31.8(23.4, 41.6)N6) Eulemur8.4(5.3, 13.4)N7) Lemuridae35.9(27.0, 46.3)N8) Internal Lemuriform46.7(36.9, 57.5)N9) Lemuriformes67.1(56.8, 77.2)C8) Lorisiformes (38 – 42 mya)40.0(38.1, 41.9)N10) Strepsirrhini72.9(64.0, 82.0)C1) Human/Gorilla (8 –12 mya)10.9(8.9, 12.0)C2) Monkey/Ape (32 – 38 mya)34.0(32.1, 37.5)N11) Anthropoidea61.8(51.0, 73.8)C3) Basal primate (63 –90 mya)85.9(78.4, 89.9)C7) Canid/felid (45 – 65 mya)58.1(48.9, 64.6)C6) Whale/hippo (51 – 60 mya)56.0(51.4, 59.8)TRvWFIRBP(3 <strong>part</strong>itions)3 nuclear(5 <strong>part</strong>itions)All genes(8 <strong>part</strong>itions)NA NA NA NA NA NANA NA NA NA NA NA9.0(5.2, 14.0)20.5(13.5, 29.2)26.7(18.8, 36.4)6.6(3.8, 11.1)33.1(24.2, 43.8)43.8(33.8, 54.9)65.7(54.8, 76.3)39.9(38.1, 41.9)72.4(63.2, 81.7)10.7(8.6, 12.0)34.2(32.1, 37.6)62.2(50.5, 75.1)85.9(78.1, 89.8)57.9(48.6, 64.6)56.0(51.4, 59.8)NANANA7.0(2.1, 15.7)32.1(20.4, 46.5)NA54.9(41.7, 70.6)NANANA35.2(32.2, 37.9)43.5(36.6, 51.5)70.0(63.2, 84.0)55.7(45.8, 64.5)NA8.7(3.7, 16.5)19.3(10.8, 30.5)31.3(19.9, 44.2)14.6(7.8, 24.2)33.4(22.4, 46.2)45.7(33.5, 58.5)62.8(51.3, 74.4)39.7(38.1, 41.8)70.7(60.3, 81.6)10.1(8.1, 11.9)34.7(32.1, 37.8)42.0(35.4, 49.9)85.9(78.1, 89.8)NANANA22.8(11.3, 36.6)30.9(19.2, 44.7)14.6(7.8, 23.7)26.4(16.3, 39.1)45.1(32.4, 60.1)60.2(46.2, 75.1)39.6(38.1, 41.8)70.1(56.8, 83.8)9.4(8.0, 11.7)34.7(32.1, 37.8)49.8(37.6, 64.3)85.4(75.4, 89.8)57.2(46.4, 64.6)54.6(51.1, 59.5)NA19.1(12.3, 27.6)30.6(22.4, 39.7)11.1(7.0, 16.4)31.1(23.3, 39.8)42.2(33.5, 51.3)65.0(56.3, 73.7)39.5(38.1, 41.8)74.9(66.1, 83.0)9.6(8.1, 11.8)34.2(32.1, 37.5)42.9(37.8, 48.7)82.5(73.0, 89.6)60.1(50.3, 64.8)NA8.9(5.5, 13.2)19.9(14.6, 26.1)29.0(22.7, 35.9)9.7(6.5. 13.7)31.9(25.6, 38.8)42.3(35.4, 49.5)62.0(57.9, 73.0)39.1(38.0, 41.5)68.5(61.3, 75.4)10.2(8.2, 11.9)34.7(32.1, 37.8)49.4(43.5, 55.7)84.9(76.9, 89.8)61.4(54.0, 64.9)Have added considerable data to lemur origins question; good congruenceacross loci and analyses; all data (best) estimate is ~ 62 myaNAYoder & Yang (2004)