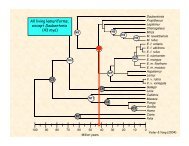
Table 4 Posterior means and 95% credibility intervals for divergence timesmtDNA(3 <strong>part</strong>itions)Node complete 2 speciesN1) Northern Clade10.0(6.3, 15.2)N2) Southern Clade8.8(5.3, 13.6)N3) Microcebus12.0(7.8, 17.9)N4) Microcebus/Mirza24.2(16.8, 33.4)N5) Cheirogaleidae 1 31.8(23.4, 41.6)N6) Eulemur8.4(5.3, 13.4)N7) Lemuridae35.9(27.0, 46.3)N8) Internal Lemuriform46.7(36.9, 57.5)N9) Lemuriformes67.1(56.8, 77.2)C8) Lorisiformes (38 – 42 mya)40.0(38.1, 41.9)N10) Strepsirrhini72.9(64.0, 82.0)C1) Human/Gorilla (8 –12 mya)10.9(8.9, 12.0)C2) Monkey/Ape (32 – 38 mya)34.0(32.1, 37.5)N11) Anthropoidea61.8(51.0, 73.8)C3) Basal primate (63 –90 mya)85.9(78.4, 89.9)C7) Canid/felid (45 – 65 mya)58.1(48.9, 64.6)C6) Whale/hippo (51 – 60 mya)56.0(51.4, 59.8)TRvWFIRBP(3 <strong>part</strong>itions)3 nuclear(5 <strong>part</strong>itions)All genes(8 <strong>part</strong>itions)NA NA NA NA NA NANA NA NA NA NA NA9.0(5.2, 14.0)20.5(13.5, 29.2)26.7(18.8, 36.4)6.6(3.8, 11.1)33.1(24.2, 43.8)43.8(33.8, 54.9)65.7(54.8, 76.3)39.9(38.1, 41.9)72.4(63.2, 81.7)10.7(8.6, 12.0)34.2(32.1, 37.6)62.2(50.5, 75.1)85.9(78.1, 89.8)57.9(48.6, 64.6)56.0(51.4, 59.8)NANANA7.0(2.1, 15.7)32.1(20.4, 46.5)NA54.9(41.7, 70.6)NANANA35.2(32.2, 37.9)43.5(36.6, 51.5)70.0(63.2, 84.0)55.7(45.8, 64.5)NA8.7(3.7, 16.5)19.3(10.8, 30.5)31.3(19.9, 44.2)14.6(7.8, 24.2)33.4(22.4, 46.2)45.7(33.5, 58.5)62.8(51.3, 74.4)39.7(38.1, 41.8)70.7(60.3, 81.6)10.1(8.1, 11.9)34.7(32.1, 37.8)42.0(35.4, 49.9)85.9(78.1, 89.8)NANANA22.8(11.3, 36.6)30.9(19.2, 44.7)14.6(7.8, 23.7)26.4(16.3, 39.1)45.1(32.4, 60.1)60.2(46.2, 75.1)39.6(38.1, 41.8)70.1(56.8, 83.8)9.4(8.0, 11.7)34.7(32.1, 37.8)49.8(37.6, 64.3)85.4(75.4, 89.8)57.2(46.4, 64.6)54.6(51.1, 59.5)NA19.1(12.3, 27.6)30.6(22.4, 39.7)11.1(7.0, 16.4)31.1(23.3, 39.8)42.2(33.5, 51.3)65.0(56.3, 73.7)39.5(38.1, 41.8)74.9(66.1, 83.0)9.6(8.1, 11.8)34.2(32.1, 37.5)42.9(37.8, 48.7)82.5(73.0, 89.6)60.1(50.3, 64.8)NA8.9(5.5, 13.2)19.9(14.6, 26.1)29.0(22.7, 35.9)9.7(6.5. 13.7)31.9(25.6, 38.8)42.3(35.4, 49.5)62.0(57.9, 73.0)39.1(38.0, 41.5)68.5(61.3, 75.4)10.2(8.2, 11.9)34.7(32.1, 37.8)49.4(43.5, 55.7)84.9(76.9, 89.8)61.4(54.0, 64.9)Have added considerable data to lemur origins question; good congruenceacross loci and analyses; all data (best) estimate is ~ 62 myaNAYoder & Yang (2004)
Lessons learned (a few):• Multiple calibrations essential; single calibrationsalways (in our study) systematicallyunderestimated dates across the tree• estimating <strong>part</strong>ition-specific parameters has abig impact on date estimation --- presumablyincreasing accuracy• the model matters (a lot!)• the model and the data have much larger impactthan the method (e.g., ML versus Bayesian)