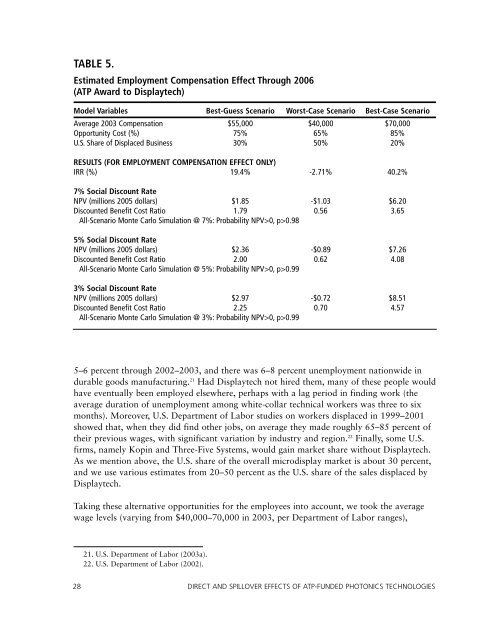
TABLE 5.Estimated Employment Compensation Effect Through 2006(<strong>ATP</strong> Award to Displaytech)Model Variables Best-Guess Scenario Worst-Case Scenario Best-Case ScenarioAverage 2003 Compensation $55,000 $40,000 $70,000Opportunity Cost (%) 75% 65% 85%U.S. Share <strong>of</strong> Displaced Business 30% 50% 20%RESULTS (FOR EMPLOYMENT COMPENSATION EFFECT ONLY)IRR (%) 19.4% -2.71% 40.2%7% Social Discount RateNPV (millions 2005 dollars) $1.85 -$1.03 $6.20Discounted Benefit Cost Ratio 1.79 0.56 3.65All-Scenario Monte Carlo Simulation @ 7%: Probability NPV>0, p>0.985% Social Discount RateNPV (millions 2005 dollars) $2.36 -$0.89 $7.26Discounted Benefit Cost Ratio 2.00 0.62 4.08All-Scenario Monte Carlo Simulation @ 5%: Probability NPV>0, p>0.993% Social Discount RateNPV (millions 2005 dollars) $2.97 -$0.72 $8.51Discounted Benefit Cost Ratio 2.25 0.70 4.57All-Scenario Monte Carlo Simulation @ 3%: Probability NPV>0, p>0.995–6 percent through 2002–2003, <strong>and</strong> there was 6–8 percent unemployment nationwide indurable goods manufacturing. 21 Had Displaytech not hired them, many <strong>of</strong> these people wouldhave eventually been employed elsewhere, perhaps with a lag period in finding work (theaverage duration <strong>of</strong> unemployment among white-collar technical workers was three to sixmonths). Moreover, U.S. Department <strong>of</strong> Labor studies on workers displaced in 1999–2001showed that, when they did find other jobs, on average they made roughly 65–85 percent <strong>of</strong>their previous wages, with significant variation by industry <strong>and</strong> region. 22 Finally, some U.S.firms, namely Kopin <strong>and</strong> Three-Five Systems, would gain market share without Displaytech.As we mention above, the U.S. share <strong>of</strong> the overall microdisplay market is about 30 percent,<strong>and</strong> we use various estimates from 20–50 percent as the U.S. share <strong>of</strong> the sales displaced byDisplaytech.Taking these alternative opportunities for the employees into account, we took the averagewage levels (varying from $40,000–70,000 in 2003, per Department <strong>of</strong> Labor ranges),21. U.S. Department <strong>of</strong> Labor (2003a).22. U.S. Department <strong>of</strong> Labor (2002).28 DIRECT AND SPILLOVER EFFECTS OF <strong>ATP</strong>-FUNDED PHOTONICS TECHNOLOGIES
subtracted the opportunity value <strong>of</strong> those employees doing other things (varying from 65–85percent), <strong>and</strong> subtracted what might have been the U.S. share (varying from 20–50 percent).Given the employment trends in Figure 6, <strong>and</strong> assuming Displaytech continues to employ atleast 50 people through 2006, then adjusting for technology-sector wage inflation, using theOffice <strong>of</strong> Management <strong>and</strong> Budget’s (OMB) statutory social discount rate <strong>of</strong> 7 percent, <strong>and</strong>netting out the $1.75 million <strong>ATP</strong> grant, we estimate the net present value (NPV) <strong>of</strong> thedifference over the period 1995–2006 between Displaytech with <strong>and</strong> without <strong>ATP</strong> as $1.85million (2005 dollars), our best-guess scenario point estimate. The OMB’s 7 percent comesfrom the historical average return for private investments. However, there is compellingtheoretic support (e.g., Caplin <strong>and</strong> Leahy, 2004) that social planners should use lowerdiscount rates than private returns. Indeed, the United Kingdom (HM Treasury, 2003)st<strong>and</strong>ard is 3.5 percent in evaluations for time periods up to 30 years, <strong>and</strong> lower rates foreven longer periods. So, we also explored two alternative social discount rates. At a 5 percentsocial discount rate, the best-guess scenario NPV is $2.36 million, <strong>and</strong> at 3 percent it rises to$4.04 million.Discount rate notwithst<strong>and</strong>ing, if we count only this employment effect, this represents adecent, though not spectacular, 19.4 percent internal rate <strong>of</strong> return (IRR) from the <strong>ATP</strong>investment <strong>and</strong> discounted benefit to cost ratios ranging from 1.79 to 2.25. (Note that thesevalues are only for the direct economic effects on Displaytech, its employees, <strong>and</strong> competitors<strong>and</strong> do not include direct effects on downstream consumers or indirect knowledge spillovereffects outside <strong>of</strong> the market.) Our NPV estimate <strong>of</strong> the direct employment compensationeffect ranges from -$1.03 million in the worst-case scenario at the 7 percent discount rate to$8.51 million in the best-case scenario at the 3 percent discount rate. Assuming simpletriangular probability functions on the low, best-guess, <strong>and</strong> high values for the variousparameters, we used Monte Carlo simulation to generate probability distributions, shown inFigure 7, for the additive value <strong>of</strong> the <strong>ATP</strong> award. The award has positive net value to thenation in more than 98 percent <strong>of</strong> the Monte Carlo variations under each <strong>of</strong> the threediscount rates, with mean values <strong>of</strong> $1.63 million at 7 percent, $2.17 million at 5 percent<strong>and</strong> $2.66 million at 3 percent. The internal rate <strong>of</strong> return averaged about 18 percent. Thesefigures for employment compensation are less speculative than the estimates that follow forthe consumer surplus <strong>and</strong> knowledge spillover effects, <strong>and</strong>, as such, they represent a mostconservative set <strong>of</strong> estimates.CONSUMER SURPLUSFor the impact <strong>of</strong> Displaytech on consumer surplus in the market, as indicated by the uppershaded region in Figure 5, we estimate the net increase in the value <strong>of</strong> sales, accounting forpotential price <strong>and</strong> quantity effects to consumers <strong>and</strong> competitors <strong>and</strong> for some displacedsales volume from U.S.-based competitors.In the current main application <strong>of</strong> Displaytech microdisplays, viewfinders, the advantages<strong>of</strong> their specific ferroelectric liquid crystal technology are not yet enabling anything thatalternative microdisplay approaches cannot. As one impartial industry observer weinterviewed put it, the performance difference for the end users from FLC in viewfindersDisplaytech 29