Annual Report 2003 - Nobel Biocare Corporate
Annual Report 2003 - Nobel Biocare Corporate
Annual Report 2003 - Nobel Biocare Corporate
- No tags were found...

You also want an ePaper? Increase the reach of your titles
YUMPU automatically turns print PDFs into web optimized ePapers that Google loves.
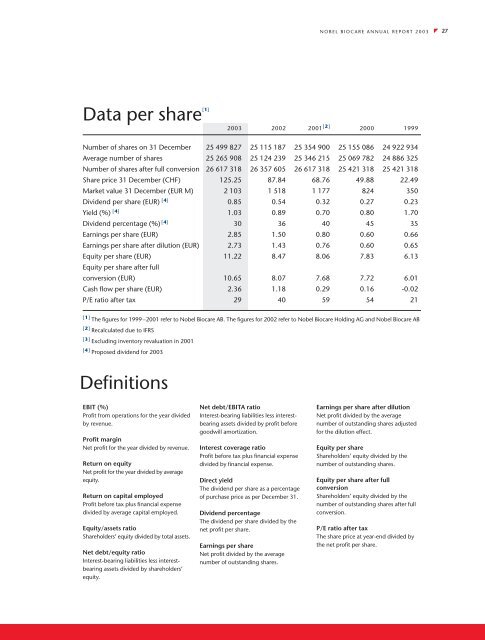
NOBEL BIOCARE ANNUAL REPORT <strong>2003</strong>27Data per share [1] <strong>2003</strong> 2002 2001 [2] 2000 1999Number of shares on 31 December 25 499 827 25 115 187 25 354 900 25 155 086 24 922 934Average number of shares 25 265 908 25 124 239 25 346 215 25 069 782 24 886 325Number of shares after full conversion 26 617 318 26 357 605 26 617 318 25 421 318 25 421 318Share price 31 December (CHF) 125.25 87.84 68.76 49.88 22.49Market value 31 December (EUR M) 2 103 1 518 1 177 824 350Dividend per share (EUR) [4] 0.85 0.54 0.32 0.27 0.23Yield (%) [4] 1.03 0.89 0.70 0.80 1.70Dividend percentage (%) [4] 30 36 40 45 35Earnings per share (EUR) 2.85 1.50 0.80 0.60 0.66Earnings per share after dilution (EUR) 2.73 1.43 0.76 0.60 0.65Equity per share (EUR) 11.22 8.47 8.06 7.83 6.13Equity per share after fullconversion (EUR) 10.65 8.07 7.68 7.72 6.01Cash flow per share (EUR) 2.36 1.18 0.29 0.16 -0.02P/E ratio after tax 29 40 59 54 21[1] The figures for 1999 –2001 refer to <strong>Nobel</strong> <strong>Biocare</strong> AB. The figures for 2002 refer to <strong>Nobel</strong> <strong>Biocare</strong> Holding AG and <strong>Nobel</strong> <strong>Biocare</strong> AB[2] Recalculated due to IFRS[3] Excluding inventory revaluation in 2001[4] Proposed dividend for <strong>2003</strong>DefinitionsEBIT (%)Profit from operations for the year dividedby revenue.Profit marginNet profit for the year divided by revenue.Return on equityNet profit for the year divided by averageequity.Return on capital employedProfit before tax plus financial expensedivided by average capital employed.Equity/assets ratioShareholders’ equity divided by total assets.Net debt/equity ratioInterest-bearing liabilities less interestbearingassets divided by shareholders’equity.Net debt/EBITA ratioInterest-bearing liabilities less interestbearingassets divided by profit beforegoodwill amortization.Interest coverage ratioProfit before tax plus financial expensedivided by financial expense.Direct yieldThe dividend per share as a percentageof purchase price as per December 31.Dividend percentageThe dividend per share divided by thenet profit per share.Earnings per shareNet profit divided by the averagenumber of outstanding shares.Earnings per share after dilutionNet profit divided by the averagenumber of outstanding shares adjustedfor the dilution effect.Equity per shareShareholders’ equity divided by thenumber of outstanding shares.Equity per share after fullconversionShareholders’ equity divided by thenumber of outstanding shares after fullconversion.P/E ratio after taxThe share price at year-end divided bythe net profit per share.