Lubna landfill
Lubna landfill
Lubna landfill
- No tags were found...

You also want an ePaper? Increase the reach of your titles
YUMPU automatically turns print PDFs into web optimized ePapers that Google loves.
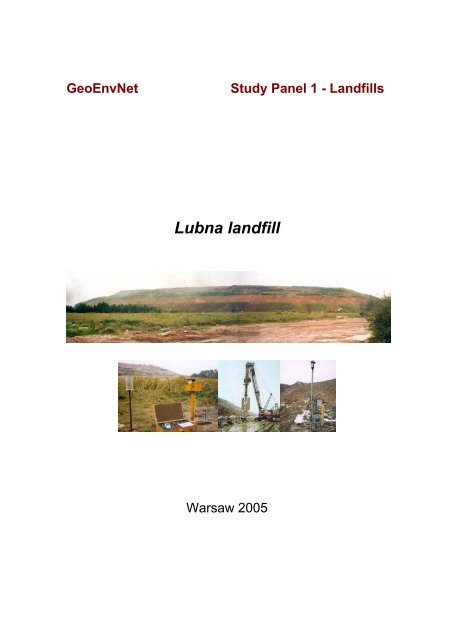
GeoEnvNetStudy Panel 1 - Landfills<strong>Lubna</strong> <strong>landfill</strong>Warsaw 2005
<strong>Lubna</strong> <strong>landfill</strong>1 IntroductionMunicipal wastes from Warsaw are utilised at several places, among others at the <strong>Lubna</strong> site (Fig.1), an old large <strong>landfill</strong>, located nearby residential areas. The construction of the <strong>Lubna</strong> <strong>landfill</strong> hasnot been sufficient enough with regard to the stability and environmental protection. After havingutilised the <strong>landfill</strong> for many years, it became necessary to stabilise the <strong>landfill</strong> slopes and toperform remedial works to prevent pollution of the surrounding groundwater levels.This summary starts with descriptions of the site of the <strong>Lubna</strong> <strong>landfill</strong> and the subsoil conditions,followed by investigations of parameters of wastes, including waste morphology analysis, physicaland hydraulic properties, sounding and permeability tests, settlement and lateral movementmeasurements as well as back analysis. The test results were used for water balance evaluationdisplacement prediction, stability analysis and groundwater flow modelling. As it has beenmentioned, remedial works have been performed, including slope reinforcements, construction ofa cut-off wall, a leachate drainage system, a treatment plant, technological roads construction,mineral capping system, as well as ecological remediation with plants and a degassing system.The pollutants transport is controlled by local water monitoring system. In the future the <strong>landfill</strong>area will be used for recreation purposes.FIG. 1 View of the western slope of the <strong>Lubna</strong> <strong>landfill</strong>2 Site location and descriptionThe <strong>Lubna</strong> <strong>landfill</strong> is located at a distance of approximately 35 km to the south of the centre ofWarsaw, in the Góra Kalwaria commune. Forests and idle land surround the site (Fig. 2). Thenearest residential area (Baniocha village) is located at the distance of 08 km to the west (Fig. 3).The site has been used since 1978. At present, it covers an area of approximately 20 ha and it isapproximately 45 m high. In general, the new slopes have an inclination of 1:2.5. Łubna is the onlysanitary <strong>landfill</strong> where all kinds of municipal wastes from Warsaw are stored. In 1995-1996 slimesfrom the sewage-treatment plant were also disposed there. Every day ca 1000 tons of wastes aresupplied. It will be shut down in 2004.For many years there was no environmental protection system, therefore pollutants could beeasily spread to the surrounding groundwater environment. Since 1996, remediation works havebeen carried out on the <strong>landfill</strong>. They include a bentonite barrier wall around the <strong>landfill</strong>(constructed in 1998), a leachate drainage system (constructed in 1997-1998), a treatment plant(under start-up), <strong>landfill</strong> body forming, berms for improvement of slope stability (underconstruction), degassing (under start-up), a mineral capping system, as well as the coverage ofslopes with compost and plants. The development plan with remedial solutions for the <strong>Lubna</strong><strong>landfill</strong> is presented in Fig. 4.3
FIG. 2 View of the <strong>landfill</strong> and nearest surroundingsFIG. 3 Location of the <strong>Lubna</strong> <strong>landfill</strong> and local water monitoring system4
4 Investigations of waste properties4.1. Scope of investigationsThe in situ tests for the <strong>Lubna</strong> <strong>landfill</strong> were performed bewteen 1996-2002. They were todetermine the mechanical parameters of wastes for stability analysis, settlement prediction andestimation of bearing capacity for the road foundation (Fig. 4). The following field investigationswere carried out:1. Waste morphology analysis.2. WST (weight sounding tests).3. Settlement and lateral movement measurements.4. Back-analysis for stability and displacement predictions.5. Permeability tests of wastes and subsoil layers.4.2. Waste morphology analysisWaste composition determination was performed by sorting, and shifting through a 10 mm strainerwith for separating the fine fraction. The measurements were made for wastes delivered fromWarsaw. The contents of each waste component are presented in Table 1. The moisture contentof municipal wastes was approximately 45 %.Table 1. Average composition of fresh municipal wastes stored on the <strong>Lubna</strong> <strong>landfill</strong>No Waste components% of average weightof municipal wastes1 Paper 222 Glass 123 Metals 64 Textiles 55 Plastics 96 Mineral matter > 10 mm 47 Animal origin wastes 38 Plant origin wastes 269 Organic origin matter > 10 mm 310 Fraction 0-10 mm 104.3. Sounding testsThe weight sounding tests (WST) were generally performed along the axis and in the vicinity ofroads on the <strong>landfill</strong>. The tests have been repeated each time when 5 m of waste had been laid.The sounding was continued until the sound tip reached obstacles (tyres, metals etc) or stoppedwhen 100 half-turns per 20 cm (N 20 >100) were achieved. The sounding results were used forquality control of the road foundation and waste layers compaction (see Radiowo Report). For the<strong>Lubna</strong> <strong>landfill</strong> (consisting of fresh and old wastes), slighty lower values of N 20 and thus of therelative density I D were reached in comparison to the Radiowo <strong>landfill</strong>. This results in thedifference of wastes morphology between the Radiowo and <strong>Lubna</strong> <strong>landfill</strong>s. Slimes and theapplication of thin layers of sand between layers of waste also influence the low density of wastes.7
4.4 Permeability testsThe permeability coefficients were determined by laboratory and field tests for wastes, aquitardlayers and bentonite material. The waste permeability in the field was established by the Maggmethod. The waste permeability coefficient was determined in the laboratory in the triaxial cell andby the modified constant gradient. The modification was based on permeability measurementsunder stress modelling conditions, at different depths of the <strong>landfill</strong>. On the basis of these testswithout loading, the coefficient of permeability for fresh wastes was approximately k 10 =5x10 -4 m/s,while for the old wastes - k 10 =1x10 -4 m/s. The coefficient values for fresh wastes under loading of25 and 50 kPa resulted in: k 10 =1x10 -5 m/s and k 10 =8x10 -6 m/s, while these of the old wastes:k 10 =8x10 -6 m/s and k 10 =4x10 -6 m/s, respectively.The permeability coefficients of soils creating aquitard layers were performed by the BAT system.The average permeability coefficient for these layers was k=10 -8 m/s.The permeability of the bentonite vertical barrier was tested in the laboratory using triaxial cell(Fig. 7) and falling head methods (Fig. 8), while in the field, the permeability was tested by theBAT system (Fig. 9). All permeability coefficients were lower than k
FIG. 9 Field permeability tests of the aquitard layer by the BAT system4.5 Settlement and lateral movement measurementsLandfill settlement consists of load-, decomposition- and time-dependant compression. Thedetermination of compressibility parameters of wastes needs long-term field and/or laboratorytests. Permanent surveys of settlement and horizontal slope movements of the <strong>landfill</strong> body havebeen carried out since 1996. The bench-marks were installed on the slopes (for settlement andlateral displacement measurements) and along the main access road (for settlementmeasurement). The total number of installed bench-marks was approximately 50 points.Displacement measurements using geodesy techniques are taken every 3 months. The testresults serve to forecasting settlement of the access roads on further sections, designing the solidshape and assessing the capacity of the <strong>landfill</strong>. The <strong>landfill</strong> map with measured lateralmovements and settlements values is presented in Fig. 10.4.6 Back-analysisBack stability analyses by Bishop’s, Swedish and FEM (Z-SOIL numerical program) methods forthe landslide that took place in 1995 on the <strong>Lubna</strong> <strong>landfill</strong> were applied for verification of the shearstrength parameters. The calculated minimum factor of safety, F min =0.994 (cross-section, on thenorthern slope of the <strong>landfill</strong>), was reached for the following shear strength parameters: ϕ’=21°and c’=15 kPa (Table 2). These parameters were accepted for the use of fresh wastes for designpurposes.Table 2. Geotechnical parameters of solid municipal wastes and the mineral capping layerCategory of wastes ρ [t/m 3 ] σ [kPa] φ [°] c [kPa] Testing methodsFresh municipal wastes 1.1 125 21 15Back-analysis of landslide,WST, failure testsOld municipal wastes 1.4 65 25 18Back-analysis of landslide,CPT and WST soundingsClay mineral cappingsystem2.1 40 15 12 Back-analysis, CPT sounding9
205119.620455.212013020276.51 2 01 3 020153.714021598.2150207184.214014012013012013021448.6150206127.4NLEGEND:21381.2- bench-markNo. of bench-marksettlm ent [cm ]- lateral displacem ent ( y)21381.2212100.013014013012020881.1- lateral displacem ent ( x)- resultant lateral displacem ent120211108.521042.020942.3150- layer0 10 20 cm- scale of lateral displacementFIG. 10 Landfill map with measured settlements and lateral displacements5. Water balanceWith the test results and meteorological data, the water balance the <strong>Lubna</strong> <strong>landfill</strong> has beenevaluated. The full water balance for the <strong>landfill</strong> was as follows (Fig. 11 ):P+W+H 1 +D p +K g =E t +E w + ∆R+Sp+H 2 +H 3where:P = precipitation,W = water form moisture of disposed wastes,H 1 = groundwater inflow,K g = capillary ascent,D p = surface water inflow,E t = evaporation from the vicinity,E w = evaporation from the open reservoirs,∆R = retention of the <strong>landfill</strong> body,S p = surface water outflow,H 2 = groundwater outflow,H 3 = excess leachate from drainage system (for utilisation in treatment plant).The small water volume becoming from biodegradation processes was lost in the equation.10
PE tW∆RS pE wH 3D pSandsH 2Cut-off wall barrierPeripheral drainageH 1ClaysFIG. 11 Scheme of water circulation in the <strong>Lubna</strong> <strong>landfill</strong>Since there was a surrounding vertical cut-off wall, it was assumed that:H 1 = 0,H 2 = 0,K g = 0,D p = 0,S p = 0.Thus the lowest water balance of the <strong>Lubna</strong> <strong>landfill</strong> becomes:P+W=E t +E w + ∆R+H 3The components of water balance of the income included precipitation and water from themoisture of disposed wastes. The water from the wastes (W) consists approximately 25% of thetotal wastes volume. The retention capacity (∆R) was determined at the level of 50% of the watercontent of wastes (from tests on the <strong>Lubna</strong> and Radiowo <strong>landfill</strong>s).It was assumed that the <strong>landfill</strong> surface obtained 21.64 ha, while the surface of open waterreservoirs was 0.28 ha. The components of the average annual water balance for the <strong>Lubna</strong>waste body are presented in Table 3.11
Table 3. Annual water balance for the for the <strong>Lubna</strong> <strong>landfill</strong> bodyNo. Specification Symbol Unit VolumeIncome1 Precipitation on 21.64 ha of the <strong>landfill</strong> area P m 3 1150502 Water from waste moisture W m 3 60426Outgoing3 Evaporation from the <strong>landfill</strong> surface (21.36 ha) E t m 3 1068004 Evaporation from the open water reservoirs (0.28 ha) E w m 3 16485 Effective retention capacity of the <strong>landfill</strong> body ∆R m 3 30213Excess of the water balance6 Leachate from the drainage system Η 3 m 3 36815The total income amounts to 175476 m 3 per year, whereas the evaporation from the <strong>landfill</strong>surface and water reservoirs, as the well as effective retention capacity equals to 138661 m 3 peraverage year. Comparison of these values shows that the excess of leachate for further utilisationis approximately 40.000 m 3 per year.Since 1996, the leachate has been transported by septic trucks to a sewage treatment plant inPiaseczno. In the nearest years, the preliminary purification of the leachate in the biologicaltreatment plant located close to the <strong>landfill</strong> is planned, followed by directing it by a pipe canal forfinal purification in a sewage treatment plant in Moczydłów.6. Slope stability analysis for reinforcement designIn 1995 a landslide occurred on the northern slope of the <strong>Lubna</strong> <strong>landfill</strong>. As a result, it becameobvious that reinforcements were needed to improve the stability of the slopes of the <strong>landfill</strong> toprevent other landslides. Therefore, shear strength parameters of solid municipal wastes weredetermined, i.e. waste density (ρ), angle of internal friction (φ) and cohesion intercept (c). Thedetermined parameters are presented in the section concerning investigations of wasteproperties. The shear strength parameters resulting from these tests were verified on the basis ofback-analysis of the landslide.The stability analysis results the <strong>Lubna</strong> <strong>landfill</strong>, according to classical and FEM methods, givefactors of safety in the scope of 1.05–1.15 for natural slopes, whereas for slopes with berms itsvalues increase to 13 from Bishop’s method (Fig. 12) and to 127 from FEM (Fig. 13).12
level [m a. s. l.]lenght [m]FIG. 12 Stability analysis of the slope of the <strong>Lubna</strong> <strong>landfill</strong> using Bishop’s method (GEO-SLOPEprogram)-60. -40. -20. 0. 20. 40. 60. 80. 100. 120.180. 160. 140. 120. 100. 80. 60.0 0.1 3.18e-0022 6.37e-0023 9.56e-0024 1.27e-0015 1.59e-0016 1.91e-0017 2.23e-0018 2.55e-0019 2.87e-001t-ref.=0. t = 0. Safety=1.27 DISPLACEMENT-ABSZ_SOIL v.4.23 PROJECT : lubna-2 DATE : 1999-01-25 h. 14:12:2210 3.18e-001FIG. 13 Stability analysis of the slope of the <strong>Lubna</strong> <strong>landfill</strong> using FEM (Z-SOIL program)13
7 Groundwater modellingRecently, a 3-D groundwater model of the <strong>landfill</strong> including its vicinity was created, using theGroundwater Modelling System (GMS numerical program). GMS contains graphic environmentusers for groundwater flow and pollutant transport simulations. The system consists of a graphicuser interface and the following analysis codes: MODFLOW, MT3DMS, RT3D, SEAM3D,MODPATH, SEEP2D, FEMWATER, NUFT and UTCHEM. For the modelling of the secondgroundwater level (drinking) in the subsoil of the <strong>Lubna</strong> <strong>landfill</strong>, the set of MODFLOW was used(Fig. 14). For the modelling of the first groundwater level, the set of FEMWATER was applied (Fig.15). The modelling of groundwater flow was performed for 2-D and 3-D conditions. Thetransportation of pollutants in the first groundwater level was calculated taking into account theabsorption and dispersion phenomenon. The modelling results were compared to local monitoringobservations in piezometers.FIG. 14 Groundwater flow modelling in the second layer using MODFLOW numerical programFIG. 15 Groundwater flow modelling in the second layer using FEMWATER numerical program14
8 Remedial works8.1 Creation of <strong>landfill</strong> embankment with slope reinforcementsEspecially when the slopes are high and of considerable inclination, the construction of berms isthe most effective solution for slope stability reinforcement, however it requires area in the closevicinity of the <strong>landfill</strong>. Three technological roads are created on the <strong>landfill</strong> slopes at the levels of“130”, “140” and 160 m a. s. l. The crest of the <strong>landfill</strong> was designed at the level of 172 m a. s. l., i.e. approximately 60 m high (Fig. 16). By moderating and reinforcing the slope, the berm enablesthe achievement of additional capacity for waste disposal. The surface of the berm was made ofcohesive soil and compost. The construction of berms enables reaching additional capacityvolume for waste disposal.FIG.16 Designed <strong>Lubna</strong> <strong>landfill</strong> surface8.2 Cut-off wallThe bentonite cut-off wall barrier was constructed to protect the first aquifer against contaminationcoming from the <strong>landfill</strong> (Fig. 17). The permeability coefficient for the barrier wall is below 10 -9 m/s(resulting from the in situ BAT and laboratory tests). The initial hydraulic gradient for the bentonitewall is ca. i 0 =50, wheras the existing gradients in the field are i=2-3. In fact, the constructed cut-offwall is practically impermeable. The depth of the barrier wall was from 5.5 to 17 m, depending onthe subsoil conditions. Additional protection against migration of pollution is assured by directingthe flow from the vicinity to the leachate drainage system (Fig. 18). This would also protect thebentonite material against degradation caused by the leachate. Combination of a cut-off wall anda peripheral drainage system is safe and easy to build for the old sanitary <strong>landfill</strong> remediation. It isthe most effective and economic solution, if only applie on large areas.15
FIG. 17 Construction of cut–off wall along the border of the <strong>landfill</strong>FIG. 18 Groundwater protection system against leachate on the <strong>Lubna</strong> <strong>landfill</strong>– cross-section scheme of the protection system16
8.2 Leachate drainage systemIn 1998, an encircling drainage system around the <strong>landfill</strong> was constructed (Fig. 19). In addition,“finger” pipe drains were installed in the bottom of the berms to direct the leachate from the <strong>landfill</strong>to the encircling drainage (Fig. 20). Additionally, the drainage system was extended for rain waterfrom the technological roads and slopes (Fig. 4).FIG. 19 Construction of the peripheral leachate drainageFIG. 20 Construction of “finger” pipe drainsThe drainage cover was made of graded permeable soils to provide protection against clogging,using a filter construction. After about one year of exploitation of the drainage system, the upperfilter layer appeared to be almost completely clogged, which caused stagnation of the peripheraldrainage on the top. Clogging occurred in the upper 03 m, where the d 10 diameter decreased from0.3 to 0.03 mm (Fig. 21). The filter clogging results from accumulation of surface runoff from the<strong>landfill</strong> slopes, both from rain and leachate sources. A periodic drainage conservation scheme hasbeen designed. Then, the upper 0.3-0.5 m of the filer layer was removed and replaced. Theorganic matter content in clogged filter material was 2-5 %. This results from organic pollutantsleaching from the <strong>landfill</strong> and erosion of the slope surface, which was covered by compost. Afterreplacement of the upper filter material, the drainage system regained its full functionality.17
FIG. 21 Mineral filter layers used for peripheral and “finger” pipe drainages the <strong>Lubna</strong> <strong>landfill</strong>The terrain surrounding the <strong>landfill</strong> has a low gradient. Therefore a number of control sinks (every25-50 m) along the peripheral drain along with two pumping stations have been designed toprotect the drainage system against silting up. The collected leachate flows to the water cleaningplant in the south-eastern corner of the <strong>landfill</strong> and finally to the surface streams.Additional drainage was designed on the slopes and along technological roads. The open waterreservoirs were designed for the rain water flow from the <strong>landfill</strong> slopes (Fig. 4).8.3 Mineral capping systemTaking into account the high slope inclination, the constructed degassing system and introductionof plants on the <strong>landfill</strong> surface, the former planned capping system with a geomembrane wasreplaced with clay mineral and compost layers. The capping system of the <strong>landfill</strong> surface wasconstructed successively with the increase, of the <strong>landfill</strong> height.The compacted clay sub-layers of the mineral capping have the thickness of 03 m. The minimaldegree of compaction was I s = 0.92. A few clay layers were created to protect embankment forwaste layer disposal (Fig. 22). The scheme of the mineral capping system on the <strong>landfill</strong> slopes ispresented in Fig. 23.18
FIG. 22 Construction of the clay capping systemFIG. 23 Construction of berms and the clay capping system of the <strong>Lubna</strong> <strong>landfill</strong>8.5 Ecological remediation with plantsThe upper layer of the capping system was made of compost produced from municipal wastes.The results received from laboratory tests of the compost showed that it is a good product forfertilising plants. Ecological remedial works with plants on the <strong>Lubna</strong> <strong>landfill</strong> have been started afew years ago. The design of the remedial works with plants proposed the growth of more thanthirty plant species, including: trees, shrubs, and perennial plants on the <strong>landfill</strong> surface. The plantspecies were selected depending on the water content of clay and compost forming the cappingsystem (Fig. 24). The merge of technical and biological solutions gives good results in theremediation of old <strong>landfill</strong>s (Fig. 25).19
FIG. 24 Zones with different moisture of the clay capping systembaFIG. 25 Forest area close to the northern border of the <strong>Lubna</strong> <strong>landfill</strong>:a – before remediation (1983), b – during remediation (2001)20
8.6 Degassing systemTrial gas pumpings were performed in order to design the <strong>landfill</strong> degassing system (Fig. 26). Theperformed tests gave the content of biogas. The main components of biogas are: methane (ca.60%), carbon dioxide (ca. 35%), oxide (ca.3%), carbon monoxide, sulphured hydrogen andammonia. The tests proved that the main biogas production would take place in the next 20 years.According to this prediction, its volume will amount to 1- 6 mln m 3 per year.The degassing system consists of:- 80 biogas drilled wells (Fig. 27),- 2 gas collection containers (Fig. 28),- 10 km gas pipe collector to the Góra Kalwaria town,- electricity aggregate unit.At present, 58 biogas wells are linked to the system. The remaining wells will be drilled in the nextyear.FIG. 26 Trial gas pumping on the <strong>landfill</strong>FIG. 27 Construction of gas well on the <strong>landfill</strong>FIG. 28 Biogas collection container and the top cover of the biogas well21
9 Water monitoring systemThe local monitoring system for water quality around the <strong>landfill</strong> consists of (Fig. 3):- 17 observation points in the first groundwater layer (shallow piezometric wells),- 6 observation points in the second (drinking) water-bearing layer (deep piezometric wells),- 7 farm open wells selected in the villages of <strong>Lubna</strong>, Baniocha and Szymanów,- 7 sampling points situated at surface water courses (ditches),- 1 sampling point of ‘raw’ leachates (from peripheral drainage well, before the leachatetreatment plant).This network enables the proper assessment and estimation of water quality in the vicinity of the<strong>Lubna</strong> <strong>landfill</strong>. Analyses of surface water and groundwater located in the surroundings of the<strong>landfill</strong> have been carried out since 1994, whereas chemical analyses of ‘raw’ leachates from theperipheral drainage - since 1998. Measurements of the water level in piezometric wells areconducted every month and are used to define the directions of groundwater flow (Fig. 29) andmigration of pollutants. Groundwater samples were collected with special equipment (Fig. 30).The water quality is analysed twice a year. Annual repports are prepared for the environmentalprotection authority and for the local population.FIG. 29 Flow directions in the 1 st groundwater level in the surroundings of the <strong>Lubna</strong> <strong>landfill</strong>22
FIG. 30 Collection of groundwater samples with the use of MP1 pumping equipmentChemical and physical analyses of the groundwater have been preformed since 1994 (the ownerof the <strong>landfill</strong> is obliged to reclaim it). The results provide information on the improvement of waterquality in the vicinity of the <strong>landfill</strong>. The introduction of a vertical barrier has positively changed thebasic parameters measured in the first groundwater layer (Tab. 4), especially in the surface water(Tab. 5). At the moment, chloride and sulphate concentrations as well as the dissolved mattercontent meet the requirement of legal standards. An example of nitrate nitrogen concentration inthe 1 st groundwater level in the surroundings of the <strong>Lubna</strong> <strong>landfill</strong> is shown in Fig. 31. Therequirements for the nitrogen concentration, however, have not been met yet, although it is stilldecreasing.Groundwater in the second (drinking) water layer was not threatened by pollutants originatingfrom the <strong>landfill</strong>, therefore the measurement results had not been changed since many years(Tab. 6). The reason was that the water is perfectly isolated by thick layers consisting of poorlypermeable clays (Fig. 6).FIG. 31 Concentration of nitrate nitrogen in the 1 st groundwater level in the surroundings of the <strong>Lubna</strong> <strong>landfill</strong>(tested in June 2002)23
Table 4. Influence of a vertical barrier on the quality of the first groundwater layer in years 1997-2000Date Groundwater quality before installation of vertical barrier (24.11.1997)No. of piezometerDissolvedsubstance[mg/l]COD Cr[mg O 2/l]Ammonia nitrogen[mg N NH4/l]Chlorides[mgCl - /l]Sulphates[mg SO 4 -2 /l]1 (1a) 890 430 0.6 218 1002 (2a) 5043 1125 61.1 1749 1533 14 030 6052 589 4257 853a 1040 827 35.4 218 1744 830 802 0.4 12 1204a 394 428 0.1 23 1205 (5a) 598 66 14 86 1247 (7a) 349 10 0.5 34 478 567 59 0.1 19 1379 (9a) 315 12 11 23 8610 386 29 0.1 19 7612 418 21 0.7 28 158III water quality class 2000 - 1.5 600 500acc. PIOŚ, 1995Closure of the vertical bentonite barrier (09.06.1998)Date Groundwater quality after installation of vertical barrier (09.11.2000)No. of piezometerDissolvedsubstance[mg/l]COD Cr[mgO 2 /l]Ammonia nitrogen[mg N NH4 /l]Chlorides[mgCl - /l]Sulphates[mg SO 4 -2 /l]1 (1a) 224 30 0.2 23 722 (2a) 2380 338 0.5 368 1103 12220 4810 397 3580 483a 998 380 8.5 88 1574 784 330 1.1 12 1814a 371 51 2.4 32 595 (5a) 750 60.3 0.9 100 2377 (7a) 420 26 0.4 43 588 566 207 1.3 84 1179 (9a) 1094 55 0.4 67 214.010 436 46 1.1 34 4212 810 40 0.1 93 234III water quality classacc. PIOŚ, 19952000 - 1.5 600 50024
Table 5. Influence of vertical bentonite barrier on the quality of surface water in the vicinityof the <strong>Lubna</strong> <strong>landfill</strong> in sampling point No.3 (point at ditch No. 2 – see Fig.3)No. Pollution indicator UnitConcentration of pollutantsPermiss. valuesSampled in01.06.1998Sampled in04.07.2000Sampled in06.12.2001acc. to MinistryDecree1 Colour -- black light yellow Natural -2 Turbidity -- very turbid clear Clear -3 pH -- 8.4 7.8 7.8 6.0 - 9.04 Electrolytic µS/cm 21 560 1 910 1 240 12005 Dissolved matters mg/l 17 876 1 250 990 12006 Solid residue mg/l 18 620 1 268 1 036 -7 Total suspended mg/l 1 425 29 27 508 BOD 5 mgO 2/l 10 870 50 40 129 COD Cr mgO 2 /l 17 541 169 78.8 10010 Ammonium nitrogen mgN NH4 /l 290 1.8 1.9 6.011 Nitrite nitrogen mgN NO2/l 0.20 0.004 0.06 0.0612 Nitrate nitrogen mgN NO3 /l 30.0 0.1 0.6 15.013 Nitrogen of Kjeldahl m. mgN/l 1 601 44.0 11.6 -14 Chlorides mgCl - /l 4 139 365 260 40015 Sulphates2-mgSO 4 103 165 120 25016 Sulphides mgS -2 /l 3.2 0.03
Table 6. Results of quality tests of the ground water originating from the second (drinking) layer in thevicinity of the <strong>Lubna</strong> <strong>landfill</strong> (measurements from 12.12.2001)NoIndicator of waterqualityUnitLevel of pollutants in deep piezometers andwellAcc. to Decree ofHealth Minister from04.09.2000P-21 P-1 P-2 P-8 S-4461 Colour -- Natural Natural Natural Natural Natural To 15 mg Pt/l2 Turbidity -- Clear Clear Clear Clear Clear To 1 mg SiO 2/l3 pH -- 7.2 7.5 7.3 7.3 7.3 6.5-9.54 Electrolytic µS/cm 420 430 430 670 390 25005 Total dissolved matters mg/l 285 276 273 451 252 -6 Solid residue mg/l 292 294 284 468 260 -7 Total suspended mg/l 8 10 9 7 11 -8 BOD 5 mgO 2 /l
10 Future viewIt is assumed that the <strong>Lubna</strong> <strong>landfill</strong> will be closed in the beginning of 2004. Remedial works (i.e.finishing the mineral capping system, growing plants, extending the degassing system and finalsolution of leachate utilisation) are planned to be performed during the following years. The <strong>landfill</strong>area will be monitored within the next 15 years. The applied technical and biological solutionsshould neutralise pollutants coming from the <strong>landfill</strong>.In the future a change of the assignment of the <strong>landfill</strong> area for the recreation purposes is planned.Companies involved:Department of Geotechnical Engineering, Warsaw Agricultural University - SGGW,GEOTEKO Geotechnical Consultants Ltd., Warsaw,HEDESELSKABET Environment and Energy A/S, Denmark,Municipal Government Office for the Capital City of Warsaw (Laboratory tests),Municipal Sanitation Company – MPO, Warsaw,State Committee for Scientific Research – KBN.27