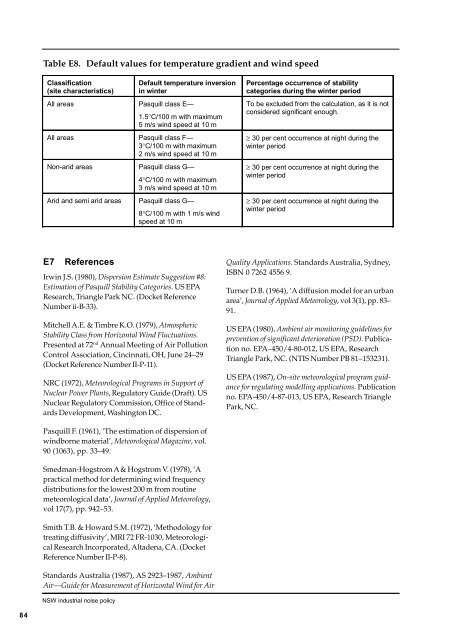
Table E8. Default values for temperature gradient and wind speedClassification(site characteristics)Default temperature inversionin winterAll areas Pasquill class E—1.5°C/100 m with maximum5 m/s wind speed at 10 mAll areas Pasquill class F—3°C/100 m with maximum2 m/s wind speed at 10 mNon-arid areas Pasquill class G—4°C/100 m with maximum3 m/s wind speed at 10 mArid and semi arid areas Pasquill class G—8°C/100 m with 1 m/s windspeed at 10 mPercentage occurrence of stabilitycategories during the winter periodTo be excluded from the calculation, as it is notconsidered significant enough.≥ 30 per cent occurrence at night during thewinter period≥ 30 per cent occurrence at night during thewinter period≥ 30 per cent occurrence at night during thewinter periodE7ReferencesIrwin J.S. (1980), Dispersion Estimate Suggestion #8:Estimation of Pasquill Stability Categories. US EPAResearch, Triangle Park NC. (Docket ReferenceNumber ii-B-33).Mitchell A.E. & Timbre K.O. (1979), AtmosphericStability Class from Horizontal Wind Fluctuations.Presented at 72 nd Annual Meeting of Air PollutionControl Association, Cincinnati, OH, June 24–29(Docket Reference Number II-P-11).NRC (1972), Meteorological Programs in Support ofNuclear Power Plants, Regulatory Guide (Draft). USNuclear Regulatory Commission, Office of StandardsDevelopment, Washington DC.Quality Applications. Standards Australia, Sydney,ISBN 0 7262 4556 9.Turner D.B. (1964), ‘A diffusion model for an urbanarea’, Journal of Applied Meteorology, vol 3(1), pp. 83–91.US EPA (1980), Ambient air monitoring guidelines forprevention of significant deterioration (PSD). Publicationno. EPA–450/4-80-012, US EPA, ResearchTriangle Park, NC. (NTIS Number PB 81–153231).US EPA (1987), On-site meteorological program guidancefor regulating modelling applications. Publicationno. EPA-450/4-87-013, US EPA, Research TrianglePark, NC.Pasquill F. (1961), ‘The estimation of dispersion ofwindborne material’, Meteorological Magazine, vol.90 (1063), pp. 33–49.Smedman-Hogstrom A & Hogstrom V. (1978), ‘Apractical method for determining wind frequencydistributions for the lowest 200 m from routinemeteorological data’, Journal of Applied Meteorology,vol 17(7), pp. 942–53.Smith T.B. & Howard S.M. (1972), ‘Methodology fortreating diffusivity’, MRI 72 FR-1030, MeteorologicalResearch Incorporated, Altadena, CA. (DocketReference Number II-P-8).Standards Australia (1987), AS 2923–1987, AmbientAir—Guide for Measurement of Horizontal Wind for AirNSW industrial noise policy84
Appendix FPercentage occurrence of F-classtemperature inversions in winter in theHunter Valley, NSWThe Hunter Valley is a major centre for miningdevelopment, and elevated noise levels from temperatureinversions have been reported as an issuefor this area. For these reasons, the Hunter Valleyarea was used as a case study in evaluating thelikely presence of F-class temperature inversions.Table F1 presents an estimate of the occurrence of F-class temperature inversions in the Hunter Valleyarea. The table does not cover the incidence of G-class inversions, as these are not the predominanttype of inversion in the Hunter Valley region.This table may be used as a guide to indicate wheresignificant inversions may occur. It would bereasonable to assume that the higher the percentageoccurrence of F-class stability at a given site, themore likely it will be that noise-enhancement issuesarise. It is recommended that locations that areapproaching a 30 per cent occurrence level as wellas those locations that either equal to or exceed the30 per cent level be considered when assessing theeffects of temperature inversions on noise levels.In the table, atmospheric stability has been estimatedusing procedures developed by atmosphericscientists and formalised by the US EPA over anumber of years. For a given set of parameters, forexample wind speed, standard deviation of winddirection fluctuations, solar elevation and aerodynamicsurface roughness, there will be only onevalid stability produced for the procedure. In thecurrent application, the derived value of stabilityclass has been used to infer a temperature lapse rate.In compiling this table, the Hunter Valley area wasdivided into 2 x 2 km square grid cells. The gridreferences used in the table are the standard IntegratedSurvey Grid (ISG) used on all topographicalmaps. Locations for each grid position can bedetermined by referring the grid reference to theappropriate topographical map.class stability, which is associated with temperature-inversionconditions. The meteorological dataused was that for the period 6 pm to 7 am for everywinter night; that is, every night during the monthsof June, July and August.The stability derived at each meteorological stationhas been used to interpolate stabilities at the grid ofreceptors. In the interpolation, the only factors thatare used are the distance of the meteorologicalstations from each grid point (this determines theweighting that each station has at a given gridpoint) and the difference in elevation between themeteorological stations and the grid points (this isused to adjust the value of wind speed when it isinterpolated to the grid point).Although there are sound theoretical grounds forthe relationships assumed between stability andtemperature lapse rate, the relationship is notsimple. Further, atmospheric temperature profilescan be very complex and cannot always be representedby a single figure specifying the gradientover a 100-m height interval. For example, a gradientof 3 o C/100 m could occur as a result of a smoothincrease in temperature over the 100-m heightinterval, or as a jump in temperature of 3 o C over a10-m interval and no change over the remaining95 m. The effects on noise enhancement would bequite different.The results contained in the table are based on thebest information available. However, use care inapplying the tabulated values to specific situations,as specific site variables will influence theoccurrence of inversions for a specific site. Whilethe table provides a useful guide, site specific dataare preferred where significant inversion effectsare suspected.Data from five meteorological stations in the Hunterregion (located at Newcastle, Mount Thorley,Drayton, Mount Pleasant and Mount Arthur) wereused to determine the occurrence of atmospheric F-NSW industrial noise policy85