Suggested Answers of BT2 Revision Package - ASKnLearn
Suggested Answers of BT2 Revision Package - ASKnLearn
Suggested Answers of BT2 Revision Package - ASKnLearn
- No tags were found...

You also want an ePaper? Increase the reach of your titles
YUMPU automatically turns print PDFs into web optimized ePapers that Google loves.
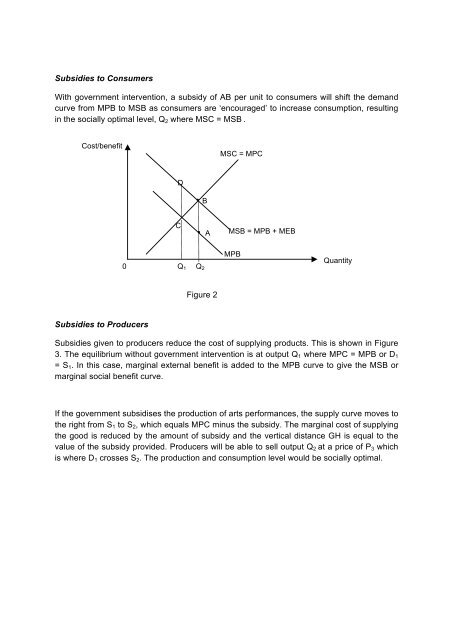
Subsidies to ConsumersWith government intervention, a subsidy <strong>of</strong> AB per unit to consumers will shift the demandcurve from MPB to MSB as consumers are ‘encouraged’ to increase consumption, resultingin the socially optimal level, Q 2 where MSC = MSB .Cost/benefitMSC = MPCD• BC• AMSB = MPB + MEB0Q 1 Q 2MPBQuantityFigure 2Subsidies to ProducersSubsidies given to producers reduce the cost <strong>of</strong> supplying products. This is shown in Figure3. The equilibrium without government intervention is at output Q 1 where MPC = MPB or D 1= S 1 . In this case, marginal external benefit is added to the MPB curve to give the MSB ormarginal social benefit curve.If the government subsidises the production <strong>of</strong> arts performances, the supply curve moves tothe right from S 1 to S 2 , which equals MPC minus the subsidy. The marginal cost <strong>of</strong> supplyingthe good is reduced by the amount <strong>of</strong> subsidy and the vertical distance GH is equal to thevalue <strong>of</strong> the subsidy provided. Producers will be able to sell output Q 2 at a price <strong>of</strong> P 3 whichis where D 1 crosses S 2 . The production and consumption level would be socially optimal.