

Download Complete Issue (4740kb) - Academic Journals
Download Complete Issue (4740kb) - Academic Journals
Download Complete Issue (4740kb) - Academic Journals

You also want an ePaper? Increase the reach of your titles
YUMPU automatically turns print PDFs into web optimized ePapers that Google loves.
4438 J. Med. Plants Res.<br />
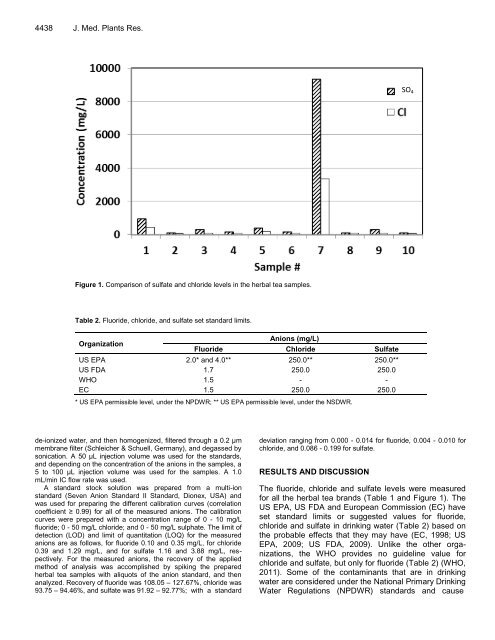
Figure 1. Comparison of sulfate and chloride levels in the herbal tea samples.<br />
Table 2. Fluoride, chloride, and sulfate set standard limits.<br />
Organization<br />
Anions (mg/L)<br />
Fluoride Chloride Sulfate<br />
US EPA 2.0* and 4.0** 250.0** 250.0**<br />
US FDA 1.7 250.0 250.0<br />
WHO 1.5 - -<br />
EC 1.5 250.0 250.0<br />
* US EPA permissible level, under the NPDWR; ** US EPA permissible level, under the NSDWR.<br />
de-ionized water, and then homogenized, filtered through a 0.2 μm<br />
membrane filter (Schleicher & Schuell, Germany), and degassed by<br />
sonication. A 50 μL injection volume was used for the standards,<br />
and depending on the concentration of the anions in the samples, a<br />
5 to 100 μL injection volume was used for the samples. A 1.0<br />
mL/min IC flow rate was used.<br />
A standard stock solution was prepared from a multi-ion<br />
standard (Seven Anion Standard II Standard, Dionex, USA) and<br />
was used for preparing the different calibration curves (correlation<br />
coefficient ≥ 0.99) for all of the measured anions. The calibration<br />
curves were prepared with a concentration range of 0 - 10 mg/L<br />
fluoride; 0 - 50 mg/L chloride; and 0 - 50 mg/L sulphate. The limit of<br />
detection (LOD) and limit of quantitation (LOQ) for the measured<br />
anions are as follows, for fluoride 0.10 and 0.35 mg/L, for chloride<br />
0.39 and 1.29 mg/L, and for sulfate 1.16 and 3.88 mg/L, respectively.<br />
For the measured anions, the recovery of the applied<br />
method of analysis was accomplished by spiking the prepared<br />
herbal tea samples with aliquots of the anion standard, and then<br />
analyzed. Recovery of fluoride was 108.05 – 127.67%, chloride was<br />
93.75 – 94.46%, and sulfate was 91.92 – 92.77%; with a standard<br />
deviation ranging from 0.000 - 0.014 for fluoride, 0.004 - 0.010 for<br />
chloride, and 0.086 - 0.199 for sulfate.<br />
RESULTS AND DISCUSSION<br />
SO4<br />
The fluoride, chloride and sulfate levels were measured<br />
for all the herbal tea brands (Table 1 and Figure 1). The<br />
US EPA, US FDA and European Commission (EC) have<br />
set standard limits or suggested values for fluoride,<br />
chloride and sulfate in drinking water (Table 2) based on<br />
the probable effects that they may have (EC, 1998; US<br />
EPA, 2009; US FDA, 2009). Unlike the other organizations,<br />
the WHO provides no guideline value for<br />
chloride and sulfate, but only for fluoride (Table 2) (WHO,<br />
2011). Some of the contaminants that are in drinking<br />
water are considered under the National Primary Drinking<br />
Water Regulations (NPDWR) standards and cause


