TERENA COMPENDIUM - Géant
TERENA COMPENDIUM - Géant
TERENA COMPENDIUM - Géant

You also want an ePaper? Increase the reach of your titles
YUMPU automatically turns print PDFs into web optimized ePapers that Google loves.
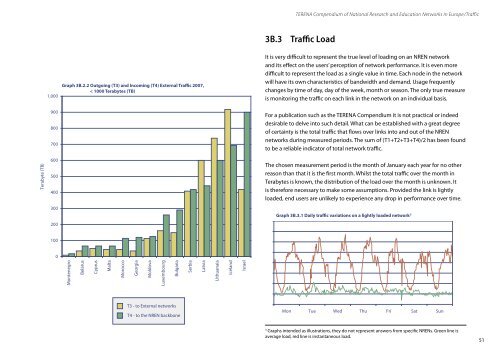
<strong>TERENA</strong> Compendium of National Research and Education Networks In Europe /Traffic3B.3 Traffic LoadGraph 3B.2.2 Outgoing (T3) and Incoming (T4) External Traffic 2007,< 1000 Terabytes (TB)It is very difficult to represent the true level of loading on an NREN networkand its effect on the users’ perception of network performance. It is even moredifficult to represent the load as a single value in time. Each node in the networkwill have its own characteristics of bandwidth and demand. Usage frequentlychanges by time of day, day of the week, month or season. The only true measureis monitoring the traffic on each link in the network on an individual basis.For a publication such as the <strong>TERENA</strong> Compendium it is not practical or indeeddesirable to delve into such detail. What can be established with a great degreeof certainty is the total traffic that flows over links into and out of the NRENnetworks during measured periods. The sum of (T1+T2+T3+T4)/2 has been foundto be a reliable indicator of total network traffic.The chosen measurement period is the month of January each year for no otherreason than that it is the first month. Whilst the total traffic over the month inTerabytes is known, the distribution of the load over the month is unknown. Itis therefore necessary to make some assumptions. Provided the link is lightlyloaded, end users are unlikely to experience any drop in performance over time.Graph 3B.3.1 Daily traffic variations on a lightly loaded network 3 3Graphs intended as illustrations, they do not represent answers from specific NRENs. Green line isaverage load, red line is instantaneous load.51