TERENA COMPENDIUM - Géant
TERENA COMPENDIUM - Géant
TERENA COMPENDIUM - Géant

Create successful ePaper yourself
Turn your PDF publications into a flip-book with our unique Google optimized e-Paper software.
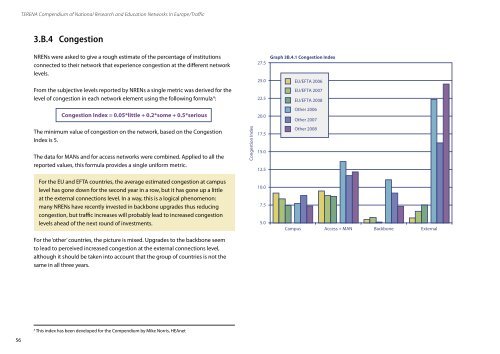
<strong>TERENA</strong> Compendium of National Research and Education Networks In Europe /Traffic3.B.4 CongestionNRENs were asked to give a rough estimate of the percentage of institutionsconnected to their network that experience congestion at the different networklevels.From the subjective levels reported by NRENs a single metric was derived for thelevel of congestion in each network element using the following formula 4 :Graph 3B.4.1 Congestion IndexCongestion Index = 0.05*little + 0.2*some + 0.5*seriousThe minimum value of congestion on the network, based on the CongestionIndex is 5.The data for MANs and for access networks were combined. Applied to all thereported values, this formula provides a single uniform metric.For the EU and EFTA countries, the average estimated congestion at campuslevel has gone down for the second year in a row, but it has gone up a littleat the external connections level. In a way, this is a logical phenomenon:many NRENs have recently invested in backbone upgrades thus reducingcongestion, but traffic increases will probably lead to increased congestionlevels ahead of the next round of investments. For the ‘other’ countries, the picture is mixed. Upgrades to the backbone seemto lead to perceived increased congestion at the external connections level,although it should be taken into account that the group of countries is not thesame in all three years.4This index has been developed for the Compendium by Mike Norris, HEAnet56