A Strategic Assessment of the Children's Services Industry
A Strategic Assessment of the Children's Services Industry
A Strategic Assessment of the Children's Services Industry
- No tags were found...

Create successful ePaper yourself
Turn your PDF publications into a flip-book with our unique Google optimized e-Paper software.
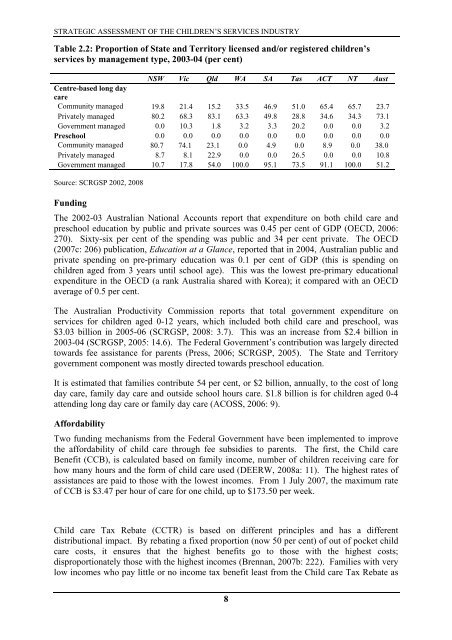
STRATEGIC ASSESSMENT OF THE CHILDREN’S SERVICES INDUSTRYTable 2.2: Proportion <strong>of</strong> State and Territory licensed and/or registered children’sservices by management type, 2003-04 (per cent)NSW Vic Qld WA SA Tas ACT NT AustCentre-based long daycareCommunity managed 19.8 21.4 15.2 33.5 46.9 51.0 65.4 65.7 23.7Privately managed 80.2 68.3 83.1 63.3 49.8 28.8 34.6 34.3 73.1Government managed 0.0 10.3 1.8 3.2 3.3 20.2 0.0 0.0 3.2Preschool 0.0 0.0 0.0 0.0 0.0 0.0 0.0 0.0 0.0Community managed 80.7 74.1 23.1 0.0 4.9 0.0 8.9 0.0 38.0Privately managed 8.7 8.1 22.9 0.0 0.0 26.5 0.0 0.0 10.8Government managed 10.7 17.8 54.0 100.0 95.1 73.5 91.1 100.0 51.2Source: SCRGSP 2002, 2008FundingThe 2002-03 Australian National Accounts report that expenditure on both child care andpreschool education by public and private sources was 0.45 per cent <strong>of</strong> GDP (OECD, 2006:270). Sixty-six per cent <strong>of</strong> <strong>the</strong> spending was public and 34 per cent private. The OECD(2007c: 206) publication, Education at a Glance, reported that in 2004, Australian public andprivate spending on pre-primary education was 0.1 per cent <strong>of</strong> GDP (this is spending onchildren aged from 3 years until school age). This was <strong>the</strong> lowest pre-primary educationalexpenditure in <strong>the</strong> OECD (a rank Australia shared with Korea); it compared with an OECDaverage <strong>of</strong> 0.5 per cent.The Australian Productivity Commission reports that total government expenditure onservices for children aged 0-12 years, which included both child care and preschool, was$3.03 billion in 2005-06 (SCRGSP, 2008: 3.7). This was an increase from $2.4 billion in2003-04 (SCRGSP, 2005: 14.6). The Federal Government’s contribution was largely directedtowards fee assistance for parents (Press, 2006; SCRGSP, 2005). The State and Territorygovernment component was mostly directed towards preschool education.It is estimated that families contribute 54 per cent, or $2 billion, annually, to <strong>the</strong> cost <strong>of</strong> longday care, family day care and outside school hours care. $1.8 billion is for children aged 0-4attending long day care or family day care (ACOSS, 2006: 9).AffordabilityTwo funding mechanisms from <strong>the</strong> Federal Government have been implemented to improve<strong>the</strong> affordability <strong>of</strong> child care through fee subsidies to parents. The first, <strong>the</strong> Child careBenefit (CCB), is calculated based on family income, number <strong>of</strong> children receiving care forhow many hours and <strong>the</strong> form <strong>of</strong> child care used (DEERW, 2008a: 11). The highest rates <strong>of</strong>assistances are paid to those with <strong>the</strong> lowest incomes. From 1 July 2007, <strong>the</strong> maximum rate<strong>of</strong> CCB is $3.47 per hour <strong>of</strong> care for one child, up to $173.50 per week.Child care Tax Rebate (CCTR) is based on different principles and has a differentdistributional impact. By rebating a fixed proportion (now 50 per cent) <strong>of</strong> out <strong>of</strong> pocket childcare costs, it ensures that <strong>the</strong> highest benefits go to those with <strong>the</strong> highest costs;disproportionately those with <strong>the</strong> highest incomes (Brennan, 2007b: 222). Families with verylow incomes who pay little or no income tax benefit least from <strong>the</strong> Child care Tax Rebate as8