A Strategic Assessment of the Children's Services Industry
A Strategic Assessment of the Children's Services Industry
A Strategic Assessment of the Children's Services Industry
- No tags were found...

You also want an ePaper? Increase the reach of your titles
YUMPU automatically turns print PDFs into web optimized ePapers that Google loves.
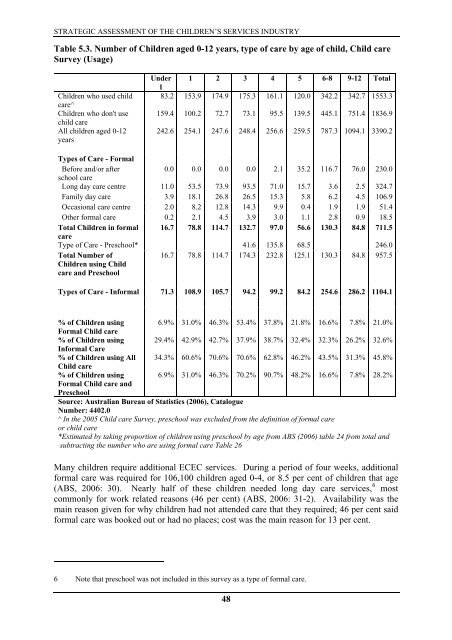
STRATEGIC ASSESSMENT OF THE CHILDREN’S SERVICES INDUSTRYTable 5.3. Number <strong>of</strong> Children aged 0-12 years, type <strong>of</strong> care by age <strong>of</strong> child, Child careSurvey (Usage)Children who used childcare^Children who don't usechild careAll children aged 0-12yearsUnder11 2 3 4 5 6-8 9-12 Total83.2 153.9 174.9 175.3 161.1 120.0 342.2 342.7 1553.3159.4 100.2 72.7 73.1 95.5 139.5 445.1 751.4 1836.9242.6 254.1 247.6 248.4 256.6 259.5 787.3 1094.1 3390.2Types <strong>of</strong> Care - FormalBefore and/or after0.0 0.0 0.0 0.0 2.1 35.2 116.7 76.0 230.0school careLong day care centre 11.0 53.5 73.9 93.5 71.0 15.7 3.6 2.5 324.7Family day care 3.9 18.1 26.8 26.5 15.3 5.8 6.2 4.5 106.9Occasional care centre 2.0 8.2 12.8 14.3 9.9 0.4 1.9 1.9 51.4O<strong>the</strong>r formal care 0.2 2.1 4.5 3.9 3.0 1.1 2.8 0.9 18.5Total Children in formal 16.7 78.8 114.7 132.7 97.0 56.6 130.3 84.8 711.5careType <strong>of</strong> Care - Preschool* 41.6 135.8 68.5 246.0Total Number <strong>of</strong>Children using Childcare and Preschool16.7 78.8 114.7 174.3 232.8 125.1 130.3 84.8 957.5Types <strong>of</strong> Care - Informal 71.3 108.9 105.7 94.2 99.2 84.2 254.6 286.2 1104.1% <strong>of</strong> Children using 6.9% 31.0% 46.3% 53.4% 37.8% 21.8% 16.6% 7.8% 21.0%Formal Child care% <strong>of</strong> Children using 29.4% 42.9% 42.7% 37.9% 38.7% 32.4% 32.3% 26.2% 32.6%Informal Care% <strong>of</strong> Children using All 34.3% 60.6% 70.6% 70.6% 62.8% 46.2% 43.5% 31.3% 45.8%Child care% <strong>of</strong> Children using 6.9% 31.0% 46.3% 70.2% 90.7% 48.2% 16.6% 7.8% 28.2%Formal Child care andPreschoolSource: Australian Bureau <strong>of</strong> Statistics (2006), CatalogueNumber: 4402.0^ In <strong>the</strong> 2005 Child care Survey, preschool was excluded from <strong>the</strong> definition <strong>of</strong> formal careor child care*Estimated by taking proportion <strong>of</strong> children using preschool by age from ABS (2006) table 24 from total andsubtracting <strong>the</strong> number who are using formal care Table 26Many children require additional ECEC services. During a period <strong>of</strong> four weeks, additionalformal care was required for 106,100 children aged 0-4, or 8.5 per cent <strong>of</strong> children that age(ABS, 2006: 30). Nearly half <strong>of</strong> <strong>the</strong>se children needed long day care services, 6 mostcommonly for work related reasons (46 per cent) (ABS, 2006: 31-2). Availability was <strong>the</strong>main reason given for why children had not attended care that <strong>the</strong>y required; 46 per cent saidformal care was booked out or had no places; cost was <strong>the</strong> main reason for 13 per cent.6 Note that preschool was not included in this survey as a type <strong>of</strong> formal care.48