Understanding the Software Options
Understanding the Software Options
Understanding the Software Options

You also want an ePaper? Increase the reach of your titles
YUMPU automatically turns print PDFs into web optimized ePapers that Google loves.
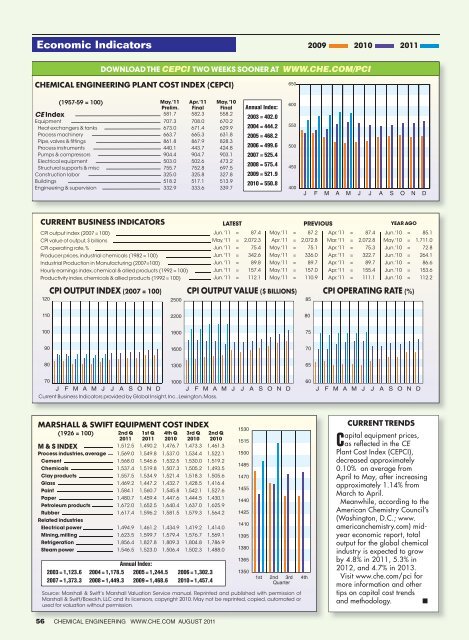
Economic Indicators<br />
CURRENT BUSINESS INDICATORS LATEST PREVIOUS YEAR AGO<br />
CPI output index (2007 = 100) Jun. '11 = 87.4 May. '11 = 87.2 Apr. '11 = 87.4 Jun. '10 = 85.1<br />
CPI value of output, $ billions May. '11 = 2,072.3 Apr. '11 = 2,072.8 Mar. '11 = 2,072.8 May. '10 = 1,711.0<br />
CPI operating rate, % Jun. '11 = 75.4 May. '11 = 75.1 Apr. '11 = 75.3 Jun. '10 = 72.8<br />
Producer prices, industrial chemicals (1982 = 100) Jun. '11 = 342.6 May. '11 = 336.0 Apr. '11 = 322.7 Jun. '10 = 264.1<br />
Industrial Production in Manufacturing (2007=100) Jun. '11 = 89.8 May. '11 = 89.7 Apr. '11 = 89.7 Jun. '10 = 86.6<br />
Hourly earnings index, chemical & allied products (1992 = 100) Jun. '11 = 157.4 May. '11 = 157.0 Apr. '11 = 155.4 Jun. '10 = 153.6<br />
Productivity index, chemicals & allied products (1992 = 100) Jun. '11 = 112.1 May. '11 = 110.9 Apr. '11 = 111.1 Jun. '10 = 112.2<br />
120<br />
110<br />
100<br />
90<br />
80<br />
DOWNLOAD THE CEPCI TWO WEEKS SOONER AT WWW.CHE.COM/PCI<br />
CHEMICAL ENGINEERING PLANT COST INDEX (CEPCI)<br />
(1957-59 = 100)<br />
May. '11<br />
Prelim.<br />
CPI OUTPUT INDEX (2007 = 100) CPI OUTPUT VALUE ($ BILLIONS) CPI OPERATING RATE (%)<br />
2500<br />
2200<br />
1900<br />
1600<br />
1300<br />
Apr. '11<br />
Final<br />
70<br />
1000<br />
60<br />
J F M A M J J A S O N D J F M A M J J A S O N D J F M A M J J A S O N D<br />
Current Business Indicators provided by Global Insight, Inc., Lexington, Mass.<br />
Annual Index:<br />
2003 = 1,123.6 2004 = 1,178.5 2005 = 1,244.5 2006 = 1,302.3<br />
2007 = 1,373.3 2008 = 1,449.3 2009 = 1,468.6 2010 = 1,457.4<br />
May. '10<br />
Final<br />
CE Index 581.7 582.3 558.2<br />
Equipment 707.3 708.0 670.2<br />
Heat exchangers & tanks 673.0 671.4 629.9<br />
Process machinery 663.7 665.3 631.8<br />
Pipe, valves & fittings 861.8 867.9 828.3<br />
Process instruments 440.1 443.7 424.8<br />
Pumps & compressors 904.4 904.7 903.1<br />
Electrical equipment 503.0 502.6 473.2<br />
Structural supports & misc 755.7 752.8 697.5<br />
Construction labor 325.0 325.8 327.8<br />
Buildings 518.2 517.1 513.9<br />
Engineering & supervision 332.9 333.6 339.7<br />
MARSHALL & SWIFT EQUIPMENT COST INDEX<br />
(1926 = 100) 2nd Q<br />
2011<br />
1st Q<br />
2011<br />
4th Q<br />
2010<br />
3rd Q<br />
2010<br />
2nd Q<br />
2010<br />
M & S INDEX 1,512.5 1,490.2 1,476.7 1,473.3 1,461.3<br />
Process industries, average 1,569.0 1,549.8 1,537.0 1,534.4 1,522.1<br />
Cement 1,568.0 1,546.6 1,532.5 1,530.0 1,519.2<br />
Chemicals 1,537.4 1,519.8 1,507.3 1,505.2 1,493.5<br />
Clay products 1,557.5 1,534.9 1,521.4 1,518.3 1,505.6<br />
Glass 1,469.2 1,447.2 1,432.7 1,428.5 1,416.4<br />
Paint 1,584.1 1,560.7 1,545.8 1,542.1 1,527.6<br />
Paper 1,480.7 1,459.4 1,447.6 1,444.5 1,430.1<br />
Petroleum products 1,672.0 1,652.5 1,640.4 1,637.0 1,625.9<br />
Rubber 1,617.4 1,596.2 1,581.5 1,579.3 1,564.2<br />
Related industries<br />
Electrical power 1,494.9 1,461.2 1,434.9 1,419.2 1,414.0<br />
Mining, milling 1,623.5 1,599.7 1,579.4 1,576.7 1,569.1<br />
Refrigeration 1,856.4 1,827.8 1,809.3 1,804.8 1,786.9<br />
Steam power 1,546.5 1,523.0 1,506.4 1,502.3 1,488.0<br />
1530<br />
1515<br />
1500<br />
1485<br />
1470<br />
1455<br />
1440<br />
1425<br />
1410<br />
1395<br />
1380<br />
1365<br />
1350<br />
650<br />
600<br />
550<br />
500<br />
450<br />
400<br />
1st 2nd 3rd<br />
Quarter<br />
Source: Marshall & Swift‘s Marshall Valuation Service manual. Reprinted and published with permission of<br />
Marshall & Swift/Boeckh, LLC and its licensors, copyright 2010. May not be reprinted, copied, automated or<br />
used for valuation without permission.<br />
56 CHEMICAL ENGINEERING WWW.CHE.COM AUGUST 2011<br />
Annual Index:<br />
2003 = 402.0<br />
2004 = 444.2<br />
2005 = 468.2<br />
2006 = 499.6<br />
2007 = 525.4<br />
2008 = 575.4<br />
2009 = 521.9<br />
2010 = 550.8<br />
J F M A M J J A S O N D<br />
85<br />
80<br />
4th<br />
2009 2010 2011<br />
75<br />
70<br />
65<br />
CURRENT TRENDS<br />
apital equipment prices,<br />
Cas reflected in <strong>the</strong> CE<br />
Plant Cost Index (CEPCI),<br />
decreased approximately<br />
0.10% on average from<br />
April to May, after increasing<br />
approximately 1.14% from<br />
March to April.<br />
Meanwhile, according to <strong>the</strong><br />
American Chemistry Council’s<br />
(Washington, D.C.; www.<br />
americanchemistry.com) midyear<br />
economic report, total<br />
output for <strong>the</strong> global chemical<br />
industry is expected to grow<br />
by 4.8% in 2011, 5.3% in<br />
2012, and 4.7% in 2013.<br />
Visit www.che.com/pci for<br />
more information and o<strong>the</strong>r<br />
tips on capital cost trends<br />
and methodology. ■