- Page 1 and 2:
t Long Term Plan 2012-2022Hurunui C
- Page 3 and 4:
Hurunui Community Long Term Plan 20
- Page 5 and 6:
Hurunui Community Long Term Plan 20
- Page 7 and 8:
Hurunui Community Long Term Plan 20
- Page 9 and 10:
About the PlanIntroductionThe Local
- Page 11 and 12:
How Your Rates are SpentThe Council
- Page 13 and 14:
Hurunui Community Long Term Plan 20
- Page 15 and 16:
Hurunui Community Long Term Plan 20
- Page 17 and 18:
Hurunui Community Long Term Plan 20
- Page 19 and 20:
Hurunui Community Long Term Plan 20
- Page 21 and 22:
Hurunui Community Long Term Plan 20
- Page 23 and 24:
Hurunui Community Long Term Plan 20
- Page 26 and 27:
www.hurunui.govt.nzCapital and Oper
- Page 28 and 29:
www.hurunui.govt.nzRate IncreasesIn
- Page 30 and 31:
www.hurunui.govt.nzFees and Charges
- Page 32 and 33:
www.hurunui.govt.nzStatement Concer
- Page 34 and 35:
www.hurunui.govt.nzCommunity Outcom
- Page 36 and 37:
www.hurunui.govt.nzAligning Our Lon
- Page 38 and 39:
www.hurunui.govt.nzIn October 2011,
- Page 40 and 41:
www.hurunui.govt.nzWater Management
- Page 42 and 43:
www.hurunui.govt.nzin water use eff
- Page 44 and 45:
www.hurunui.govt.nzEmissions Tradin
- Page 46 and 47:
www.hurunui.govt.nzHurunui District
- Page 48 and 49:
www.hurunui.govt.nz48
- Page 50 and 51:
www.hurunui.govt.nzRateable Value78
- Page 52 and 53:
www.hurunui.govt.nzAmberley Ward Pr
- Page 54 and 55:
www.hurunui.govt.nzdifferent demand
- Page 56 and 57:
www.hurunui.govt.nzTowards the nort
- Page 58 and 59:
www.hurunui.govt.nzbusinesses in th
- Page 60 and 61:
www.hurunui.govt.nzCheviot Ward Pro
- Page 62 and 63:
www.hurunui.govt.nzGlenmark Ward Pr
- Page 64 and 65:
www.hurunui.govt.nzKey ProjectsYear
- Page 66 and 67:
www.hurunui.govt.nz• In response
- Page 68 and 69:
www.hurunui.govt.nzCouncil Activiti
- Page 70 and 71:
www.hurunui.govt.nzContribution to
- Page 72 and 73:
www.hurunui.govt.nzmeet the New Zea
- Page 74 and 75:
www.hurunui.govt.nzrural council su
- Page 76 and 77:
www.hurunui.govt.nzWe will continue
- Page 78 and 79:
www.hurunui.govt.nzWater Supplies -
- Page 80 and 81:
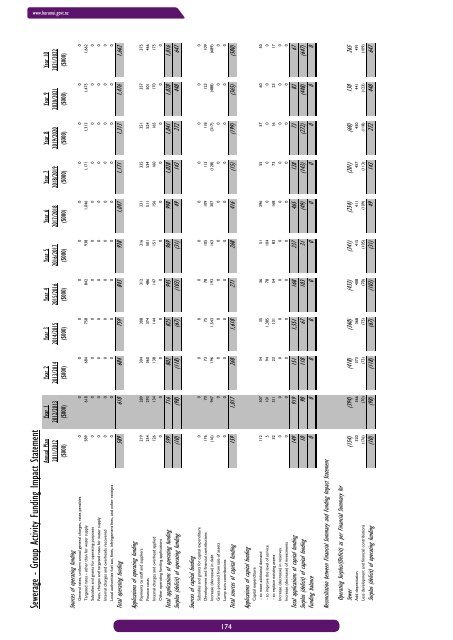
www.hurunui.govt.nzActivity 1: Sewe
- Page 82 and 83:
www.hurunui.govt.nzGoals and Perfor
- Page 84 and 85:
www.hurunui.govt.nzRoads and Footpa
- Page 86 and 87:
www.hurunui.govt.nzdeferred to dive
- Page 88 and 89:
www.hurunui.govt.nzCommunity Outcom
- Page 90 and 91:
www.hurunui.govt.nzStormwater and D
- Page 92 and 93:
www.hurunui.govt.nzCouncil Owned As
- Page 94 and 95:
www.hurunui.govt.nzCommunity Servic
- Page 96 and 97:
www.hurunui.govt.nzActivity 1: Comm
- Page 98 and 99:
www.hurunui.govt.nzFundingLibraryOp
- Page 100 and 101:
www.hurunui.govt.nzGoals and Perfor
- Page 102 and 103:
www.hurunui.govt.nzActivity 2: Prop
- Page 104 and 105:
www.hurunui.govt.nzPublic ToiletsTo
- Page 106 and 107:
www.hurunui.govt.nzGoals and Perfor
- Page 108 and 109:
www.hurunui.govt.nzActivity 3: Rese
- Page 110 and 111:
www.hurunui.govt.nzCemeteriesThe bi
- Page 112 and 113:
www.hurunui.govt.nzEnvironment and
- Page 114 and 115:
www.hurunui.govt.nzEnvironment and
- Page 116 and 117:
www.hurunui.govt.nzthe intended out
- Page 118 and 119:
www.hurunui.govt.nzEmergency Servic
- Page 120 and 121:
www.hurunui.govt.nzCouncil Owned As
- Page 122 and 123:
www.hurunui.govt.nzActivity 3: Comp
- Page 124 and 125: www.hurunui.govt.nzPublic Health &
- Page 126 and 127: www.hurunui.govt.nzActivity 4: Wast
- Page 128 and 129: www.hurunui.govt.nzShared ServicesT
- Page 130 and 131: www.hurunui.govt.nzDistrict Promoti
- Page 132 and 133: www.hurunui.govt.nzAfter taking int
- Page 134 and 135: www.hurunui.govt.nzDistrict Promoti
- Page 136 and 137: www.hurunui.govt.nzFinancial Summar
- Page 138 and 139: www.hurunui.govt.nzthe Library func
- Page 140 and 141: www.hurunui.govt.nzHanmer Springs T
- Page 142 and 143: www.hurunui.govt.nzActivity 1: Gove
- Page 144 and 145: www.hurunui.govt.nzGoals and Perfor
- Page 146 and 147: www.hurunui.govt.nzFinancial Overvi
- Page 148 and 149: www.hurunui.govt.nzForecasting Assu
- Page 150 and 151: www.hurunui.govt.nz5. Emissions Tra
- Page 152 and 153: www.hurunui.govt.nzRisks and Uncert
- Page 154 and 155: www.hurunui.govt.nzChanges in Accou
- Page 156 and 157: www.hurunui.govt.nzassets at fair v
- Page 158 and 159: www.hurunui.govt.nzD Perry and peer
- Page 160 and 161: www.hurunui.govt.nzThe Council reco
- Page 162 and 163: www.hurunui.govt.nzForecast Stateme
- Page 164 and 165: www.hurunui.govt.nzForecast Stateme
- Page 166 and 167: www.hurunui.govt.nzAnnual Plan Year
- Page 168 and 169: www.hurunui.govt.nzForecast Summary
- Page 170 and 171: www.hurunui.govt.nzForecast Summary
- Page 172 and 173: www.hurunui.govt.nzHurunui District
- Page 176 and 177: www.hurunui.govt.nzRoading and Foot
- Page 178 and 179: www.hurunui.govt.nzEnvironment and
- Page 180 and 181: www.hurunui.govt.nzHanmer Springs T
- Page 182 and 183: www.hurunui.govt.nzRates SystemDist
- Page 184 and 185: www.hurunui.govt.nzWater Treatment
- Page 186 and 187: www.hurunui.govt.nzSwimming Pool In
- Page 188 and 189: www.hurunui.govt.nzBreakdown of Rat
- Page 190 and 191: www.hurunui.govt.nzTargeted Rates -
- Page 192 and 193: www.hurunui.govt.nzTargeted Rates -
- Page 194 and 195: www.hurunui.govt.nzSpecial FundsFun
- Page 196 and 197: www.hurunui.govt.nzDevelopment Cont
- Page 198 and 199: www.hurunui.govt.nzCouncil Controll
- Page 200 and 201: www.hurunui.govt.nzPolicy Introduct
- Page 202 and 203: www.hurunui.govt.nzstrictly those r
- Page 204 and 205: www.hurunui.govt.nzThe requirement
- Page 206 and 207: www.hurunui.govt.nzReserve Strategy
- Page 208 and 209: www.hurunui.govt.nzWater is a neces
- Page 210 and 211: www.hurunui.govt.nzBasis for Assess
- Page 212 and 213: www.hurunui.govt.nzNeed to Undertak
- Page 214 and 215: www.hurunui.govt.nzAppendix 1.Proje
- Page 216 and 217: www.hurunui.govt.nzAppendix 3.Devel
- Page 218 and 219: www.hurunui.govt.nzUnder the Debent
- Page 220 and 221: www.hurunui.govt.nzForestry Investm
- Page 222 and 223: www.hurunui.govt.nzRates Remissions
- Page 224 and 225:
www.hurunui.govt.nzRevenue and Fina
- Page 226 and 227:
www.hurunui.govt.nzServiceRelevant
- Page 228 and 229:
www.hurunui.govt.nzServiceRelevantC
- Page 230 and 231:
www.hurunui.govt.nzServiceRelevant
- Page 232 and 233:
www.hurunui.govt.nzServiceRelevant
- Page 234 and 235:
www.hurunui.govt.nzServiceRelevant
- Page 236 and 237:
www.hurunui.govt.nzServiceRelevant
- Page 238 and 239:
www.hurunui.govt.nzServiceRelevant
- Page 240 and 241:
www.hurunui.govt.nzServiceRelevant
- Page 242 and 243:
www.hurunui.govt.nzServiceRelevant
- Page 244 and 245:
www.hurunui.govt.nzServiceRelevantC
- Page 246 and 247:
www.hurunui.govt.nzServiceRelevantC
- Page 248 and 249:
www.hurunui.govt.nzServiceRelevantC
- Page 250 and 251:
www.hurunui.govt.nzServiceRelevantC
- Page 252 and 253:
www.hurunui.govt.nzThe starting poi
- Page 254 and 255:
www.hurunui.govt.nzAppendix 1: Sche
- Page 256 and 257:
www.hurunui.govt.nzS 82 Principles
- Page 258 and 259:
www.hurunui.govt.nzTreasury Risk Ma
- Page 260 and 261:
www.hurunui.govt.nzdebt exceeds $25
- Page 262 and 263:
www.hurunui.govt.nzInternal Financi
- Page 264 and 265:
www.hurunui.govt.nzAppendices265 Re
- Page 266 and 267:
www.hurunui.govt.nzWaste Management
- Page 268 and 269:
www.hurunui.govt.nzHurunui Waiau Zo
- Page 270 and 271:
www.hurunui.govt.nzWater and Sanita
- Page 272 and 273:
www.hurunui.govt.nzLevels of Servic
- Page 274 and 275:
www.hurunui.govt.nzLEVELS OF SERVIC
- Page 276 and 277:
www.hurunui.govt.nzLeithfield Towns
- Page 278 and 279:
www.hurunui.govt.nzCheviot RuralMot
- Page 280 and 281:
www.hurunui.govt.nzWaikari Township
- Page 282 and 283:
www.hurunui.govt.nz282
- Page 284 and 285:
www.hurunui.govt.nzPhone: 03 314 88