Draft Long Term Plan 2012-2022 - Hurunui District Council
Draft Long Term Plan 2012-2022 - Hurunui District Council
Draft Long Term Plan 2012-2022 - Hurunui District Council

Create successful ePaper yourself
Turn your PDF publications into a flip-book with our unique Google optimized e-Paper software.
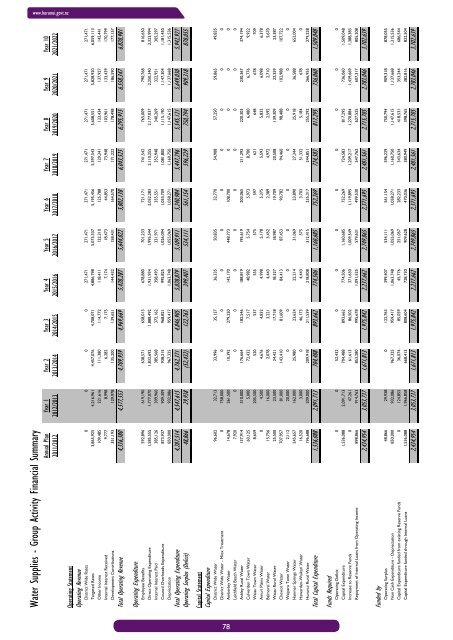
www.hurunui.govt.nzWater Supplies - Group Activity Financial SummaryAnnual <strong>Plan</strong> Year 1 Year 2 Year 3 Year 4 Year 5 Year 6 Year 7 Year 8 Year 9 Year 102011/<strong>2012</strong> <strong>2012</strong>/2013 2013/2014 2014/2015 2015/2016 2016/2017 2017/2018 2018/2019 2019/2020 2020/2021 2021/<strong>2022</strong>Operating StatementOperating Revenue<strong>District</strong> Wide Rates 0 0 0 0 271,471 271,471 271,471 271,471 271,471 271,471 271,471Targeted Rates 3,865,925 4,216,961 4,457,076 4,708,071 4,886,798 5,073,337 5,195,456 5,397,543 5,608,551 5,828,920 6,059,113Other Income 109,485 221,616 111,380 114,772 118,411 122,310 125,788 129,341 133,434 137,927 142,441Internal Interest Received 9,777 8,998 6,282 7,175 7,174 18,473 44,853 73,948 103,961 133,439 170,799Development Contributions 351,193 129,978 135,200 139,651 144,432 158,431 164,570 171,222 178,498 186,590 177,157Total Operating Revenue 4,336,380 4,577,553 4,709,939 4,969,669 5,428,287 5,644,022 5,802,138 6,043,525 6,295,915 6,558,347 6,820,981Operating ExpenditureEmployee Benefits 592,896 619,190 638,571 658,013 678,880 701,233 721,171 741,542 765,009 790,768 816,650Direct Operating Expenditure 1,585,555 1,777,070 1,832,692 1,888,492 1,931,934 1,995,544 2,052,283 2,110,255 2,177,037 2,250,340 2,323,994Internal Interest Paid 385,126 309,960 385,568 372,162 358,493 331,971 355,551 352,948 340,269 322,951 305,297<strong>Council</strong> Overheads Expenditure 873,937 909,309 938,215 968,821 995,825 1,026,094 1,053,709 1,081,800 1,115,190 1,147,304 1,181,450Depreciation 850,000 932,086 967,325 959,417 1,063,748 1,055,069 1,058,271 1,160,750 1,147,615 1,137,668 1,315,536Total Operating Expenditure 4,287,514 4,547,615 4,762,371 4,846,905 5,028,879 5,109,911 5,240,984 5,447,296 5,545,121 5,649,030 5,942,927Operating Surplus (Deficit) 48,866 29,938 (52,432) 122,763 399,407 534,111 561,154 596,229 750,794 909,318 878,055Capital StatementCapital Expenditure<strong>District</strong> Wide Water 96,602 32,713 33,996 35,127 36,335 50,835 52,770 54,908 57,250 59,865 49,835<strong>District</strong> Wide Water - Miox Treatment 0 758,000 0 0 0 0 0 0 0 0 0Amberley Water 14,678 261,500 10,392 279,220 142,170 448,773 108,700 0 0 0 0Leithfield Beach Water 7,920 0 0 0 0 0 0 0 0 0 0Ashley Rural Water 137,914 310,000 176,664 182,546 188,819 195,619 203,065 211,293 220,303 230,367 374,194Culverden Town Water 60,125 5,000 72,432 7,517 48,982 5,754 5,973 8,700 6,480 6,776 9,922Waiau Town Water 8,659 205,500 520 537 555 575 597 621 648 678 709Amuri Plains Water 0 4,500 4,676 4,832 4,998 5,178 5,375 5,593 5,832 6,098 6,378Balmoral Water 15,756 16,000 2,078 3,221 4,443 3,452 2,389 4,972 2,592 2,710 5,670Waiau Rural Water 25,500 23,500 24,421 17,718 18,327 18,987 19,709 20,508 139,309 22,359 23,387Cheviot Water 707,957 81,000 143,410 81,609 84,413 87,453 90,782 94,460 98,488 102,988 107,722Waipara Town Water 2,112 20,000 0 0 0 0 0 0 0 0 0Hanmer Springs Water 245,657 162,000 25,980 23,624 22,214 31,069 23,890 27,344 25,918 36,588 652,004Hawarden-Waikari Water 16,520 3,000 0 46,173 4,443 575 3,703 51,332 5,184 678 0<strong>Hurunui</strong> Rural Water 196,688 209,000 209,918 211,539 218,808 312,415 235,317 244,851 255,292 266,955 279,228Total Capital Expenditure 1,536,088 2,091,713 704,488 893,662 774,506 1,160,685 752,269 724,583 817,295 736,060 1,509,048Funds RequiredOperating Deficit 0 0 52,432 0 0 0 0 0 0 0 0Capital Expenditure 1,536,088 2,091,713 704,488 893,662 774,506 1,160,685 752,269 724,583 817,295 736,060 1,509,048Increase to Reserve Funds 0 47,261 61,613 86,502 371,630 1,009,549 1,119,895 1,209,217 1,270,884 1,439,669 1,388,383Repayment of Internal Loans from Operating Income 898,866 914,763 853,280 995,678 1,091,525 579,631 499,530 547,762 627,525 607,317 805,2082,434,954 3,053,737 1,671,813 1,975,842 2,237,662 2,749,865 2,371,695 2,481,561 2,715,705 2,783,046 3,702,639Funded byOperating Surplus 48,866 29,938 0 122,763 399,407 534,111 561,154 596,229 750,794 909,318 878,055Non Cash Expenditure - Depreciation 850,000 932,086 967,325 959,417 1,063,748 1,055,069 1,058,271 1,160,750 1,147,615 1,137,668 1,315,536Capital Expenditure funded from existing Reserve Funds 0 124,855 36,074 85,059 45,776 251,057 282,233 343,634 418,531 353,244 686,544Capital Expenditure funded through Internal Loans 1,536,088 1,966,858 668,413 808,604 728,730 909,628 470,036 380,949 398,765 382,816 822,5042,434,954 3,053,737 1,671,813 1,975,842 2,237,662 2,749,865 2,371,695 2,481,561 2,715,705 2,783,046 3,702,639H:\<strong>Long</strong> <strong>Term</strong> <strong>Plan</strong> Workings\<strong>Hurunui</strong> <strong>District</strong> <strong>Council</strong> LTP Budgets <strong>2012</strong>-<strong>2022</strong> - Post Submissions.xls 31/05/<strong>2012</strong> 9:34 a.m.78