Draft Long Term Plan 2012-2022 - Hurunui District Council
Draft Long Term Plan 2012-2022 - Hurunui District Council
Draft Long Term Plan 2012-2022 - Hurunui District Council
Create successful ePaper yourself
Turn your PDF publications into a flip-book with our unique Google optimized e-Paper software.
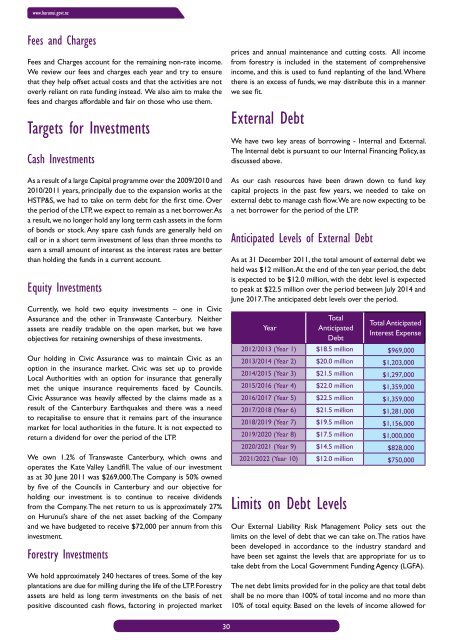
www.hurunui.govt.nzFees and ChargesFees and Charges account for the remaining non-rate income.We review our fees and charges each year and try to ensurethat they help offset actual costs and that the activities are notoverly reliant on rate funding instead. We also aim to make thefees and charges affordable and fair on those who use them.Targets for InvestmentsCash InvestmentsAs a result of a large Capital programme over the 2009/2010 and2010/2011 years, principally due to the expansion works at theHSTP&S, we had to take on term debt for the first time. Overthe period of the LTP, we expect to remain as a net borrower. Asa result, we no longer hold any long term cash assets in the formof bonds or stock. Any spare cash funds are generally held oncall or in a short term investment of less than three months toearn a small amount of interest as the interest rates are betterthan holding the funds in a current account.Equity InvestmentsCurrently, we hold two equity investments – one in CivicAssurance and the other in Transwaste Canterbury. Neitherassets are readily tradable on the open market, but we haveobjectives for retaining ownerships of these investments.Our holding in Civic Assurance was to maintain Civic as anoption in the insurance market. Civic was set up to provideLocal Authorities with an option for insurance that generallymet the unique insurance requirements faced by <strong>Council</strong>s.Civic Assurance was heavily affected by the claims made as aresult of the Canterbury Earthquakes and there was a needto recapitalise to ensure that it remains part of the insurancemarket for local authorities in the future. It is not expected toreturn a dividend for over the period of the LTP.We own 1.2% of Transwaste Canterbury, which owns andoperates the Kate Valley Landfill. The value of our investmentas at 30 June 2011 was $269,000.The Company is 50% ownedby five of the <strong>Council</strong>s in Canterbury and our objective forholding our investment is to continue to receive dividendsfrom the Company. The net return to us is approximately 27%on <strong>Hurunui</strong>’s share of the net asset backing of the Companyand we have budgeted to receive $72,000 per annum from thisinvestment.Forestry InvestmentsWe hold approximately 240 hectares of trees. Some of the keyplantations are due for milling during the life of the LTP. Forestryassets are held as long term investments on the basis of netpositive discounted cash flows, factoring in projected marketprices and annual maintenance and cutting costs. All incomefrom forestry is included in the statement of comprehensiveincome, and this is used to fund replanting of the land. Wherethere is an excess of funds, we may distribute this in a mannerwe see fit.External DebtWe have two key areas of borrowing - Internal and External.The Internal debt is pursuant to our Internal Financing Policy, asdiscussed above.As our cash resources have been drawn down to fund keycapital projects in the past few years, we needed to take onexternal debt to manage cash flow. We are now expecting to bea net borrower for the period of the LTP.Anticipated Levels of External DebtAs at 31 December 2011, the total amount of external debt weheld was $12 million. At the end of the ten year period, the debtis expected to be $12.0 million, with the debt level is expectedto peak at $22.5 million over the period between July 2014 andJune 2017. The anticipated debt levels over the period.YearTotalAnticipatedDebtLimits on Debt LevelsTotal AnticipatedInterest Expense<strong>2012</strong>/2013 (Year 1) $18.5 million $969,0002013/2014 (Year 2) $20.0 million $1,203,0002014/2015 (Year 3) $21.5 million $1,297,0002015/2016 (Year 4) $22.0 million $1,359,0002016/2017 (Year 5) $22.5 million $1,359,0002017/2018 (Year 6) $21.5 million $1,281,0002018/2019 (Year 7) $19.5 million $1,156,0002019/2020 (Year 8) $17.5 million $1,000,0002020/2021 (Year 9) $14.5 million $828,0002021/<strong>2022</strong> (Year 10) $12.0 million $750,000Our External Liability Risk Management Policy sets out thelimits on the level of debt that we can take on. The ratios havebeen developed in accordance to the industry standard andhave been set against the levels that are appropriate for us totake debt from the Local Government Funding Agency (LGFA).The net debt limits provided for in the policy are that total debtshall be no more than 100% of total income and no more than10% of total equity. Based on the levels of income allowed for30


