NOTICE OF MEETING AND AGENDA - Metro Transit
NOTICE OF MEETING AND AGENDA - Metro Transit
NOTICE OF MEETING AND AGENDA - Metro Transit

You also want an ePaper? Increase the reach of your titles
YUMPU automatically turns print PDFs into web optimized ePapers that Google loves.
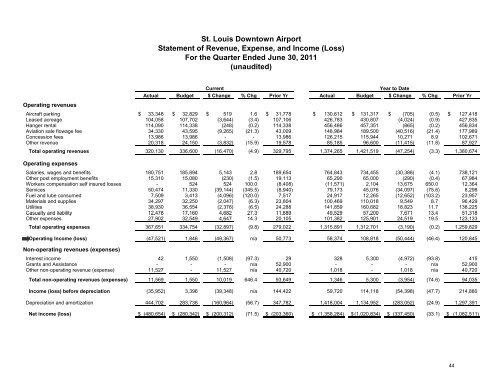
St. Louis Downtown AirportStatement of Revenue, Expense, and Income (Loss)For the Quarter Ended June 30, 2011(unaudited)Operating revenuesCurrentYear to DateActual Budget $ Change % Chg Prior Yr Actual Budget $ Change % Chg Prior YrAircraft parking $ 33,348 $ 32,829 $ 519 1.6 $ 31,778 $ 130,612 $ 131,317 $ (705) (0.5) $ 127,418Leased acreage 104,058 107,702 (3,644) (3.4) 107,106 426,783 430,807 (4,024) (0.9) 427,835Hanger rental 114,090 114,338 (248) (0.2) 114,338 456,486 457,351 (865) (0.2) 456,834Aviation sale flowage fee 34,330 43,595 (9,265) (21.3) 43,009 148,984 189,500 (40,516) (21.4) 177,989Concession fees 13,986 13,986 - - 13,986 126,215 115,944 10,271 8.9 102,671Other revenue 20,318 24,150 (3,832) (15.9) 19,578 85,185 96,600 (11,415) (11.8) 87,927Total operating revenues 320,130 336,600 (16,470) (4.9) 329,795 1,374,265 1,421,519 (47,254) (3.3) 1,380,674Operating expensesSalaries, wages and benefits 180,751 185,894 5,143 2.8 189,654 764,843 734,455 (30,388) (4.1) 738,121Other post employment benefits 15,310 15,080 (230) (1.5) 19,113 65,290 65,000 (290) (0.4) 67,984Workers compensation self insured losses - 524 524 100.0 (8,408) (11,571) 2,104 13,675 650.0 12,364Services 50,474 11,330 (39,144) (345.5) (8,940) 79,173 45,076 (34,097) (75.6) 8,298Fuel and lube consumed 7,509 3,413 (4,096) (120.0) 7,517 24,917 12,265 (12,652) (103.2) 23,957Materials and supplies 34,297 32,250 (2,047) (6.3) 23,804 100,469 110,018 9,549 8.7 96,429Utilities 38,930 36,554 (2,376) (6.5) 24,288 141,859 160,682 18,823 11.7 138,225Casualty and liability 12,478 17,160 4,682 27.3 11,889 49,529 57,200 7,671 13.4 51,318Other expenses 27,902 32,549 4,647 14.3 20,105 101,382 125,901 24,519 19.5 123,133Total operating expenses 367,651 334,754 (32,897) (9.8) 279,022 1,315,891 1,312,701 (3,190) (0.2) 1,259,829Operating Income (loss) (47,521) 1,846 (49,367) n/a 50,773 58,374 108,818 (50,444) (46.4) 120,845Non-operating revenues (expenses)Interest income 42 1,550 (1,508) (97.3) 29 328 5,300 (4,972) (93.8) 415Grants and Assistance - - - n/a 52,900 - - - n/a 52,900Other non-operating revenue (expense) 11,527 - 11,527 n/a 40,720 1,018 - 1,018 n/a 40,720Total non-operating revenues (expenses) 11,569 1,550 10,019 646.4 93,649 1,346 5,300 (3,954) (74.6) 94,035Income (loss) before depreciation (35,952) 3,396 (39,348) n/a 144,422 59,720 114,118 (54,398) (47.7) 214,880Depreciation and amortization 444,702 283,738 (160,964) (56.7) 347,782 1,418,004 1,134,952 (283,052) (24.9) 1,297,391Net income (loss) $ (480,654) $ (280,342) $ (200,312) (71.5) $ (203,360) $ (1,358,284) $ (1,020,834) $ (337,450) (33.1) $ (1,082,511)44