NOTICE OF MEETING AND AGENDA - Metro Transit
NOTICE OF MEETING AND AGENDA - Metro Transit
NOTICE OF MEETING AND AGENDA - Metro Transit

Create successful ePaper yourself
Turn your PDF publications into a flip-book with our unique Google optimized e-Paper software.
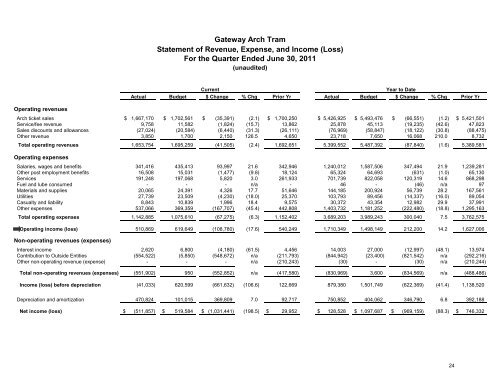
Gateway Arch TramStatement of Revenue, Expense, and Income (Loss)For the Quarter Ended June 30, 2011(unaudited)Operating revenuesCurrentYear to DateActual Budget $ Change % Chg Prior Yr Actual Budget $ Change % Chg Prior YrArch ticket sales $ 1,667,170 $ 1,702,561 $ (35,391) (2.1) $ 1,700,250 $ 5,426,925 $ 5,493,476 $ (66,551) (1.2) $ 5,421,501Service/fee revenue 9,758 11,582 (1,824) (15.7) 13,862 25,878 45,113 (19,235) (42.6) 47,823Sales discounts and allowances (27,024) (20,584) (6,440) (31.3) (26,111) (76,969) (58,847) (18,122) (30.8) (88,475)Other revenue 3,850 1,700 2,150 126.5 4,650 23,718 7,650 16,068 210.0 8,732Total operating revenues 1,653,754 1,695,259 (41,505) (2.4) 1,692,651 5,399,552 5,487,392 (87,840) (1.6) 5,389,581Operating expensesSalaries, wages and benefits 341,416 435,413 93,997 21.6 342,946 1,240,012 1,587,506 347,494 21.9 1,239,281Other post employment benefits 16,508 15,031 (1,477) (9.8) 18,124 65,324 64,693 (631) (1.0) 65,130Services 191,248 197,068 5,820 3.0 261,933 701,739 822,058 120,319 14.6 868,298Fuel and lube consumed - - - n/a - 46 - (46) n/a 97Materials and supplies 20,065 24,391 4,326 17.7 51,646 144,185 200,924 56,739 28.2 167,561Utilities 27,739 23,509 (4,230) (18.0) 25,370 103,793 89,456 (14,337) (16.0) 89,054Casualty and liability 8,843 10,839 1,996 18.4 9,575 30,372 43,354 12,982 29.9 37,991Other expenses 537,066 369,359 (167,707) (45.4) 442,808 1,403,732 1,181,252 (222,480) (18.8) 1,295,163Total operating expenses 1,142,885 1,075,610 (67,275) (6.3) 1,152,402 3,689,203 3,989,243 300,040 7.5 3,762,575Operating income (loss) 510,869 619,649 (108,780) (17.6) 540,249 1,710,349 1,498,149 212,200 14.2 1,627,006Non-operating revenues (expenses)Interest income 2,620 6,800 (4,180) (61.5) 4,456 14,003 27,000 (12,997) (48.1) 13,974Contribution to Outside Entities (554,522) (5,850) (548,672) n/a (211,793) (844,942) (23,400) (821,542) n/a (292,216)Other non-operating revenue (expense) - - - n/a (210,243) (30) - (30) n/a (210,244)Total non-operating revenues (expenses) (551,902) 950 (552,852) n/a (417,580) (830,969) 3,600 (834,569) n/a (488,486)Income (loss) before depreciation (41,033) 620,599 (661,632) (106.6) 122,669 879,380 1,501,749 (622,369) (41.4) 1,138,520Depreciation and amortization 470,824 101,015 369,809 7.0 92,717 750,852 404,062 346,790 6.8 392,188Net income (loss) $ (511,857) $ 519,584 $ (1,031,441) (198.5) $ 29,952 $ 128,528 $ 1,097,687 $ (969,159) (88.3) $ 746,33224