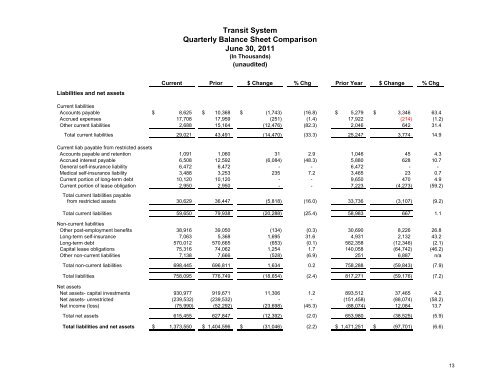
<strong>Transit</strong> SystemQuarterly Balance Sheet ComparisonJune 30, 2011(In Thousands)(unaudited)Liabilities and net assetsCurrent Prior $ Change % Chg Prior Year $ Change % ChgCurrent liabilitiesAccounts payable $ 8,625 $ 10,368 $ (1,743) (16.8) $ 5,279 $ 3,346 63.4Accrued expenses 17,708 17,959 (251) (1.4) 17,922 (214) (1.2)Other current liabilities 2,688 15,164 (12,476) (82.3) 2,046 642 31.4Total current liabilities 29,021 43,491 (14,470) (33.3) 25,247 3,774 14.9Current liab payable from restricted assetsAccounts payable and retention 1,091 1,060 31 2.9 1,046 45 4.3Accrued interest payable 6,508 12,592 (6,084) (48.3) 5,880 628 10.7General self-insurance liability 6,472 6,472 - - 6,472 - -Medical self-insurance liability 3,488 3,253 235 7.2 3,465 23 0.7Current portion of long-term debt 10,120 10,120 - - 9,650 470 4.9Current portion of lease obligation 2,950 2,950 - - 7,223 (4,273) (59.2)Total current liabilities payablefrom restricted assets 30,629 36,447 (5,818) (16.0) 33,736 (3,107) (9.2)Total current liabilities 59,650 79,938 (20,288) (25.4) 58,983 667 1.1Non-current liabilitiesOther post-employment benefits 38,916 39,050 (134) (0.3) 30,690 8,226 26.8Long-term self-insurance 7,063 5,368 1,695 31.6 4,931 2,132 43.2Long-term debt 570,012 570,665 (653) (0.1) 582,358 (12,346) (2.1)Capital lease obligations 75,316 74,062 1,254 1.7 140,058 (64,742) (46.2)Other non-current liabilities 7,138 7,666 (528) (6.9) 251 6,887 n/aTotal non-current liabilities 698,445 696,811 1,634 0.2 758,288 (59,843) (7.9)Total liabilities 758,095 776,749 (18,654) (2.4) 817,271 (59,176) (7.2)Net assetsNet assets- capital investments 930,977 919,671 11,306 1.2 893,512 37,465 4.2Net assets- unrestricted (239,532) (239,532) - - (151,458) (88,074) (58.2)Net income (loss) (75,990) (52,292) (23,698) (45.3) (88,074) 12,084 13.7Total net assets 615,455 627,847 (12,392) (2.0) 653,980 (38,525) (5.9)Total liabilities and net assets $ 1,373,550 $ 1,404,596 $ (31,046) (2.2) $ 1,471,251 $ (97,701) (6.6)13
<strong>Transit</strong> Operating SystemStatement of Revenue, Expense, and Income (Loss)For the Quarter Ended June 30, 2011(unaudited)(In Thousands)CurrentYear to Date$ Favorable % Fav $ Favorable % FavActual Budget (Unfavorable) (Unfav) Prior Yr Actual Budget (Unfavorable) (Unfav) Prior YrOperating revenuePassenger revenue $ 11,658 $ 11,810 $ (152) (1.3) $ 11,496 $ 47,497 $ 48,342 $ (845) (1.7) $ 46,229Other operating revenue 908 724 184 25.4 887 3,690 2,859 831 29.1 2,911Total operating revenue 12,566 12,534 32 0.3 12,383 51,187 51,201 (14) - 49,140Operating expenseWages and benefits 35,301 37,156 1,855 5.0 33,956 138,512 146,763 8,251 5.6 130,673Other post employment benefits 2,783 3,049 266 8.7 2,271 11,143 12,133 990 8.2 10,648Services 6,296 5,749 (547) (9.5) 6,550 24,160 23,808 (352) (1.5) 20,922Fuel and lube consumed 4,234 3,915 (319) (8.1) 2,979 13,957 15,663 1,706 10.9 13,920Materials and supplies 5,108 4,402 (706) (16.0) 4,209 17,533 16,422 (1,111) (6.8) 14,121Utilities 1,477 1,683 206 12.2 1,412 6,821 7,728 907 11.7 6,657Casualty and liability costs 2,320 1,286 (1,034) (80.4) 479 5,934 5,131 (803) (15.6) 4,832Lease and other expenses 1,094 879 (215) (24.5) 899 3,502 3,675 173 4.7 3,086Total operating expense 58,613 58,119 (494) (0.8) 52,755 221,562 231,323 9,761 4.2 204,859Operating income (loss) (46,047) (45,585) 585) (462) (1.0) (40,372) (170,375) (180,122) 122) 9,747 54 5.4 (155,719)Non-operating revenue (expenses)Grants and assistance * 46,982 46,657 325 0.7 35,118 198,675 200,560 (1,885) (0.9) 172,027Interest revenue 6,826 9,905 (3,079) (31.1) 16,192 7,068 10,120 (3,052) (30.2) 16,366Interest expense (12,452) (17,584) 5,132 29.2 (21,539) (29,271) (38,698) 9,427 24.4 (40,252)Contribution to outside entity (269) (246) (23) (9.3) (194) (971) (993) 22 2.2 (957)Gain (loss) on capital lease - - - n/a - (6,489) - (6,489) n/a -Unrealized gain (loss) on capital lease - - - n/a 1,301 - - - n/a (2,839)Unrealized gain (loss) fuel hedging # - - - n/a (3,725) - - - n/a -Other non-operating revenue (expense) 59 - 59 n/a 30 864 - 864 n/a (1,886)Total non-operating revenue (expense) 41,146 38,732 2,414 6.2 27,183 169,876 170,989 (1,113) (0.7) 142,459Income (loss) before depreciation (4,901) (6,853) 1,952 28.5 (13,189) (499) (9,133) 8,634 94.5 (13,260)Depreciation and amortization 18,797 18,006 (791) (4.4) 18,804 75,491 72,023 (3,468) (4.8) 74,814Net income (loss) $ (23,698) $ (24,859) $ 1,161 4.7 $ (31,993) $ (75,990) $ (81,156) $ 5,166 6.4 $ (88,074)Capital contributions 11,306 37,465Change in net assets (12,392) (38,525)Total net assets, beginning of the period 627,847 653,980Total net assets, end of the period $ 615,455$ 615,455* See detail broken out in schedule on the next page# Beginning July 1, 2010, <strong>Metro</strong> adopted GASB 53. The unrealized gain(loss) on fuel hedge is now reflected on the balance sheet.14