NOTICE OF MEETING AND AGENDA - Metro Transit
NOTICE OF MEETING AND AGENDA - Metro Transit
NOTICE OF MEETING AND AGENDA - Metro Transit

You also want an ePaper? Increase the reach of your titles
YUMPU automatically turns print PDFs into web optimized ePapers that Google loves.
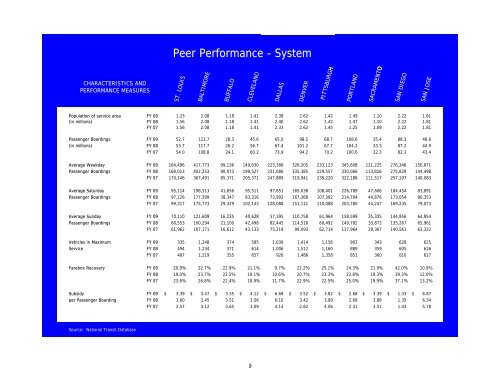
Peer Performance - SystemCHARACTERISTICS <strong>AND</strong>PERFORMANCE MEASURESST. LOUISBALTIMOREBALTIMOREBUFFALO BUFFALOCLEVEL<strong>AND</strong>CLEVEL<strong>AND</strong>DALLASDENVERDENVERPITTSBURGHPITTSBURGHPORTL<strong>AND</strong>PORTL<strong>AND</strong>SACRAMENTOSACRAMENTOSAN DIEGOSAN JOSEPopulation of service area FY 09 1.23 2.08 1.18 1.41 2.38 2.62 1.42 1.49 1.10 2.22 1.81(in millions) FY 08 1.56 2.08 1.18 1.41 2.40 2.62 1.42 1.47 1.10 2.22 1.81FY 07 1.56 2.08 1.18 1.41 2.33 2.62 1.45 1.25 1.09 2.22 1.81Passenger Boardings FY 09 52.7 123.7 28.3 45.6 65.0 98.2 68.7 108.6 35.4 88.3 46.6(in millions) FY 08 53.7 117.7 26.2 56.7 67.4 101.2 67.7 104.2 33.3 87.2 44.9FY 07 54.0 108.8 24.1 60.2 73.9 94.2 70.2 100.6 32.3 82.3 43.4Average Weekday FY 09 164,496 417,773 99,136 149,630 223,386 326,205 233,123 345,608 121,225 276,346 150,871Passenger Boardings FY 08 169,013 402,253 90,073 199,527 231,086 335,385 229,557 330,066 113,826 275,829 144,498FY 07 170,146 367,491 85,371 205,371 247,889 319,941 239,220 322,188 111,517 257,197 140,083Average Saturday FY 09 95,114 198,513 41,656 95,511 97,851 165,038 108,401 226,789 47,606 184,454 83,891Passenger Boardings FY 08 97,126 177,399 38,347 83,316 73,992 167,368 107,392 214,704 44,876 173,054 80,353FY 07 99,317 175,773 29,329 102,143 128,088 151,111 110,088 203,780 44,247 169,235 79,073Average Sunday FY 09 70,110 0 121,609 16,235 40,628 57,195 110,758 61,964 158,599 35,33533 144,956 64,954Passenger Boardings FY 08 60,553 100,294 21,100 42,498 82,445 114,518 60,492 149,782 33,872 135,267 65,961FY 07 61,962 107,171 16,612 43,133 75,219 99,093 62,714 137,964 28,367 140,561 63,322Vehicles in Maximum FY 09 335 1,248 374 585 1,039 1,414 1,156 902 343 628 625Service FY 08 494 1,234 371 614 1,006 1,512 1,160 889 359 605 626FY 07 487 1,219 355 657 926 1,486 1,358 851 360 610 617Farebox Recovery FY 09 20.9% 22.7% 22.9% 21.1% 9.7% 22.2% 25.1% 24.3% 21.9% 42.0% 10.9%FY 08 19.0% 23.7% 22.5% 19.1% 10.6% 20.7% 23.3% 22.8% 19.3% 39.3% 12.0%FY 07 23.6% 26.8% 22.4% 18.9% 11.7% 22.9% 22.5% 25.0% 19.9% 37.1% 13.2%Subsidy FY 09 $ 3.39 $ 3.47 $ 3.35 $ 4.12 $ 6.68 $ 3.52 $ 3.82 $ 2.68 $ 3.39 $ 1.33 $ 6.87per Passenger Boarding FY 08 3.60 3.45 3.51 3.56 6.10 3.42 3.89 2.68 3.88 1.35 6.34FY 07 2.57 3.12 3.65 3.09 4.14 2.82 4.06 2.31 3.51 1.43 5.78Source: National <strong>Transit</strong> Database9