NOTICE OF MEETING AND AGENDA - Metro Transit
NOTICE OF MEETING AND AGENDA - Metro Transit
NOTICE OF MEETING AND AGENDA - Metro Transit

You also want an ePaper? Increase the reach of your titles
YUMPU automatically turns print PDFs into web optimized ePapers that Google loves.
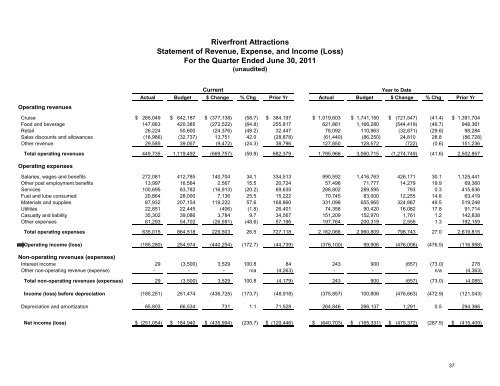
Riverfront AttractionsStatement of Revenue, Expense, and Income (Loss)For the Quarter Ended June 30, 2011(unaudited)Operating revenuesCurrent Year to DateActual Budget $ Change % Chg Prior Yr Actual Budget $ Change % Chg Prior YrCruise $ 265,049 $ 642,187 $ (377,138) (58.7) $ 384,197 $ 1,019,603 $ 1,741,150 $ (721,547) (41.4) $ 1,391,704Food and beverage 147,863 420,385 (272,522) (64.8) 255,817 621,861 1,166,280 (544,419) (46.7) 948,361Retail 26,224 50,600 (24,376) (48.2) 32,447 78,092 110,963 (32,871) (29.6) 98,284Sales discounts and allowances (18,986) (32,737) 13,751 42.0 (28,878) (61,440) (86,250) 24,810 28.8 (86,728)Other revenue 29,585 39,057 (9,472) (24.3) 38,796 127,850 128,572 (722) (0.6) 151,236Total operating revenues 449,735 1,119,492 (669,757) (59.8) 682,379 1,785,966 3,060,715 (1,274,749) (41.6) 2,502,857Operating expensesSalaries, wages and benefits 272,081 412,785 140,704 34.1 334,513 990,592 1,416,763 426,171 30.1 1,125,441Other post employment benefits 13,997 16,564 2,567 15.5 20,724 57,498 71,777 14,279 19.9 69,360Services 100,695 83,782 (16,913) (20.2) 69,635 288,802 289,595 793 0.3 415,636Fuel and lube consumed 20,864 28,000 7,136 25.5 15,222 70,745 83,000 12,255 14.8 63,419Materials and supplies 87,932 207,154 119,222 57.6 168,860 331,098 655,965 324,867 49.5 519,248Utilities 22,851 22,445 (406) (1.8) 26,401 74,358 90,420 16,062 17.8 91,714Casualty and liability 35,302 39,086 3,784 9.7 34,567 151,209 152,970 1,761 1.2 142,838Other expenses 81,293 54,702 (26,591) (48.6) 57,196 197,764 200,319 2,555 1.3 192,159Total operating expenses 635,015 864,518 229,503 26.5 727,118 2,162,066 2,960,809 798,743 27.0 2,619,815Operating income (loss) (185,280) 254,974 (440,254) (172.7) (44,739) (376,100) 99,906 (476,006) (476.5) (116,958)Non-operating revenues (expenses)Interest income 29 (3,500) 3,529 100.8 84 243 900 (657) (73.0) 278Other non-operating revenue (expense) - - - n/a (4,263) - - - n/a (4,363)Total non-operating revenues (expenses) 29 (3,500) 3,529 100.8 (4,179) 243 900 (657) (73.0) (4,085)Income (loss) before depreciation (185,251) 251,474 (436,725) (173.7) (48,918) (375,857) 100,806 (476,663) (472.9) (121,043)Depreciation and amortization 65,803 66,534 731 1.1 71,528 264,846 266,137 1,291 0.5 294,366Net income (loss) $ (251,054) $ 184,940 $ (435,994) (235.7) $ (120,446) $ (640,703) $ (165,331) $ (475,372) (287.5) $ (415,409)37