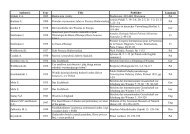
The first category of the comparative analysis of chosen CASE tools is a possibilityof reflecting particular types of UML diagrams. From the comparison (tab. 1)results that full support for UML 2.0 is provided only by three programs: EnterpriseArchitect, Poseidon for UML and Visual Paradigm. While designing smallinformation technology systems there is needed very often only a minimumnumber of diagrams, available in UMLet program. From the point of view of theneeds of scientific approach towards documenting the project and research workson DSS generator – whose outputs are specialized information technology systemswith different information structures and decision models – providing UML 2.0standard is justified (the value of weighted rate = 1; tab. 3).Table 3. Evaluation of CASE tools.Number of diagrams 13 13 9 9 13 7 9 6 −Range of diagrams supportScores (0-5) 5 5 4 4 5 3 4 2,5 1Number of formats 1 3 2 1 3 3 1 3 −Compatibility of systemplatformsComparative criterionEnterprise Architectversion 7.1Poseidon for UMLversion 6.0.2Rational SoftwareArchitect version 7.5.1Microsoft Visioversion 2007Visual Paradigm for UMLversion 6.3ArgoUMLversion 0.26StarUMLversion 5.0.2UMLetversion 9.03Scores (0-5) 3 5 4 3 5 5 3 5 0,5Number of compatible languages 10 11 5 4 14 9 3 0 −Source code generationScores (0-5) 4,5 5 4 3,5 5 4 3,5 0 1Reverse engineeringNumber of compatible languages 7 1 4 4 6 3 0 0 −Scores (0-5) 5 3 4 4 4,5 3,5 0 0 1Data importNumber of formats 3 3 0 3 5 5 2 0 −Scores (0-5) 3,5 3 0 3 5 5 3 0 0,6Data exportNumber of formats 2 1 3 2 3 1 1 0 −Scores (0-5) 4 3 5 3,5 5 3 3 0 0,6Diagrams exportNumber of formats 6 8 6 2 5 5 4 4 −Scores (0-5) 4,5 5 4,5 1 4 4 2 2 0,3Weighted sum of scores21,85 20,6 18,35 17,2 24,2 19 13,2 5,6 −Weighted average of scores (0-5)4,37 4,12 3,67 3,44 4,84 3,8 2,64 1,12 5RANK<strong>IN</strong>G POSITIONSource: Own preparation.CASE tools2 3 5 6 1 4 7 8For another decision criterion was chosen the availability of software versionoriented to various system platforms (operating systems). In case of all analyzedsolutions, the support for Windows systems can be taken as a common practice(tab. 1). Linux is also a quite popular platform. Because of long standing dominationof Windows systems that are widely spread in the decision maker’s environment,this requirement was highly evaluated and it received 3 scores (other systems1 score per each). On the other hand, in order to lower the importance of the availabilityof other versions (Linux, Mac OS) in the ranking, the criterion received alow value of weighted rate which is equal to 0,5 (tab. 3).WEIGHT (preferencefor a criterion)12
Another very important aspect of supporting the information technology engineeringis as first a possibility of generating the stub code and as second the abilityto create or modify a system model on the basis of the application source code(reverse engineering). The combination of these two functions gained the termround-trip engineering and it enables maintaining the cohesion of the system codefor its model. In the ranking these properties are highly preferred (the value ofweighted rate = 1; tab. 3) because they streamline the middle-out adaptation designingthat is used by the decision maker of the ranking. The main issue of suchan approach, opposed to the idea of top-down and bottom-up, is to focus attentionon the quick preparation a system prototype and next on its further development,adding new functions or procedures till the moment of forming the shape of a stablesystem which is able to be moved. The function of the reverse engineering insuch approach exempts us from making alternations in the project documentationafter frequent changes in the system code. On the stage of applying the generator ofinformation technology systems, especially valuable seems to be a possibility ofchanging the source code of generated systems which differ between each otherinto the model form. The ability to analyze CASE solutions in the discussed rage isshowed by table 1. It is clear that the number of supported standards (programminglanguages and others) for a particular tool within the generated source code is a bithigher than in case of the reverse engineering.Another function of CASE tools, which was taken into consideration in theranking, is possibilities of importing and exporting data files which were assignedan average preference value (weighted value = 0,6; tab. 3) because of their lowerusefulness in comparison with above described criteria. A dominating format ofdata exchange is XMI/XML, except UMLet and partially Rational Software Architectwhich are deprived of a function of files import. A leader in terms of bidirectionaldata exchange is Visual Paradigm. ArgoUML also has got a similarly developedimport function. Interesting is the fact of having MDL files reading interfacefrom the professional package of IBM (family of Rational Rose programs) by threeprograms what was distinguished in table 2.The last decisive criterion in the comparative analysis is a function of generatingdiagrams in a graphic format (JPG, PNG, SVG etc.; tab. 2). The weighted valuefor every category is very low (equals 0,3) because it does not have any influenceon the modelling quality. Apart from that, there are many programs in the marketfor graphic files conversion and in operating systems there is the ability to transfergraphics by a system buffer (clipboard), however, with a loss of quality in printing.Leaders in this category are Poseidon for UML, Enterprise Architect and RationalSoftware Architect, hoverer, the last position, what can be surprising, is held byMicrosoft Visio 2007 (tab. 3).13
- Page 1 and 2: WARSAW UNIVERSITY OF LIFE SCIENCES
- Page 3 and 4: PREFACEThe role of the various info
- Page 5: TABLE OF CONTENTSBECKER J.COMPARATI
- Page 8 and 9: 2. THE METHODOLOGY OF THE OBJECT OR
- Page 10 and 11: Gentleware [Gentleware, Poseidon…
- Page 14 and 15: 5. CONCLUSIONSCalculated weighted s
- Page 16 and 17: 14. Kaczmarski K. (2003), Extreme p
- Page 18 and 19: Figure 1. Development of controllin
- Page 20 and 21: 2. THE CHARACTERISTIC OF CORPORATE
- Page 22 and 23: They support formal strategy manage
- Page 24 and 25: SAS Strategy Performance Management
- Page 26 and 27: 4. CONCLUSIONDespite the fact that
- Page 28 and 29: LOGISTICS IN INFORMATION SYSTEMSKrz
- Page 30 and 31: work required to move and position
- Page 32 and 33: Today the information flow within t
- Page 34 and 35: ponents, store them, transport them
- Page 36 and 37: tions depend on the type of operati
- Page 38 and 39: members of the project can easily s
- Page 40 and 41: Figure 4 Evolution of ERP.Source: O
- Page 42 and 43: ments planning, and the execution s
- Page 44 and 45: company to fulfill customer needs),
- Page 46 and 47: DATA WAREHOUSE DESIGNWłodzimierz K
- Page 48 and 49: In the upper layer local data wareh
- Page 50 and 51: In the top-down design data warehou
- Page 52 and 53: Processes should form a hierarchy a
- Page 54 and 55: Oracle Warehouse Builder (OWB) is a
- Page 56 and 57: BUSINESS INTELLIGENCE SYSTEMS - IMP
- Page 58 and 59: a. Primary purpose of operational s
- Page 60 and 61: a. Multiple data marts and warehous
- Page 62 and 63:
5. THE BI SYSTEM COSTIn this chapte
- Page 64 and 65:
BUSINESS PROCESS MODELING - METHODS
- Page 66 and 67:
The (Rational) Unified Process is o
- Page 68 and 69:
was to be designed user-friendly fo
- Page 70 and 71:
architects and software engineers t
- Page 72 and 73:
THE SELECTION PHASE IN DECISION MAK
- Page 74 and 75:
Figure 1. Decision support system f
- Page 76 and 77:
decision levels.Most of the transpo
- Page 78 and 79:
Figure 4. The fuzzy expert system a
- Page 80 and 81:
5. CONCLUSIONSThe proposed system s
- Page 82 and 83:
XML namespaces, XML Schema, XQuery,
- Page 84 and 85:
SELECT XMLQuery('XQuery' PASSING XM
- Page 86 and 87:
Table 2. Results of Example 2.40000
- Page 88 and 89:
Table 5. Results of Example 5.40000
- Page 90 and 91:
8. XML Feeds of Current Weather Con
- Page 92 and 93:
2. STORAGE OF NATIVE XML DATAThere
- Page 94 and 95:
• a path index, which indexes the
- Page 96 and 97:
tional data is not very difficult i
- Page 98 and 99:
One of possibility of integration o
- Page 100 and 101:
DATA COMLETNESS ESTIMATION INMANAGE
- Page 102 and 103:
tion. Completeness level of a given
- Page 104 and 105:
Figure 1. Data volume observed duri
- Page 106 and 107:
Table 3. Classification matrix for