Sustainability Report 2012 - Transnet
Sustainability Report 2012 - Transnet
Sustainability Report 2012 - Transnet
- No tags were found...

You also want an ePaper? Increase the reach of your titles
YUMPU automatically turns print PDFs into web optimized ePapers that Google loves.
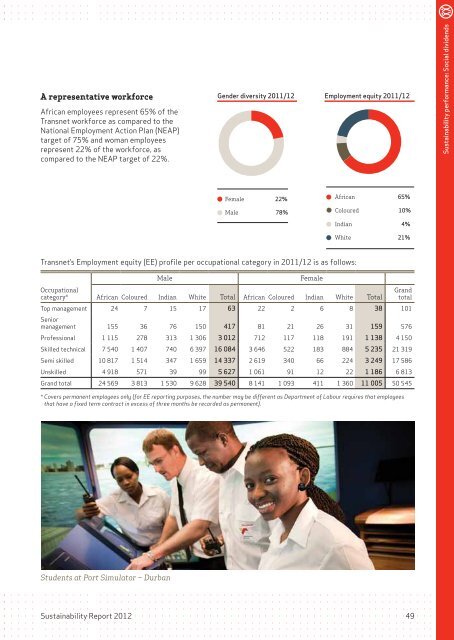
A representative workforceAfrican employees represent 65% of the<strong>Transnet</strong> workforce as compared to theNational Employment Action Plan (NEAP)target of 75% and woman employeesrepresent 22% of the workforce, ascompared to the NEAP target of 22%.Gender diversity 2011/12 Employment equity 2011/12<strong>Sustainability</strong> performance: Social dividendsFemale 22%Male 78%African 65%Coloured 10%Indian 4%White 21%<strong>Transnet</strong>’s Employment equity (EE) profile per occupational category in 2011/12 is as follows:MaleFemaleOccupationalcategory* African Coloured Indian White Total African Coloured Indian White TotalGrandtotalTop management 24 7 15 17 63 22 2 6 8 38 101Seniormanagement 155 36 76 150 417 81 21 26 31 159 576Professional 1 115 278 313 1 306 3 012 712 117 118 191 1 138 4 150Skilled technical 7 540 1 407 740 6 397 16 084 3 646 522 183 884 5 235 21 319Semi skilled 10 817 1 514 347 1 659 14 337 2 619 340 66 224 3 249 17 586Unskilled 4 918 571 39 99 5 627 1 061 91 12 22 1 186 6 813Grand total 24 569 3 813 1 530 9 628 39 540 8 141 1 093 411 1 360 11 005 50 545* Covers permanent employees only (for EE reporting purposes, the number may be different as Department of Labour requires that employeesthat have a fixed term contract in excess of three months be recorded as permanent).Students at Port Simulator – Durban<strong>Sustainability</strong> <strong>Report</strong> <strong>2012</strong>49