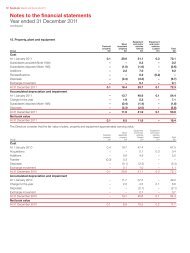
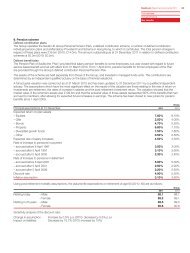
Remuneration reportcontinued2013 and beyondDuring 2013 the Committee will in addition to the established work plan:– continue to monitor and review the Group’s remuneration policy to ensure it continues to best align shareholders’ andmanagement’s interests, incentivises superior performance and that total award potential continues to be appropriate andcompetitive in terms of peer practice– continue to review the outcome of the BIS consultation and final form regulations.Performance graphThe total shareholder return delivered by the Company over the last five years is shown in the chart below. Over this period theCompany has delivered total shareholder return of 15% per annum (FTSE 250 (excluding investment trusts): 7% per annum; FTSE 350Super Sector Real Estate: -4% per annum). <strong>Savills</strong> was ranked 46th by TSR performance in the FTSE 250 (excluding investment trusts)and ranked 1st by performance in the FTSE 350 Super Sector Real Estate over the five years to 31 December <strong>2012</strong>.The Directors believe that the FTSE 250 (excluding investment trusts) remains the most appropriate index against which to compareTSR over the medium term as it is an index of companies of similar size to <strong>Savills</strong>. <strong>Savills</strong> TSR relative to that of the FTSE 350 SuperSector Real Estate Index is also shown, as this Index better reflects conditions in real estate markets over recent years.Total Shareholder Return (rebased)Five years to 31 December <strong>2012</strong>200180160140120100806040200Jan-08Apr-08Jul-08Oct-08Jan-09Apr-09Jul-09Oct-09Jan-10Apr-10Jul-10Oct-10Jan-11Apr-11Jul-11Oct-11Jan-12Apr-12Jul-12Oct-12Dec-12<strong>Savills</strong> FTSE 250 (excluding investment trusts) FTSE 350 Super Sector Real EstateOn behalf of the BoardClare HollingsworthChair of the Remuneration Committee13 March 201354 <strong>Savills</strong> <strong>plc</strong> <strong>Report</strong> and Accounts <strong>2012</strong>
Audited informationAnalysis of Directors’ remunerationSalary/fees Performance profit share BenefitsYear to Year££ # ££Year to 31 Decemberto31 December Year to31 December<strong>2012</strong><strong>2012</strong> 31 December<strong>2012</strong> Cash** Deferred<strong>2012</strong>Employerpensioncontribution(including finalsalary, GPPand profitshare waived) Total TotalYear to31 December<strong>2012</strong>£Year to31 December<strong>2012</strong>£Year to31 December2011£Executive DirectorsJeremy Helsby 225,000 997,407 301,280 11,216 45,000 1,579,903 1,268,257Simon Shaw 175,000 758,464 217,448 11,216 31,500 1,193,628 891,390Our business Our governance Our resultsNon-Executive DirectorsMartin Angle #(Chairman – Audit Committee/SeniorIndependent Director) 58,225 – – – – 58,225 51,250Tim Freshwater 45,000 – – – – 45,000 –Clare Hollingsworth ##(Chair – Remuneration Committee) 39,375 – – – – 39,375 –Charles McVeigh ##(Chairman – Remuneration Committee) 46,875 – – – – 46,875 50,000Peter Smith(Group Non-Executive Chairman) 150,000 – – – – 150,000 150,000Former DirectorsTimothy Ingram #(Formerly Senior Independent Director) 17,935 – – – – 17,935 45,000** Excluded from the performance profit share figure for <strong>2012</strong> for J Helsby is £25,313 and for S Shaw is £12,488 which were waived in favour of a contribution to registeredcharities (2011: J Helsby waived £20,000). No waiver was made in favour of a contribution to a registered pension scheme (2011: S Shaw waived £40,000)# M Angle was appointed as Senior Independent Director following T Ingram’s retirement as Non-Executive Director from the Company with effect from 9 May <strong>2012</strong>## C Hollingsworth was appointed as Chair of Remuneration Committee on her appointment as Non-Executive Director of the Company with effect from 2 April <strong>2012</strong> inplace of C McVeigh (who also ceased to be a member of the Committee on that date)Pensions disclosureIncrease/(decrease)in accrued pensionduring the year inexcess of inflation 131December<strong>2012</strong>31December2011Transfer value of theincrease/(decrease)less Director’scontributions 131December<strong>2012</strong>31December2011Accumulated totalaccrued pensionat the end ofthe year 231December<strong>2012</strong>31December201131December<strong>2012</strong>Total increasein accruedpension duringthe year 231December201131December<strong>2012</strong>Transfer valueof total pensionat start and endof year 3Increase/(decrease)in transfer value overthe year, less Director’scontributions 431 31December December2011 <strong>2012</strong>31December2011ExecutiveDirectors£ £ £ £ £ £ £ £ £ £ £ £JeremyHelsby 5 982 (66) 26,961 (1,730) 54,687 52,390 2,297 2,432 1,501,432 1,373,637 127,795 327,187Notes:1 The table shows the increase in accrued pension during the year, excluding any increase for inflation. The inflation measure has been taken as the increase in CPIsubject to a maximum of 5% p.a. in accordance with Schedule 3 of the Pension Scheme Act 1993. The transfer value of this increase in pension is also shown, less thecontributions made by the Director during the year2 The accumulated accrued pension entitlement shown is that which would have been paid annually based on service to the year end, or where the Director has left thePlan, determined at the Director’s date of leaving the Plan (30 April 2010) increased in line with the Plan Rules to the year end. The actual increase in pension over theyear is also shown3 The transfer value of the total pension accrued at the year end, determined at the year end is set out along with the comparative amounts at the end of the previous year4 The increase/(decrease) in the amount of this transfer value, less the contributions made by the Director during the period, has also been determined5 Pensionable service ceased at 31 March 2010 for all members of the Plan. J Helsby became a deferred pensioner at 30 April 2010. These figures do not reflect the cost ofthe non-pensionable salary supplement paid to J Helsby from April 2010<strong>Savills</strong> <strong>plc</strong> <strong>Report</strong> and Accounts <strong>2012</strong> 55