Savills plc 2012 Annual Report - (PDF) - Investor relations
Savills plc 2012 Annual Report - (PDF) - Investor relations
Savills plc 2012 Annual Report - (PDF) - Investor relations

Create successful ePaper yourself
Turn your PDF publications into a flip-book with our unique Google optimized e-Paper software.
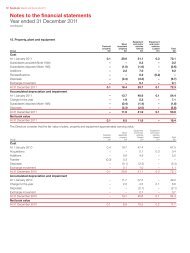
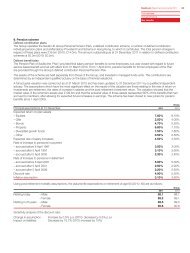
Notes to the financial statementsYear ended 31 December <strong>2012</strong>continuedPrice riskThe Group is not materially exposed to equity securities price riskbecause listed investments held on the statement of financialposition are not significant. The Group is not exposed tocommodity price risk.Interest rate riskThe Group has both interest-bearing assets and liabilities. TheGroup finances its operations through a mixture of retained profitsand bank borrowings, at both fixed and floating interest rates.Borrowings issued at variable rates expose the Group cash flow tointerest rate risk, which is partially offset by cash held at variablerates. Borrowings issued at fixed rates expose the Group to fairvalue interest rate risk. Group policy is to maintain at least 70% ofits borrowings in fixed rate instruments.For the year ended 31 December <strong>2012</strong>, if the average interest ratefor the year had changed with all other variables held constant, theGroup post tax profit for the year would have increased ordecreased as shown below:Increase in interest rates£m +0.50% +1.00% +1.50% +2.00%<strong>2012</strong>Estimated impact on post-tax profit 0.1 0.2 0.3 0.52011Estimated impact on post-tax profit 0.1 0.3 0.4 0.6Decrease in interest rates£m –0.50% –1.00% –1.50% –2.00%<strong>2012</strong>Estimated impact on post-tax profit (0.1) (0.2) (0.3) (0.3)2011Estimated impact on post-tax profit (0.1) (0.3) (0.4) (0.4)Credit riskCredit risk arises from cash and cash equivalents, derivativefinancial instruments and deposits with banks and financialinstitutions, as well as credit exposures to clients, includingoutstanding receivables and committed transactions. The Grouphas policies that require appropriate credit checks on potentialcustomers before engaging with them. A risk control frameworkis used to assess the credit quality of clients, taking into accountfinancial position, past experience and other factors.Individual risk limits for banks and financial institutions are setbased on external ratings and in accordance with limits set bythe Board. The utilisation of credit limits is regularly monitored.As at the reporting date, no significant credit risk existed in relationto banking counterparties. No credit limits were exceeded duringthe reporting period, and management does not expect anylosses from non-performance by these counterparties. Therewere no other significant receivables or individual trade receivablebalances as at 31 December <strong>2012</strong>.The table below shows Group cash balances split by counterpartyratings at the reporting date:Counterparty rating (provided by S&P)<strong>2012</strong>£m2011£mAA– 52.6 38.1A+ 16.4 22.2A 12.2 11.8A– 0.1 0.1BBB+ or below 11.5 7.8Total 92.8 80.0Liquidity riskThe Group maintains appropriate committed facilities to ensurethe Group has sufficient funds available for operations andexpansion. The Group prepares an annual funding plan approvedby the Board which sets out the Group’s expected financingrequirements for the next 12 months.Management monitors rolling forecasts of the Group’s liquidityreserve (comprising undrawn borrowing facilities (Note 22) andcash and cash equivalents (Note 19)) on the basis of expectedcash flow. This is carried out at local level in the operatingcompanies of the Group in accordance with Group practice aswell as on a Group consolidated basis.The table below analyses the Group’s financial liabilities and netsettledderivative financial liabilities into relevant maturity groupingsbased on the remaining period from the reporting date to thecontractual maturity date. The amounts disclosed in the table arethe contractual undiscounted cash flows. Balances due within 12months equal their carrying balances, as the impact of discountingis not significant.£mLess than1 yearBetween1 and 2 yearsBetween2 and 5 years<strong>2012</strong>Borrowings 1.1 – –Finance leases 0.1 – –Derivative financial instruments 0.1 – –Trade and other payables 206.3 0.4 0.2207.6 0.4 0.2£mLess than1 yearBetween1 and 2 yearsBetween2 and 5 years2011Borrowings 6.2 – –Finance leases 0.1 0.1 –Derivative financial instruments 0.1 – –Trade and other payables 181.1 8.8 0.2187.5 8.9 0.2Capital risk managementThe Group’s objectives when managing capital are:– to safeguard the Group’s ability to provide returns forshareholders and benefits for other stakeholders; and– to maintain an optimal capital structure to reduce the costof capital.74 <strong>Savills</strong> <strong>plc</strong> <strong>Report</strong> and Accounts <strong>2012</strong>