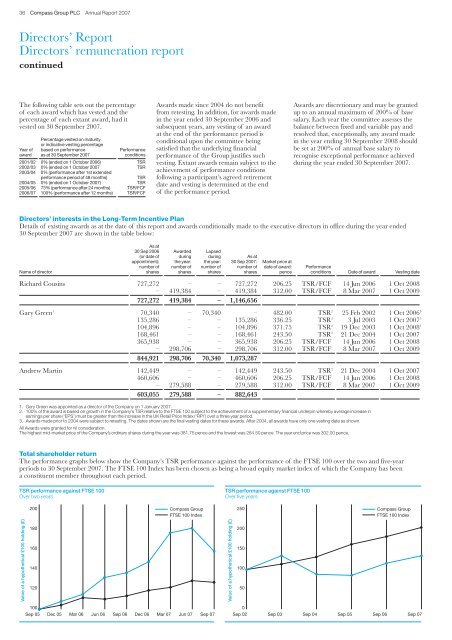
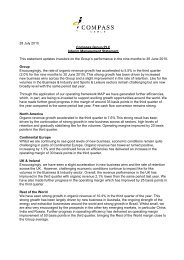
36 <strong>Compass</strong> <strong>Group</strong> PLC Annual Report 2007Directors’ ReportDirectors’ remuneration reportcontinuedThe following table sets out the percentageof each award which has vested and thepercentage of each extant award, had itvested on 30 September 2007.Percentage vested on maturityor indicative vesting percentageYear of based on performance Performanceaward as at 30 September 2007 conditions2001/02 0% (ended on 1 October 2006) TSR2002/03 0% (ended on 1 October 2007 TSR2003/04 0% (performance after 1st extendedperformance period of 48 months)TSR2004/05 0% (ended on 1 October 2007) TSR2005/06 73% (performance after 24 months) TSR/FCF2006/07 100% (performance after 12 months) TSR/FCFAwards made since 2004 do not benefitfrom retesting. In addition, for awards madein the year ended 30 September 2006 andsubsequent years, any vesting of an awardat the end of the performance period isconditional upon the committee beingsatisfied that the underlying financialperformance of the <strong>Group</strong> justifies suchvesting. Extant awards remain subject to theachievement of performance conditionsfollowing a participant’s agreed retirementdate and vesting is determined at the endof the performance period.Awards are discretionary and may be grantedup to an annual maximum of 200% of basesalary. Each year the committee assesses thebalance between fixed and variable pay andresolved that, exceptionally, any award madein the year ending 30 September 2008 shouldbe set at 200% of annual base salary torecognise exceptional performance achievedduring the year ended 30 September 2007.Directors’ interests in the Long-Term Incentive PlanDetails of existing awards as at the date of this report and awards conditionally made to the executive directors in office during the year ended30 September 2007 are shown in the table below:As at30 Sep 2006 Awarded Lapsed(or date of during during As atappointment): the year: the year: 30 Sep 2007: Market price atnumber of number of number of number of date of award: PerformanceName of director shares shares shares shares pence conditions Date of award Vesting dateRichard Cousins 727,272 – – 727,272 206.25 TSR/FCF 14 Jun 2006 1 Oct 2008– 419,384 – 419,384 312.00 TSR/FCF 8 Mar 2007 1 Oct 2009727,272 419,384 – 1,146,656Gary Green 1 70,340 – 70,340 – 482.00 TSR 2 25 Feb 2002 1 Oct 2006 3135,286 – – 135,286 336.25 TSR 2 3 Jul 2003 1 Oct 2007 3104,896 – – 104,896 371.75 TSR 2 19 Dec 2003 1 Oct 2008 3168,461 – – 168,461 243.50 TSR 2 21 Dec 2004 1 Oct 2007365,938 – – 365,938 206.25 TSR/FCF 14 Jun 2006 1 Oct 2008– 298,706 – 298,706 312.00 TSR/FCF 8 Mar 2007 1 Oct 2009844,921 298,706 70,340 1,073,287Andrew Martin 142,449 – – 142,449 243.50 TSR 2 21 Dec 2004 1 Oct 2007460,606 – – 460,606 206.25 TSR/FCF 14 Jun 2006 1 Oct 2008– 279,588 – 279,588 312.00 TSR/FCF 8 Mar 2007 1 Oct 2009603,055 279,588 – 882,6431. Gary Green was appointed as a director of the Company on 1 January 2007.2. 100% of the award is based on growth in the Company’s TSR relative to the FTSE 100 subject to the achievement of a supplementary financial underpin whereby average increase inearnings per share (‘EPS’) must be greater than the increase in the UK Retail Price Index (‘RPI’) over a three year period.3. Awards made prior to 2004 were subject to retesting. The dates shown are the final vesting dates for these awards. After 2004, all awards have only one vesting date as shown.All Awards were granted for nil consideration.The highest mid-market price of the Company’s ordinary shares during the year was 381.75 pence and the lowest was 264.50 pence. The year end price was 302.00 pence.Total shareholder returnThe performance graphs below show the Company’s TSR performance against the performance of the FTSE 100 over the two and five-yearperiods to 30 September 2007. The FTSE 100 Index has been chosen as being a broad equity market index of which the Company has beena constituent member throughout each period.TSR performance against FTSE 100Over two yearsTSR performance against FTSE 100Over five years200<strong>Compass</strong> <strong>Group</strong>FTSE 100 Index250<strong>Compass</strong> <strong>Group</strong>FTSE 100 IndexValue of a hypothetical £100 holding (£)180160140120Value of a hypothetical £100 holding (£)20015010050100Sep 05Dec 05 Mar 06 Jun 06 Sep 06Dec 06Mar 07 Jun 07Sep 070Sep 02Sep 03 Sep 04 Sep 05Sep 06Sep 07
37 <strong>Compass</strong> <strong>Group</strong> PLC Annual Report 2007Suspended plansThe LTIP was the only form of equity-basedincentive granted for the year ended30 September 2007, and this will continueto be the policy for the year ending30 September 2008.Awards prior to 2005 were made under twofurther share incentive plans in previous years:the <strong>Compass</strong> <strong>Group</strong> Bonus Matching SharesPlan and the <strong>Compass</strong> <strong>Group</strong> Share OptionPlan. Existing rights under these plans remainand may result in the vesting of further sharesin the capital of the Company. Shareholderapproval will be sought should the Companywish to make any further awards to executivedirectors under these suspended plans.Under the <strong>Compass</strong> <strong>Group</strong> BonusMatching Shares Plan, executive directorswere permitted to invest up to 50% of anypre-tax performance related bonus in theCompany’s shares. If the shares were heldfor three years and the director continued tobe employed by the <strong>Group</strong>, the participantwould be eligible to receive a proportion ofmatching shares based on the <strong>Group</strong> achievingunderlying earnings per share average growthin excess of RPI over the period.Under the <strong>Compass</strong> <strong>Group</strong> Share OptionPlan, executive directors were eligible toreceive awards equating to an annualmaximum of 200% of basic salary, at anexercise price not lower than the marketvalue of the Company’s shares on the dayprior to grant. Options would normally beexercisable on a sliding scale between thethird and tenth anniversaries of the dateof grant subject to satisfaction of anEPS performance condition, after whichthey lapse.The Company also has in place UK andoverseas all-employee plans in whichexecutive directors may participate. However,no grants have been made under these planssince 2005. Further details of the plans maybe found in prior years’ annual reports.Suspended plansThe tables below show the number of options and awards held by the directors in office during the year under the suspended share incentive plans.Directors’ bonus matching share awardsAs at date of As at Market priceappointment: 30 Sep 2007: at date ofnumber of number of award:Name of director shares shares pence Deferral periodGary Green 103,275 103,275 1 220.50 1 Oct 2004 – 30 Sep 20071. These shares can be called for by Mr Green in the 12 months from 1 October 2007.Directors’ interests in share optionsAs at30 Sep 2006 Exercised Lapsed(or date of during during As atappointment): the year: the year: 30 Sep 2007: Exercise Performancenumber of number of number of number of price: conditionsName of director shares shares shares shares pence (see notes below) Normal exercise periodGary GreenShare Option Plan 467,925 – – 467,925 316.10 1 29 Sep 2002–28 Sep 2009458,750 – – 458,750 371.60 2 13 Sep 2003–12 Sep 2010350,000 – – 350,000 430.00 2 19 Sep 2004–18 Sep 2011350,000 – – 350,000 422.00 2 23 May 2004–22 May 2012129,500 – – 129,500 292.50 2 30 Sep 2005–29 Sep 2012500,000 – – 500,000 320.00 2,4 28 May 2006–27 May 2013300,000 – – 300,000 316.25 2,3 3 Aug 2007–2 Aug 2014450,000 – – 450,000 229.25 2,3 1 Dec 2007–30 Nov 2014US Stock Bonus Plan 11,006 – – 11,006 – 5 1 Sep 20083,017,181 – – 3,017,181Andrew MartinShare Option Plan 650,000 – – 650,000 333.50 2,3 7 Jun 2007–6 Jun 2014365,000 – – 365,000 229.25 2,3 1 Dec 2007–30 Nov 2014Sharesave 3,532 3,532 – – 266.80 5 1 Sep 2007–29 Feb 20081,018,532 3,532 – 1,015,0001. Options were awarded under the <strong>Compass</strong> <strong>Group</strong> 1999 Executive Share Option Plan. The performance targets on these grants ceased to apply following the Granada <strong>Compass</strong> merger in 2000.2. Options were awarded under the <strong>Compass</strong> <strong>Group</strong> Share Option Plan. If average earnings per share growth is at least 6% over a three year period between grant and exercise, one third of shares underoption become exercisable. Options are exercisable in full at 12% growth and on a straight line basis in between.3. Performance is tested once only after a three year period. There is no further opportunity for retesting.4. The earnings per share target has not been met. The target may be retested annually for the life of the option.5. Options were awarded under an all-employee plan, and are not subject to satisfaction of a performance target.No awards or options were granted or exercised under any of the suspended share incentive plans during the year ended 30 September 2007.Earnings per share measures have been adjusted for awards made prior to 2005 to achieve consistency between IFRS and UK GAAP reporting.The highest mid-market price of the Company’s ordinary shares during the year was 381.75 pence and the lowest was 264.50 pence. The year end price was 302.00 pence.