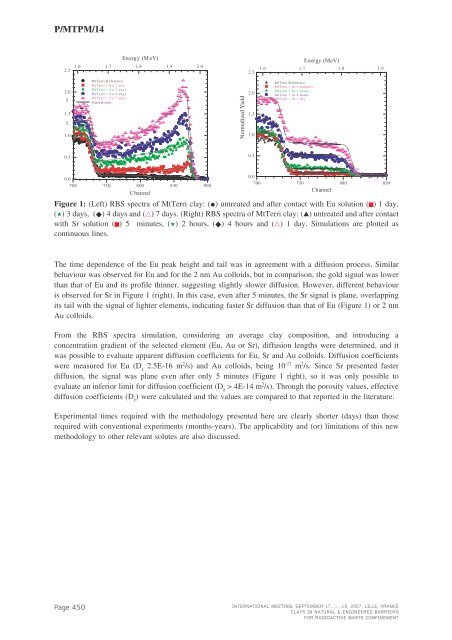
P/<strong>MTPM</strong>/142.5Energy (M eV)1.6 1.7 1.8 1.9 2.02.5Energy (MeV)1.6 1.7 1.8 1.92.0l1.5l1.0MtTerri ReferenceMtTerri +Eu 1dayMtTerri +Eu 3daysMtTerri +Eu 4daysMtTerri +Eu 7daysSimulationsNormalized Yield2.01.51.0MtTerri ReferenceMtTerri +Sr 5minutesMtTerri +Sr 2hoursMtTerri +Sr 4hoursMtTerri +Sr 1day0.50.50.0700 750 800 850 900Channel0.0700 750 800 850ChannelFigure 1: (Left) RBS spectra of MtTerri clay: (• ) untreated and after contact with Eu solution ( ) 1 day,( ) 3 days, ( ) 4 days and ( ) 7 days. (Right) RBS spectra of MtTerri clay: ( ) untreated and after contactwith Sr solution ( ) 5 minutes, ( ) 2 hours, ( ) 4 hours and ( ) 1 day. Simulations are plotted ascontinuous lines.SrThe time dependence of the Eu peak height and tail was in agreement with a diffusion process. Similarbehaviour was observed for Eu and for the 2 nm Au colloids, but in comparison, the gold signal was lowerthan that of Eu and its profile thinner, suggesting slightly slower diffusion. However, different behaviouris observed for Sr in Figure 1 (right). In this case, even after 5 minutes, the Sr signal is plane, overlappingits tail with the signal of lighter elements, indicating faster Sr diffusion than that of Eu (Figure 1) or 2 nmAu colloids.From the RBS spectra simulation, considering an average clay composition, and introducing aconcentration gradient of the selected element (Eu, Au or Sr), diffusion lengths were determined, and itwas possible to evaluate apparent diffusion coefficients for Eu, Sr and Au colloids. Diffusion coefficientswere measured for Eu (D a 2.5E-16 m 2 /s) and Au colloids, being 10 -17 m 2 /s. Since Sr presented fasterdiffusion, the signal was plane even after only 5 minutes (Figure 1 right), so it was only possible toevaluate an inferior limit for diffusion coefficient (D a > 4E-14 m 2 /s). Through the porosity values, effectivediffusion coefficients (D e ) were calculated and the values are compared to that reported in the literature.Experimental times required with the methodology presented here are clearly shorter (days) than thoserequired with conventional experiments (months-years). The applicability and (or) limitations of this newmethodology to other relevant solutes are also discussed.Page 450INTERNATIONAL MEETING, SEPTEMBER 17...>...18, 2007, LILLE, FRANCECLAYS IN NATURAL & ENGINEERED BARRIERSFOR RADIOACTIVE WASTE CONFINEMENT
P/<strong>MTPM</strong>/15NUMERICAL INTERPRETATIONOF IN SITU DIR DIFFUSION EXPERIMENTSON C-OX CLAY AT BURE SITEJ. Samper 1 , S. Dewonck 2 , L. Zheng 1 , Q. Yang 1 , A. Naves 11. Universidade da Coruña. Campus de Elviña s/n, 15192 A Coruña, Spain (jsamper@udc.es).2. ANDRA, Bure, France (Sarah.Dewonck@andra.fr).The Callovo-Oxfordian argillite is under investigation as a potential host rock for high-level wasterepository at <strong>Andra</strong> Underground Research Laboratory in Meuse/Haute Marne (France). DIR (DIffusionand Retention) is an experimental program which aims at characterizing diffusion and retention ofradionuclides in clay rock. Several boreholes were drilled to perform in situ diffusion experiments in orderto determine diffusion and retention properties of radionuclides such as tritium ( 3 H), iode ( 125 I - ), chloride( 36 Cl - ), sodium ( 22 Na + ), and cesium ( 134 Cs + ). DIR diffusion experiments were performed in vertical boreholesdrilled perpendicular to bedding. Bure clay exhibits mild diffusion anisotropy due to stratification. In situdiffusion experiments DIR2001, DIR2002 and EST208 were interpreted using data on the decrease oftracer activity in the testing interval. All the analysis were perfomed by CEA DPC Saclay. Theseexperiments could not be interpreted with analytical solutions because they do not account for the presenceof the filter, the gap between the casing and the borehole wall and an excavation disturbed zone which herewill be denoted as EdZ.DIR experiments were interpreted using numerical inverse models with INVERSE-CORE (Dai andSamper, 2004). Numerical interpretation of DIR experiments requires the use of 3-D models due todiffusion anisotropy. However, symmetry with respect to borehole axis allows the use of 2-D axisymmetricmodels. Comparison of the results of a 2-D anisotropic model with those of a 1-D modelindicates that concentrations at the testing interval computed with both models are similar and are notsensitive to the diffusion anisotropy ratio. Therefore, 1-D axisymmetric models were used to interpretDIR diffusion experiments. Numerical models were used to: 1) Compute numerical sensitivities ofconcentrations to model parameters; 2) Analyze parameter identifiability and parameter estimation errorswith synthetic experiments and 3) Interpret real DIR experiments. Here we report on the results of thenumerical interpretation of real DIR experiments.Real diffusion experiments relied on results of sensitivity runs and identifiability analysis of synthetic data.They were interpreted using a systematic approach according to which: 1) De filter and De gap were estimatedfirst using mostly early-time 2) De filter and De gap were fixed to the estimated values and De EDZ and φ EDZwere estimated using mostly concentration data measured and 3) De clay and φ clay were estimated using allconcentration date while De filter , De gap , De EDZ and φ EDZ were fixed at the values estimated in precious steps.This sequence of steps led to excellent fits to measured data. In addition, this approach worked well forall tracers and all experiments, providing robust results in all cases.Model results indicate unambiguously that a model without EdZ cannot fit measured data with values ofDe clay and φ clay within the range of values determined in lab experiments. In fact, measured concentrationdata can only be fitted with values of De clay and φ clay much larger than measured values. Therefore, HTOdata allow us to conclude that data are clearly affected by an EdZ and such data cannot be explainedwithout resorting to such hypothesis. Several sources of parameter uncertainty have been evaluated. Byadopting a volume of water in circulation system 5% smaller than the reference value, data can be fitequally well as with the reference volume, but with slightly smaller values of De clay , φ clay and φ EDZ . Thismeans that a small (5%) error in the volume of water in the circulation system has no major effect onINTERNATIONAL MEETING, SEPTEMBER 17...>...18, 2007, LILLE, FRANCECLAYS IN NATURAL & ENGINEERED BARRIERSFOR RADIOACTIVE WASTE CONFINEMENTPage 451