This report summarizes the basic characteristics of these cases based on a comprehensive, <strong>in</strong>-depth analysis of employmentdiscrim<strong>in</strong>ation litigation (hereafter EDL) for the time period 1987-2003. We explored the patterns, characteristics, trends,and outcomes of 1788 randomly selected cases from seven federal judicial districts.**The<strong>in</strong>dividual rightto equalemploymentopportunity—and access to thefederal courts toenforcethat right—has become a crucialresource<strong>in</strong> U.S. society’songo<strong>in</strong>g struggleto endemployment bias.We considered a wide range of case characteristics and variables, <strong>in</strong>clud<strong>in</strong>g:• Type of discrim<strong>in</strong>ation claimed (race, sex, age, national orig<strong>in</strong>, disability, etc.)• Alleged discrim<strong>in</strong>atory issues or practices (hir<strong>in</strong>g, fir<strong>in</strong>g, promotion, sexual harassment, etc.)• Case comparisons across judicial districts• Pla<strong>in</strong>tiff characteristics (race, sex, age, etc.)• Pla<strong>in</strong>tiff representation (s<strong>in</strong>gle or multiple pla<strong>in</strong>tiffs, class-actions, public <strong>in</strong>terest litigation support, etc.)• Case outcomes (settlement, trial, etc.)• Over-time trends <strong>in</strong> EDL case characteristics and outcomesEach of the nearly 2,000 cases has been coded for hundreds of variables, but this report summarizes and presents the data <strong>in</strong> themost straightforward and understandable terms possible. Our f<strong>in</strong>d<strong>in</strong>gs are generally depicted as simple graphics or figures ratherthan tables loaded with raw numbers and percentages. Also consistent with the purpose of the report to describe the caseloadsimply, we leave formal tests of statistical significance for future analysis. Our large sample size (n=1788) often would f<strong>in</strong>dstatistically significant differences, but <strong>in</strong> ways that would likely obscure and needlessly complicate the broader contours ofEDL cases that we want to convey <strong>in</strong> this report.The rema<strong>in</strong>der of the report is organized as follows. Part II explores the general characteristics of all EDL cases, <strong>in</strong>clud<strong>in</strong>g(but not limited to) those listed <strong>in</strong> the above bullet po<strong>in</strong>ts. Part III compares many of these characteristics across the sevenjudicial districts from which our sample was drawn. Part IV takes a closer look at pla<strong>in</strong>tiff characteristics, both <strong>in</strong> general, andwith respect to particular case characteristics. Part V turns our attention to case outcomes—and the case characteristics that <strong>in</strong>fluencethose outcomes—rang<strong>in</strong>g from early case dismissal to trials and appeals. Part VI exam<strong>in</strong>es whether and to what extent thebroader characteristics and outcomes of EDL cases have changed over the course of the study’s time horizon (1987-2003). F<strong>in</strong>ally,Part VII summarizes our key f<strong>in</strong>d<strong>in</strong>gs and suggests some cautious conclusions about the nature, reach, and impact of EDL<strong>in</strong> the last decade and a half, and where this crucial dimension of U.S. civil rights policy might be headed <strong>in</strong> the near-future.** Northern District of Ill<strong>in</strong>ois (NDIL); Southern District of New York (SDNY); Northern District of Georgia (NDGA); Northern District of California(NDCA); Northern District of Texas (NDTX); Eastern District of Louisiana (EDLA); Eastern District of Pennsylvania (EDPA).-2-
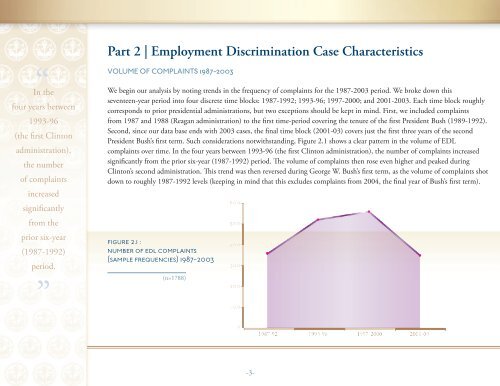
Part 2 | Employment <strong>Discrim<strong>in</strong>ation</strong> Case CharacteristicsVOLUME OF COMPLAINTS 1987-2003In thefour years between1993-96(the first Cl<strong>in</strong>tonadm<strong>in</strong>istration),the numberof compla<strong>in</strong>ts<strong>in</strong>creasedsignificantlyfrom theprior six-year(1987-1992)period.We beg<strong>in</strong> our analysis by not<strong>in</strong>g trends <strong>in</strong> the frequency of compla<strong>in</strong>ts for the 1987-2003 period. We broke down thisseventeen-year period <strong>in</strong>to four discrete time blocks: 1987-1992; 1993-96; 1997-2000; and 2001-2003. Each time block roughlycorresponds to prior presidential adm<strong>in</strong>istrations, but two exceptions should be kept <strong>in</strong> m<strong>in</strong>d. First, we <strong>in</strong>cluded compla<strong>in</strong>tsfrom 1987 and 1988 (Reagan adm<strong>in</strong>istration) to the first time-period cover<strong>in</strong>g the tenure of the first President Bush (1989-1992).Second, s<strong>in</strong>ce our data base ends with 2003 cases, the f<strong>in</strong>al time block (2001-03) covers just the first three years of the secondPresident Bush’s first term. Such considerations notwithstand<strong>in</strong>g, Figure 2.1 shows a clear pattern <strong>in</strong> the volume of EDLcompla<strong>in</strong>ts over time. In the four years between 1993-96 (the first Cl<strong>in</strong>ton adm<strong>in</strong>istration), the number of compla<strong>in</strong>ts <strong>in</strong>creasedsignificantly from the prior six-year (1987-1992) period. The volume of compla<strong>in</strong>ts then rose even higher and peaked dur<strong>in</strong>gCl<strong>in</strong>ton’s second adm<strong>in</strong>istration. This trend was then reversed dur<strong>in</strong>g George W. Bush’s first term, as the volume of compla<strong>in</strong>ts shotdown to roughly 1987-1992 levels (keep<strong>in</strong>g <strong>in</strong> m<strong>in</strong>d that this excludes compla<strong>in</strong>ts from 2004, the f<strong>in</strong>al year of Bush’s first term).figure 2.1 :number of edl compla<strong>in</strong>ts(sample frequencies) 1987-2003(n=1788)-3-