Reindustrialization in USA - Euler Hermes
Reindustrialization in USA - Euler Hermes
Reindustrialization in USA - Euler Hermes

Create successful ePaper yourself
Turn your PDF publications into a flip-book with our unique Google optimized e-Paper software.
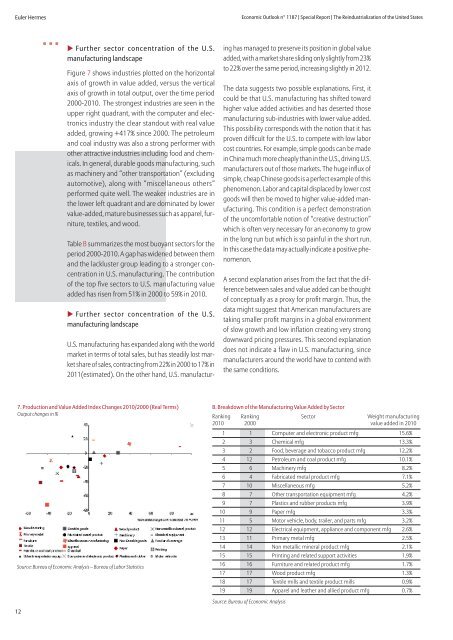
<strong>Euler</strong> <strong>Hermes</strong>Economic Outlook n° 1187 | Special Report | The <strong>Re<strong>in</strong>dustrialization</strong> of the United States• • •u Further sector concentration of the U.S.manufactur<strong>in</strong>g landscapeFigure 7 shows <strong>in</strong>dustries plotted on the horizontalaxis of growth <strong>in</strong> value added, versus the verticalaxis of growth <strong>in</strong> total output, over the time period2000-2010. The strongest <strong>in</strong>dustries are seen <strong>in</strong> theupper right quadrant, with the computer and electronics<strong>in</strong>dustry the clear standout with real valueadded, grow<strong>in</strong>g +417% s<strong>in</strong>ce 2000. The petroleumand coal <strong>in</strong>dustry was also a strong performer withother attractive <strong>in</strong>dustries <strong>in</strong>clud<strong>in</strong>g food and chemicals.In general, durable goods manufactur<strong>in</strong>g, suchas mach<strong>in</strong>ery and “other transportation” (exclud<strong>in</strong>gautomotive), along with “miscellaneous others”performed quite well. The weaker <strong>in</strong>dustries are <strong>in</strong>the lower left quadrant and are dom<strong>in</strong>ated by lowervalue-added, mature bus<strong>in</strong>esses such as apparel, furniture,textiles, and wood.Table B summarizes the most buoyant sectors for theperiod 2000-2010. A gap has widened between themand the lackluster group lead<strong>in</strong>g to a stronger concentration<strong>in</strong> U.S. manufactur<strong>in</strong>g. The contributionof the top five sectors to U.S. manufactur<strong>in</strong>g valueadded has risen from 51% <strong>in</strong> 2000 to 59% <strong>in</strong> 2010.u Further sector concentration of the U.S.manufactur<strong>in</strong>g landscapeU.S. manufactur<strong>in</strong>g has expanded along with the worldmarket <strong>in</strong> terms of total sales, but has steadily lost marketshare of sales, contract<strong>in</strong>g from 22% <strong>in</strong> 2000 to 17% <strong>in</strong>2011(estimated). On the other hand, U.S. manufactur<strong>in</strong>ghas managed to preserve its position <strong>in</strong> global valueadded, with a market share slid<strong>in</strong>g only slightly from 23%to 22% over the same period, <strong>in</strong>creas<strong>in</strong>g slightly <strong>in</strong> 2012.The data suggests two possible explanations. First, itcould be that U.S. manufactur<strong>in</strong>g has shifted towardhigher value added activities and has deserted thosemanufactur<strong>in</strong>g sub-<strong>in</strong>dustries with lower value added.This possibility corresponds with the notion that it hasproven difficult for the U.S. to compete with low laborcost countries. For example, simple goods can be made<strong>in</strong> Ch<strong>in</strong>a much more cheaply than <strong>in</strong> the U.S., driv<strong>in</strong>g U.S.manufacturers out of those markets. The huge <strong>in</strong>flux ofsimple, cheap Ch<strong>in</strong>ese goods is a perfect example of thisphenomenon. Labor and capital displaced by lower costgoods will then be moved to higher value-added manufactur<strong>in</strong>g.This condition is a perfect demonstrationof the uncomfortable notion of “creative destruction”which is often very necessary for an economy to grow<strong>in</strong> the long run but which is so pa<strong>in</strong>ful <strong>in</strong> the short run.In this case the data may actually <strong>in</strong>dicate a positive phenomenon.A second explanation arises from the fact that the differencebetween sales and value added can be thoughtof conceptually as a proxy for profit marg<strong>in</strong>. Thus, thedata might suggest that American manufacturers aretak<strong>in</strong>g smaller profit marg<strong>in</strong>s <strong>in</strong> a global environmentof slow growth and low <strong>in</strong>flation creat<strong>in</strong>g very strongdownward pric<strong>in</strong>g pressures. This second explanationdoes not <strong>in</strong>dicate a flaw <strong>in</strong> U.S. manufactur<strong>in</strong>g, s<strong>in</strong>cemanufacturers around the world have to contend withthe same conditions.7. Production and Value Added Index Changes 2010/2000 (Real Terms)Output changes <strong>in</strong> %Source: Bureau of Economic Analysis – Bureau of Labor Statistics12B. Breakdown of the Manufactur<strong>in</strong>g Value Added by SectorRank<strong>in</strong>g Rank<strong>in</strong>g Sector Weight manufactur<strong>in</strong>g2010 2000 value added <strong>in</strong> 20101 1 Computer and electronic product mfg 15.6%2 3 Chemical mfg 13.3%3 2 Food, beverage and tobacco product mfg 12.2%4 12 Petroleum and coal product mfg 10.1%5 6 Mach<strong>in</strong>ery mfg 8.2%6 4 Fabricated metal product mfg 7.1%7 10 Miscellaneous mfg 5.2%8 7 Other transportation equipment mfg 4.2%9 7 Plastics and rubber products mfg 3.9%10 9 Paper mfg 3.3%11 5 Motor vehicle, body, trailer, and parts mfg 3.2%12 12 Electrical equipment, appliance and component mfg 2.6%13 11 Primary metal mfg 2.5%14 14 Non metallic m<strong>in</strong>eral product mfg 2.1%15 15 Pr<strong>in</strong>t<strong>in</strong>g and related support activities 1.9%16 16 Furniture and related product mfg 1.7%17 17 Wood product mfg 1.3%18 17 Textile mills and textile product mills 0.9%19 19 Apparel and leather and allied product mfg 0.7%Source: Bureau of Economic Analysis