Reindustrialization in USA - Euler Hermes
Reindustrialization in USA - Euler Hermes
Reindustrialization in USA - Euler Hermes

You also want an ePaper? Increase the reach of your titles
YUMPU automatically turns print PDFs into web optimized ePapers that Google loves.
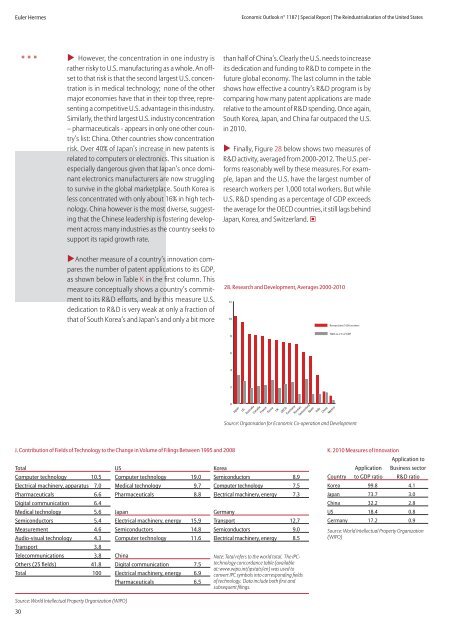
<strong>Euler</strong> <strong>Hermes</strong>Economic Outlook n° 1187 | Special Report | The <strong>Re<strong>in</strong>dustrialization</strong> of the United States• • •u However, the concentration <strong>in</strong> one <strong>in</strong>dustry israther risky to U.S. manufactur<strong>in</strong>g as a whole. An offsetto that risk is that the second largest U.S. concentrationis <strong>in</strong> medical technology; none of the othermajor economies have that <strong>in</strong> their top three, represent<strong>in</strong>ga competitive U.S. advantage <strong>in</strong> this <strong>in</strong>dustry.Similarly, the third largest U.S. <strong>in</strong>dustry concentration– pharmaceuticals - appears <strong>in</strong> only one other country’slist: Ch<strong>in</strong>a. Other countries show concentrationrisk. Over 40% of Japan’s <strong>in</strong>crease <strong>in</strong> new patents isrelated to computers or electronics. This situation isespecially dangerous given that Japan’s once dom<strong>in</strong>antelectronics manufacturers are now struggl<strong>in</strong>gto survive <strong>in</strong> the global marketplace. South Korea isless concentrated with only about 16% <strong>in</strong> high technology.Ch<strong>in</strong>a however is the most diverse, suggest<strong>in</strong>gthat the Ch<strong>in</strong>ese leadership is foster<strong>in</strong>g developmentacross many <strong>in</strong>dustries as the country seeks tosupport its rapid growth rate.than half of Ch<strong>in</strong>a’s. Clearly the U.S. needs to <strong>in</strong>creaseits dedication and fund<strong>in</strong>g to R&D to compete <strong>in</strong> thefuture global economy. The last column <strong>in</strong> the tableshows how effective a country’s R&D program is bycompar<strong>in</strong>g how many patent applications are maderelative to the amount of R&D spend<strong>in</strong>g. Once aga<strong>in</strong>,South Korea, Japan, and Ch<strong>in</strong>a far outpaced the U.S.<strong>in</strong> 2010.u F<strong>in</strong>ally, Figure 28 below shows two measures ofR&D activity, averaged from 2000-2012. The U.S. performsreasonably well by these measures. For example,Japan and the U.S. have the largest number ofresearch workers per 1,000 total workers. But whileU.S. R&D spend<strong>in</strong>g as a percentage of GDP exceedsthe average for the OECD countries, it still lags beh<strong>in</strong>dJapan, Korea, and Switzerland. ©uAnother measure of a country’s <strong>in</strong>novation comparesthe number of patent applications to its GDP,as shown below <strong>in</strong> Table K <strong>in</strong> the first column. Thismeasure conceptually shows a country’s commitmentto its R&D efforts, and by this measure U.S.dedication to R&D is very weak at only a fraction ofthat of South Korea’s and Japan’s and only a bit more28. Research and Development, Averages 2000-20101210Researchers/1000 workers8R&D as a % of GDPJ. Contribution of Fields of Technology to the Change <strong>in</strong> Volume of Fil<strong>in</strong>gs Between 1995 and 2008TotalComputer technology 10.5Electrical mach<strong>in</strong>ery, apparatus 7.0Pharmaceuticals 6.6Digital communication 6.4Medical technology 5.6Semiconductors 5.4Measurement 4.6Audio-visual technology 4.3Transport 3.8Telecommunications 3.8Others (25 fields) 41.8Total 100Source: World Intellectual Property Organization (WIPO)30USComputer technology 19.0Medical technology 9.7Pharmaceuticals 8.8JapanElectrical mach<strong>in</strong>ery, energy 15.9Semiconductors 14.8Computer technology 11.6Ch<strong>in</strong>aDigital communication 7.5Electrical mach<strong>in</strong>ery, energy 6.9Pharmaceuticals 6.5Korea6420Japan<strong>USA</strong>ustraliaCanadaFranceKoreaUKOECDGermanyRussianSwitzerlandSpa<strong>in</strong>ItalyCh<strong>in</strong>aMexicoSource: Organisation for Economic Co-operation and DevelopmentSemiconductors 8.9Computer technology 7.5Electrical mach<strong>in</strong>ery, energy 7.3GermanyTransport 12.7Semiconductors 9.0Electrical mach<strong>in</strong>ery, energy 8.5Note: Total refers to the world total. The IPCtechnologyconcordance table (availableat: www.wipo.<strong>in</strong>t/ipstats/en) was used toconvert IPC symbols <strong>in</strong>to correspond<strong>in</strong>g fieldsof technology. Data <strong>in</strong>clude both first andsubsequent fil<strong>in</strong>gs.K. 2010 Measures of InnovationApplicationApplication toBus<strong>in</strong>ess sectorCountry to GDP ratio R&D ratioKorea 99.8 4.1Japan 73.7 3.0Ch<strong>in</strong>a 32.2 2.8US 18.4 0.8Germany 17.2 0.9Source: World Intellectual Property Organization(WIPO)